3D MAS NMR Experiment Utilizing Through-Space
The MIT Faculty has made this article openly available.
Please share
how this access benefits you. Your story matters.
Citation
Donovan, Kevin J. et al. “3D MAS NMR Experiment Utilizing
Through-Space 15N–15N Correlations.” Journal of the American
Chemical Society 139, 19 (May 2017): 6518–6521 © 2017 American
Chemical Society
As Published
http://dx.doi.org/10.1021/jacs.7b01159
Publisher
American Chemical Society (ACS)
Version
Author's final manuscript
Citable link
http://hdl.handle.net/1721.1/114858
Terms of Use
Article is made available in accordance with the publisher's
policy and may be subject to US copyright law. Please refer to the
publisher's site for terms of use.
A 3D MAS NMR experiment utilizing through-space
15N-
15N
correlations
Kevin J. Donovan
†‡, Robert Silvers
†‡, Sara Linse
§, and Robert G. Griffin
†*†Department of Chemistry and Francis Bitter Magnet Laboratory, Massachusetts Institute of Technology, Cambridge, Massachusetts 02139
§ Department of Biochemistry and Structural Biology, Lund University, Lund, Sweden ‡These authors contributed equally
Supporting Information Placeholder
ABSTRACT: We demonstrate a novel 3D NNC magic angle spin-ning (MAS) NMR experiment that generates 15N-15N internuclear
contacts in protein systems using an optimized 15N-15N proton assisted
recoupling (PAR) mixing period and a 13C dimension for improved
resolution. The optimized PAR condition permits the acquisition of high signal-to-noise 3D data that enables backbone chemical shift assignments using a strategy that is complementary to current schemes. The spectra can also provide distance constraints. The utility of the experiment is demonstrated on an M0Aβ1-42 fibril sample that yields
high-quality data that is readily assigned and interpreted. The 3D NNC experiment therefore provides a powerful platform for solid-state protein studies and is broadly applicable to a variety of systems and experimental conditions.
Protein structure determination using magic angle spinning (MAS) NMR spectroscopy invariably begins with chemical shift as-signments, where each distinct resonance is associated with a specific nuclear site. Resonance assignment is typically accomplished using 2D and 3D experiments where magnetization is transferred among
1H/13C/15N nuclei using dipole recoupling experiments designed to
reintroduce the coupling attenuated by MAS. While this initial step is of crucial importance, it is often tedious and challenging. Homonuclear dipolar recoupling in 2D and 3D assignment experiments predomi-nantly utilizes 13C-13C magnetization transfer, due to the prevalence of 13C nuclei in biological samples, and to a favorable gyromagnetic ratio
of 13C. In principle, it is also possible to use 15N-15N couplings for
assignments and structural studies, an approach that is appealing be-cause of the excellent resolution of the 15N dimension. Accordingly,
previous approaches employed proton driven spin diffusion (PDSD) techniques to generate 15N-15N correlation spectra of three model
peptides1-2, three model proteins3-5, and more recently, oriented
mem-branes6. Additionally, a 15N-15N spectrum obtained using an early
version of proton assisted recoupling (PAR) was reported7. Despite the
fact that these initial results are very promising, 15N-15N techniques
have not evolved to be part of the standard repertoire of MAS protein experiments, primarily for three reasons: (1) the sensitivity in the PDSD and the initial PAR spectra is low and does not permit extension to higher dimensions; (2) cross peaks for long-rang contacts are often missing from the spectra; and (3) the mixing times are 2-5 s and there-fore the total experimental time is long. Here we describe a novel 3D NNC experiment (depicted in Figure 1A) that utilizes an optimized
15N-15N PAR protocol that yields excellent 15N sensitivity, and
there-fore easily extends to a third directly detected 13C dimension to further
increase the resolution. Furthermore, the PAR mixing sequence is short (20 ms) and the spectra display an abundance of cross peaks.
As mentioned above, 3D MAS experiments usually utilize 13C-13C
correlations (generated using RFDR8-9, DARR10, PDSD11-12, or PAR13
mixing, amongst others) that are resolved with a 15N dimension. The
transfer from 15N to 13C is typically based on SPECIFIC-CP14-16 or
other 15N-13C transfer techniques17-19. This combination leads to a suite
of experiments used for backbone resonance assignments that includes a combination of NCA/NCACX/NCACB20-25, NCO/NCOCX21-25,
and CONCA/CANCO23-25. The 3D NNC, however, allows for the
acquisition of non-redundant and complementary information that is otherwise inaccessible and thus facilitates comprehensive assignment strategies when combined with other data sets. This unique sequence shares features with previous 15N-15N correlation experiments in
liq-uids26-27 as well as solid, deuterated samples at high MAS frequencies28.
Additionally, direct 15N detection has recently been used for proteins in
solution experiments29. However, the NNC is distinguished from the
above experiments since it utilizes through-space 15N-15N dipole
cou-Figure 1: The 3D NNC pulse sequence is shown in A) with phase
cycling: φ1 = 02, φ2 = 0022, φ3 = 1, φ4 = 2002, φ5 = 0123, φ6 = 2002
0220, φrec = 0123 2301. The CP, PAR, and SPECIFIC-CP blocks
are color coded to arrows in (B) illustrating the corresponding magnetization transfer. Additionally, B) contrasts the mode of mixing for the NNC experiment, and commonly used protocols (NCACX, NCOCX, CONCA), illustrating their complementary information due to reliance on separate contacts. C) visualizes the internuclear distances and corresponding dipole coupling values for a range of 15N-15N contacts in α-helices and parallel and
anti-parallel β-sheets. The residue interval label (i.e. i ± 1, i ± 2, etc.) is color coded to the lines/arrows illustrating transfer. The 15N-15N
2
Figure 2: 2D 15N-15N homonuclear correlation spectra on M 0Aβ1-42.
A) gives a comparison of 1D traces extracted from the 2D spectra in B)-D) as indicated by a gray line, with a comparison of measured signal-to-noise (S/N) and total experiment times. Panels B)-D) show a τmix = 12.8 ms 15N-15N RFDR (green), a τmix = 20 ms 15N-15N PAR
(red), and a τmix = 4 s 15N-15N PDSD (blue), respectively. Cross-peak
assignments are shown. pling to mediate coherence transfer and generate homonuclear
con-tacts. However, 15N homonuclear dipolar recoupling remains difficult
to implement in non-model samples such as M0Aβ1-42 (as opposed to
N-f-MLF-OH30 or GB131), the 42 amino acid protein that forms toxic
fibril species associated with Alzheimer’s disease32-46.While this system
is well suited for solid state NMR analysis because of its monodispersi-ty and small molecular size (enabling high sensitivimonodispersi-ty), it presents many difficulties for collecting high-quality data as it is significantly more structurally heterogeneous, and less static than any of the usual model systems. It is for this reason that we have chosen M0Aβ1−42 to test the
efficiency of the NNC protocol.
To demonstrate the importance of PAR mixing we compared the signal-to-noise ratio, the number of observed cross peaks, and maxi-mum distance observed for three available 15N-15N homonuclear
mix-ing schemes: RFDR (τmix = 12.8 ms), PDSD (τmix = 4 s), and PAR (τmix
= 20 ms). These results are illustrated in Figure 2. We found that 15 N-15N mixing with the first-order recouping sequence RFDR8-9 (Figure
2A), yields no cross-peaks due to the small homonuclear dipolar
cou-plings <50 Hz (Figure 1C). Using 15N-15N PDSD11-12, a second-order
recoupling sequence, we observed a limited number of cross peaks (Figure 2B). However, in addition to the minimal quantity of cross-peaks, this experiment requires τmix = 4 s, and all the cross-peaks are
assigned to distances <3.5 Å (i±1). In contrast, the 15N-15N PAR
exper-iment, also a second-order recoupling sequence, shows significantly more cross-peaks than the PDSD, and distances of up to 6.8 Å are observed. These are apparent in Figure 2C. Figure 2D compares 1D traces from the RFDR, PDSD, and PAR spectra, clearly showing the superior signal intensity given by PAR, and the presence of additional
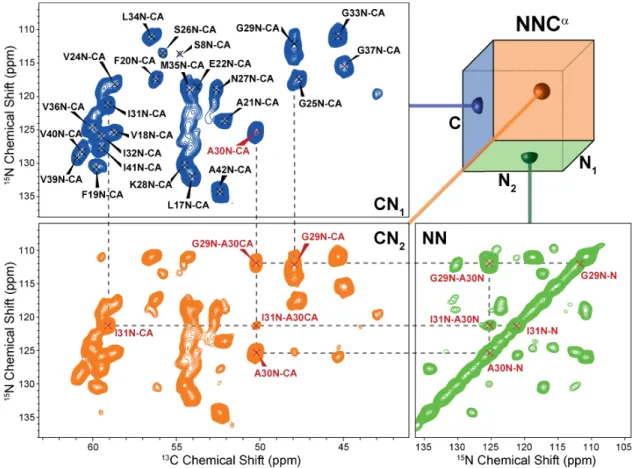
Figure 3: 3D NNCα projections of M0Aβ1-42. One CN projection (CN1) shows one peak per residue correlating the nitrogen and the
Cα of the same amino acid i. The second CN projection (CN2) is identical to CN1 plus additional peaks due to NN-mixing. For each Cα/N
pair (which forms the diagonal peak) there are peaks that correspond to nearby 15N sites, most prominently the i±1 backbone amide 15N
nuclei. The third projection (NN) is identical to a 2D 15N-15N PAR spectrum showing the backbone nitrogen of residue i as diagonal and
other peaks (mostly backbone nitrogen of residues i±1) as cross-peaks. The 3D spectrum was recorded on a Bruker Avance III 800 MHz spectrometer at ωr/2π = 20 kHz with temperature set to 277 K. A more detailed assignment is shown in Figure S1.
3
cross peaks that are attributed to long-range contacts (which are not present in either the RFDR or PDSD spectra). It is also important to note that the total acquisition time for the 2D PAR in Figure was around 21 h, while the PDSD required 39 h, nearly twice as long.
The 2D 15N-15N spectra utilize an optimum PAR matching
condi-tion, enabling this innovative approach to backbone resonance assign-ments on disease-relevant M0Aβ1-42. The optimum condition was
obtained using a high-throughput protocol to evaluate magnetization transfer across an array of conditions, as described in detail in the Supporting Information. While the PAR mixing period in the NNC experiment generates 15N-15N contacts that are both short-range
(be-tween neighboring residues) and long-range (be(be-tween non-neighboring residues), only the short-range contacts are useful for sequential assignment. Thus, the PAR mixing time can be adjusted to maximize short-range over long-range contacts. Long-range contacts
are undesirable for sequential assignment purposes as they may aug-ment spectral congestion and/or obfuscate the assignaug-ment process. However, long-range contacts are essential for structural characteriza-tion, and can be extracted from NNC spectra collected at longer mix-ing times. The NNC spectra shown here were collected with a PAR τmix=20 ms, which yields predominantly short-range contacts in
M0Aβ1-42, with only minor long-range contacts that are easily
distin-guished by significantly weaker intensities.
The NNC pulse sequence (as shown in Figure 1A) consists of three transfer steps: 1H-15N CP, 15N-15N PAR mixing, and 15N-13C
SPECIFIC-CP, where the magnetization is selectively transferred to either the Cα or the CO nuclei to generate either an NNCα (see
Figures 2 and 3) or an NNCO (see Figures S2 and S3) spectrum.
Transfer efficiencies for the 15N-15N PAR mixing alone (i.e. in
comparison to 1H-15N CP and 15N-13C SPECIFIC-CP without 15N-15N
PAR mixing) are shown in Figure S4 for N-f-MLF-OH and M0Aβ1-42.
The remaining 15N magnetization after 15N-15N PAR mixing depends
on the mixing time and relaxation rates. After 20 ms of PAR mixing, 53% and 20% of the magnetization remain for N-f-MLF-OH and M0Aβ1-42,respectively. Besides the 15N-15N PAR mixing, the total
efficiency of the 3D NNC experiment depends on the heteronuclear transfer, which is coupled to the selectivity and also the sample and the experimental conditions chosen (vide infra).
A comparison of NNCα and NNCO for M
0Aβ1-42 shows the
NNCα spectrum to have superior resolution due to larger chemical shift dispersion in the Cα spectral region than the CO spectral region. However, the diagonal of the NNCO spectrum contains additional
information as it displays correlations between the 15N of residue i and
the 13CO of residue i-1, whereas the diagonal of the NNCα shows
correlations only between nuclei within the same residue. Figure 1B illustrates the internuclear correlations obtained in an NNC experi-ment vs. commonly used 13C-13C based experiments, and Figure 1C
shows internuclear distances (and corresponding dipole coupling values) in standard α-helix as well as parallel and anti-parallel β-sheet structures for the 15N-15N contacts observed with the 3D NNC
se-quence.
A distinct advantage of the NNC experiment is the increased res-olution gained from the inclusion of a 3rd (13C) dimension. The 2D 15N-15N PAR spectrum shown in Figure displays efficient
magnetiza-tion transfer, but limited resolumagnetiza-tion. However, both the 3D NNCα as well as the 3D NNCO spectra have immensely improved resolution
over their 2D counterparts.
Figure 3 displays 2D projections for each of the three unique
fac-es of the NNC cube. The CN1 projection is virtually identical to an
NCA experiment22 or the Cα region of a short-mixing ZF-TEDOR
experiment47. Hence, CN
1 shows one peak per residue correlating the
nitrogen and the Cα of the same amino acid. The CN2 projection is
identical to CN1 plus additional peaks due to 15N-15N mixing. For each
Cα/N pair (which forms the diagonal peak) there are peaks that correspond to nearby 15N sites, most prominently the i±1 backbone
amide 15N nuclei. The third projection (NN) is identical to a 2D 15 N-15N PAR spectrum showing the backbone nitrogen of residue i as a
diagonal peak, as well as other coherences (mostly backbone nitrogen of residues i±1) as cross-peaks. The correlations between these three projections and the information therein is shown as example for resi-due A30 of M0Aβ1-42 in Figure and in greater detail in Figure S1.
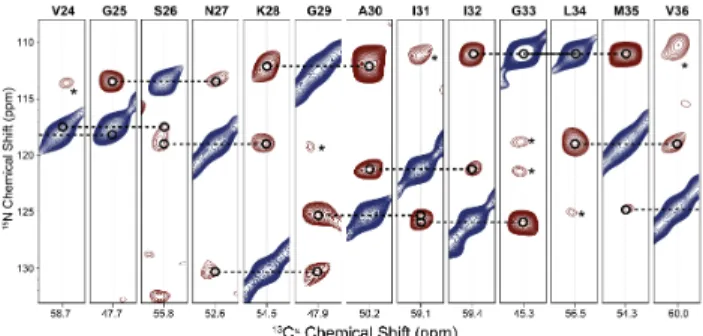
For resonance assignment, each diagonal peak can be arranged in a strip plot (Figure 4) that displays the sequential walk. Each strip shows the diagonal peak (blue) and one or more cross-peaks (red), unless overlapping with other peaks. Typically, the strongest cross-peaks are of i±1 residues. Occasionally, i±2 residues can be present (as discussed earlier), for example between N27 and G29 (6.6 Å, DNN=4.3
Hz), I31 and G33 (6.8 Å, DNN=3.93 Hz), as well as G33 and M35 (5.8
Å, DNN=6.3 Hz).
In summary, the 3D NNC experiment presented here provides a novel and compelling approach to protein backbone assignments by generating unique data not otherwise accessible. Typically, 13C-13C
mixing schemes are used to correlate consecutive residues in proteins while using 15N to resolve spectral crowding. The 3D NNC
experiment, however, generates 15N-15N correlations and uses 13C for
spectral decongestion. Application of the PAR mixing scheme coupled with a careful optimization of the PAR fields provides efficient 15N
homonuclear magnetization transfer, enabling high signal-to-noise data in 3D settings. While this initial demonstration serves as a showcase of the NNC experimental protocol, variations are readily envisaged with different heteronuclear transfer techniques to accomplish the 15N-13C
transfer including adiabatic passage48, Lee-Goldburg decoupling49,
TEDOR18, PAIN-CP19, and RESPIRATION-CP17, amongst others.
These may offer improved selectivity and/or efficiency depending on the sample and the experimental conditions (i.e. spinning frequency and magnetic field). Furthermore, the NNC sequence naturally lends itself to other experiments of higher dimensionality that include addi-tional transfer steps (e.g. a 4D NNCC sequence) and 1H detection. As
experimental NMR transitions to higher magnetic fields and faster sample spinning, we expect the NNC protocol to have a continued relevance as PAR has previously shown excellent functionality at higher spinning frequencies (i.e. 65 kHz)50. Finally, while the NNC
experi-ment was developed for sequential assignexperi-ments, we anticipate that it will provide long-range 15N-15N contacts (using longer mixing times)
that are highly valuable for structural characterization. We foresee this approach to be broadly applicable to a large variety of samples
includ-Figure 2: Strip plot of the 3D NNCα of M0Aβ1-42. Each strip
displays the diagonal peak of residue i (blue) and several cross-peaks (red). The most prominent cross-cross-peaks at 20 ms PAR mixing are from residues i±1, although cross-peaks from resi-dues i±2 can be present (*). The sequential backbone walk is indicated by dashed lines. Colors do not indicate sign and are solely used as visual aids.
4
ing protein crystals and fibrils, nucleic acids, as well as membrane proteins and sedimented proteins.
ASSOCIATED CONTENT Supporting Information
The Supporting Information is available free of charge on the ACS Publications website. The Supporting Information contains a detailed Experimental Section and Supporting Figures S0-S4.8-9, 11-15, 38, 42, 51-53
AUTHOR INFORMATION Corresponding Author
Author Contributions
‡K.J.D. and R.S. contributed equally to this work.
Notes
The authors declare no competing financial interests.
ACKNOWLEDGMENT
The research was supported by grants from the National Institutes of Biomedical Imaging and Bioengineering (EB- 001960, EB-002026, and EB-002804) to R.G.G. and by the Swedish Research Council (VR) and a European Research Council (ERC) Advanced Grant to S.L. R.S. is funded by a DFG research fellowship (SI2105/1-1).
REFERENCES
(1) Reif, B.; Hohwy, M.; Jaroniec, C. P.; Rienstra, C. M.; Griffin, R. G., J. Magn.Res. 2000, 145, 132-141.
(2) Traaseth, N. J.; Gopinath, T.; Veglia, G., J. Phys. Chem. B 2010, 114, 13872-13880.
(3) van Rossum, B.-J.; Castellani, F.; Pauli, J.; Rehbein, K.; Hollander, J.; de Groot, H. J. M.; Oschkinat, H., J. Biomol NMR 2003, 25, 217-223.
(4) Seidel, K.; Etzkorn, M.; Heise, H.; Becker, S.; Baldus, M., ChemBioChem 2005, 6, 1638-1647.
(5) Franks, W. T.; Wylie, B. J.; Stellfox, S. A.; Rienstra, C. M., J. Am. Chem. Soc. 2006, 128, 3154-3155.
(6) Mote, K. R.; Gopinath, T.; Traaseth, N. J.; Kitchen, J.; Gor’kov, P. L.; Brey, W. W.; Veglia, G., J. Biomol. NMR 2011, 51, 339.
(7) Lewandowski, J. R.; Paëpe, G. D.; Eddy, M. T.; Griffin, R. G., J. Am. Chem. Soc. 2009, 131, 5769-5776.
(8) Bennett, A. E.; Griffin, R. G.; Ok, J. H.; Vega, S., J. Chem. Phys. 1992, 96, 8624-8627.
(9) Bennett, A. E.; Rienstra, C. M.; Griffiths, J. M.; Zhen, W. G.; Lansbury, P. T.; Griffin, R. G., J. Chem. Phys. 1998, 108, 9463-9479.
(10) Takegoshi, K.; Nakamura, S.; Terao, T., Chem. Phys. Lett. 2001, 344, 631-637.
(11) Suter, D.; Ernst, R. R., Phys. Rev. B 1982, 25, 6038-6041.
(12) Szevernyi, N.; Sullivan, M.; Maciel, G., J. Magn. Reson. 1982, 47, 462-475. (13) DePaëpe, G.; Lewandowski, J. R.; Loquet, A.; Böckmann, A.; Griffin, R. G., J. Chem. Phys. 2008, 129, 245101.
(14) Baldus, M.; Petkova, A. T.; Herzfeld, J.; Griffin, R. G., Mol Phys 1998, 95, 1197-1207.
(15) Petkova, A. T.; Baldus, M.; Belenky, M.; Hong, M.; Griffin, R. G.; Herzfeld, J., J. Magn Reson. 2003, 160, 1-12.
(16) Rienstra, C. M.; Hohwy, M.; Hong, M.; Griffin, R. G., J. Am. Chem. Soc. 2000, 122, 10979-10990.
(17) Jain, S.; Bjerring, M.; Nielsen, N. C., J. Phys. Chem, Lett. 2012, 3, 703-708. (18) Jaroniec, C. P.; Filip, C.; Griffin, R. G., J. Am. Chem. Soc. 2002, 124, 10728-10742.
(19) Lewandowski, J. R.; De Paëpe, G.; Griffin, R. G., J. Am. Chem. Soc. 2007, 129, 728-729.
(20) Igumenova, T. I.; McDermott, A. E.; Zilm, K. W.; Martin, R. W.; Paulson, E. K.; Wand, A. J., J. Am. Chem, Soc. 2004, 126, 6720-6727.
(21) Marulanda, D.; Tasayco, M.; McDermott, A.; Cataldi, M.; Arriaran, V.; Polenova, T., J. Am. Chem. Soc. 2004, 126, 16608-16620.
(22) Pauli, J.; Baldus, M.; Rossum, B. v.; de Groot, H.; Oschkinat, H., ChemBioChem 2001, 2, 272-281.
(23) Shi, L.; Lake, E.; Ahmed, M.; Brown, L.; Ladizhansky, V., BBA - Biomembranes 2009, 1788, 2563-2574.
(24) Sperling, L. J.; Nieuwkoop, A. J.; Lipton, A. S.; Berthold, D. A.; Rienstra, C. M., J. Biomol. NMR 2010, 46, 149-155.
(25) Schuetz, A.; Wasmer, C.; Habenstein, B.; Verel, R.; Greenwald, J.; Riek, R.; Böckmann, A.; Meier, B. H., ChemBioChem 2010, 11, 1543-1551.
(26) Frenkiel, T.; Bauer, C.; Carr, M. D.; Birdsall, B.; Feeney, J., J. Magn. Reson 1990, 90, 420-425.
(27) Diercks, T.; Coles, M.; Kessler, H., J. Biomolecular NMR 1999, 15, 177-180.
(28) Andreas, L. B.; Stanek, J.; Le Marchand, T.; Bertarello, A.; Paepe, D. C.-D.; Lalli, D.; Krejčíková, M.; Doyen, C.; Öster, C.; Knott, B.; Wegner, S.; Engelke, F.; Felli, I. C.; Pierattelli, R.; Dixon, N. E.; Emsley, L.; Herrmann, T.; Pintacuda, G., J. Biomol. NMR 2015, 62, 253-261.
(29) Takeuchi, K.; Arthanari, H.; Shimada, I.; Wagner, G., J. Biomol. NMR 2015, 63, 323-331.
(30) Rienstra, C. M.; Tucker-Kellogg, L.; Jaroniec, C. P.; Hohwy, M.; Reif, B.; McMahon, M. T.; Tidor, B.; Lozano-Pérez, T.; Griffin, R. G., Proc. Nat'l Acad. Sci. 2002, 99, 10260-10265.
(31) Frericks Schmidt, H. L.; Sperling, L. J.; Gao, Y. G.; Wylie, B. J.; Boettcher, J. M.; Wilson, S. R.; Rienstra, C. M., J Phys. Chem. B 2007, 111, 14362-14369. (32) Sachse, C.; Fändrich, M.; Grigorieff, N., Proc. Nat'l Acad. Sci 2008, 105, 7462-7466.
(33) Ahmed, M.; Davis, J.; Aucoin, D.; Sato, T.; Ahuja, S.; Aimoto, S.; Elliott, J. I.; Van Nostrand, W. E.; Smith, S. O., Nature Struc. Mole. Bio2010, 17, 561-567. (34) Bertini, I.; Gonnelli, L.; Luchinat, C.; Mao, J.; Nesi, A., J. Am. Chem. Soc. 2011, 133, 16013-16022.
(35) Fändrich, M.; Schmidt, M.; Grigorieff, N., Trends in Biochem. Sci. 2011, 36, 338-345.
(36) Lopez del Amo, J.-M.; Schneider, D.; Loquet, A.; Lange, A.; Reif, B., J. Biomol. NMR 2013, 56, 359-363.
(37) Lu, J.-X.; Qiang, W.; Yau, W.-M.; Schwieters, Charles D.; Meredith, Stephen C.; Tycko, R., Cell 2013, 154, 1257-1268.
(38) Colvin, M. T.; Silvers, R.; Frohm, B.; Su, Y.; Linse, S.; Griffin, R. G., J. Am. Chem. Soc. 2015, 137, 7509-7518.
(39) Schmidt, M.; Rohou, A.; Lasker, K.; Yadav, J. K.; Schiene-Fischer, C.; Fändrich, M.; Grigorieff, N., Proc. Nat'l. Acad. Sci. 2015, 112, 11858-11863. (40) Schütz, A. K.; Vagt, T.; Huber, M.; Ovchinnikova, O. Y.; Cadalbert, R.; Wall, J.; Güntert, P.; Böckmann, A.; Glockshuber, R.; Meier, B. H., Angewandte Chemie International Edition 2015, 54, 331-335.
(41) Xiao, Y.; Ma, B.; McElheny, D.; Parthasarathy, S.; Long, F.; Hoshi, M.; Nussinov, R.; Ishii, Y., Nature Structural & Molecular Biology 2015, 22, 499-505. (42) Colvin, M. T.; Silvers, R.; Ni, Q. Z.; Can, T. V.; Sergeyev, I.; Rosay, M.; Donovan, K. J.; Michael, B.; Wall, J.; Linse, S.; Griffin, R. G., J. Am. Chem. Soc. 2016, 138, 9663-9674
(43) Elkins, M. R.; Wang, T.; Nick, M.; Jo, H.; Lemmin, T.; Prusiner, S. B.; DeGrado, W. F.; Stöhr, J.; Hong, M., J. Am. Chem. Soc. 2016, 138, 9840-9852. (44) Ravotti, F.; Wälti, M. A.; Güntert, P.; Riek, R.; Böckmann, A.; Meier, B. H., Biomolecular NMR Assignments 2016, 10, 269-276.
(45) Wälti, M. A.; Ravotti, F.; Arai, H.; Glabe, C. G.; Wall, J. S.; Böckmann, A.; Güntert, P.; Meier, B. H.; Riek, R., Proc. Nat'l Acad. Sci. 2016, 113, E4976-E4984.
(46) Qiang, W.; Yau, W.-M.; Lu, J.-X.; Collinge, J.; Tycko, R., Nature 2017, 541, 217-221.
(47) Jaroniec, C. P.; Filip, C.; Griffin, R. G., J. Am. Chem. Soc. 2002, 124, 10728-10742.
(48) Hediger, S.; Meier, B. H.; Kurur, N. D.; Bodenhausen, G.; Ernst, R. R., Chem Phys Lett 1994, 223, 283-288.
(49) Wu, C. H.; De Angelis, A. A.; Opella, S. J., J. Magn. Reson2014, 246, 1-3. (50) Lewandowski, J. R.; De Paëpe, G.; Eddy, M. T.; Struppe, J.; Maas, W.; Griffin, R. G., J. Phys. Chem. B 2009, 113, 9062-9069.
(51) Bennett, A. E.; Rienstra, C. M.; Auger, M.; Lakshmi, K. V.; Griffin, R. G., J. Chem. Phys. 1995, 103, 6951-6958.
(52) Goddard, T. D.; Kneller, D. G., SPARKY 3.115, University of California, San Francisco. 2008.