Calcium-dependent molecular fMRI using a magnetic nanosensor
The MIT Faculty has made this article openly available.
Please share
how this access benefits you. Your story matters.
Citation
Okada, Satoshi et al. “Calcium-Dependent Molecular fMRI Using a
Magnetic Nanosensor.” Nature Nanotechnology 13, 6 (April 2018):
473–477 © 2018 The Author(s)
As Published
http://dx.doi.org/10.1038/s41565-018-0092-4
Publisher
Nature Publishing Group
Version
Author's final manuscript
Citable link
http://hdl.handle.net/1721.1/118936
Terms of Use
Article is made available in accordance with the publisher's
policy and may be subject to US copyright law. Please refer to the
publisher's site for terms of use.
Calcium-dependent molecular fMRI using a magnetic
nanosensor
Satoshi Okada1,†, Benjamin B. Bartelle1,†, Nan Li1, Vincent Breton-Provencher2,3, Jiyoung Lee1, Elisenda Rodriguez1, James Melican1, Mriganka Sur2,3, and Alan Jasanoff1,2,4,*
1Department of Biological Engineering, Massachusetts Institute of Technology, 77 Massachusetts Ave., Rm. 16-561, Cambridge, MA 02139
2Department of Brain & Cognitive Sciences, Massachusetts Institute of Technology, 77 Massachusetts Ave., Rm. 16-561, Cambridge, MA 02139
3Department of Picower Institute for Learning and Memory, Massachusetts Institute of Technology, 77 Massachusetts Ave., Rm. 16-561, Cambridge, MA 02139
4Department of Nuclear Science & Engineering, Massachusetts Institute of Technology, 77 Massachusetts Ave., Rm. 16-561, Cambridge, MA 02139
Abstract
Calcium ions are ubiquitous signaling molecules in all multicellular organisms, where they mediate diverse aspects of intracellular and extracellular communication over widely varying temporal and spatial scales1. Although techniques for mapping calcium-related activity at high resolution by optical means are well established, there is currently no reliable method to measure calcium dynamics over large volumes in intact tissue2. Here we address this need by introducing a family of magnetic calcium-responsive nanoparticles (MaCaReNas) that can be detected by magnetic resonance imaging (MRI). MaCaReNas respond within seconds to [Ca2+] changes in the 0.1-1.0 mM range, suitable for monitoring extracellular calcium signaling processes in the brain. We show that the probes permit repeated detection of brain activation in response to diverse stimuli in vivo. MaCaReNas thus provide a tool for calcium activity mapping in deep tissue and offer a precedent for development of further nanoparticle-based sensors for dynamic molecular imaging with MRI.
Users may view, print, copy, and download text and data-mine the content in such documents, for the purposes of academic research, subject always to the full Conditions of use: http://www.nature.com/authors/editorial_policies/license.html#termsReprints and permissions information is available online at www.nature.com/reprints
*Address correspondence to AJ, phone: 617-452-2538, fax: 617-324-1985, [email protected].
†equal contribution
AUTHOR CONTRIBUTIONS
SO, JL, BBB, and ER performed in vitro experiments. BBB and JM performed ex vivo experiments. BBB, NL, and SO performed in vivo MRI. BBB, NL, and VBP performed electrophysiology with supervision and advice from MS. SO, BBB, and AJ designed the research and wrote the paper.
ADDITIONAL INFORMATION
Supplementary information is available in the online version of this paper.
HHS Public Access
Author manuscript
Nat Nanotechnol
. Author manuscript; available in PMC 2018 October 30. Published in final edited form as:Nat Nanotechnol. 2018 June ; 13(6): 473–477. doi:10.1038/s41565-018-0092-4.
A
uthor Man
uscr
ipt
A
uthor Man
uscr
ipt
A
uthor Man
uscr
ipt
A
uthor Man
uscr
ipt
In the brain, variations in extracellular calcium ion concentrations ([Ca2+]o) are associated
with synaptic activity, in which voltage-triggered influx of extracellular Ca2+ is involved in electrical and chemical signaling3,4. Consequent reduction of [Ca2+]o from resting levels
near 1 mM in turn tends to depress synaptic activity via the extracellular calcium-sensing receptor5,6 or through direct interactions with glutamate and γ-aminobutyric acid receptor subtypes7. Regional extracellular calcium levels are anticorrelated with population-wide intracellular calcium concentrations ([Ca2+]i), though [Ca2+]o exhibits slower and more
diffuse dynamics than [Ca2+]i3,8,9. Behaviorally-relevant extracellular calcium changes can
last for tens of seconds, with activity-dependent fluctuations that push [Ca2+]o to
concentrations as low as 100 μM6; even slower variations of [Ca2+]o correlate to sleep-wake
transitions10. Abnormal Ca2+ signaling has been implicated in numerous brain disorders, such as epilepsy and Alzheimer’s disease11, but despite its significance in normal and pathological brain function, basic questions about the phenomenology and mechanisms associated with extracellular Ca2+ remain.
An imaging probe for measuring extracellular calcium in vivo could be of great value in both basic scientific and medical contexts. Of particular interest is the possibility of using such a probe to map brain activity; this could constitute a molecularly-specific analog to functional MRI (fMRI), a widely used brain imaging approach that usually detects neurophysiology indirectly, via changes in blood flow2. Fluorescent Ca2+ sensors can be used to measure [Ca2+]o levels, but most existing compounds have binding constants too
high for optimal sensing in the 0.1-1.0 mM range; like other optical probes, they are also unsuitable for typical applications in deep tissue. MRI-detectable calcium probes, including calcium-responsive nanoparticle sensors tuned to other [Ca2+] ranges, have been developed for noninvasive applications12–14, but none has yet been shown to reveal calcium dynamics in vivo. One of the challenges in constructing a calcium sensor suitable for monitoring [Ca2+]o is the need for a sensor mechanism that transduces relatively modest analyte
fluctuations into discernable image signal changes. Such sensitivity is particularly hard to achieve using small molecule sensors, which usually exhibit binding isotherms that span two orders of magnitude in [Ca2+]15. For this reason, we sought to improve on previous
approaches by exploiting the highly cooperative sensing mechanism afforded by reversible magnetic nanoparticle clustering, which can produce large changes in T2-weighted MRI
signals over relatively narrow ionic concentration ranges2.
To achieve appropriate sensitivity, a new MaCaReNa probe was engineered using synaptotagmin proteins, which are components of synaptic neurotransmitter release machinery that naturally respond to 0.1-1.0 mM changes in [Ca2+]1 and that have not previously been applied for MRI calcium sensing. Each synaptotagmin monomer contains two ~15 kDa calcium-binding C2 domains. Calcium binding to these domains promotes further complex formation with the anionic lipid phosphatidylserine (PS), a component of the plasma membrane inner leaflet. This interaction can drive clustering of PS-containing lipid vesicles at Ca2+ concentrations above ~0.2 mM16, suitable for monitoring [Ca2+]o.
MaCaReNa sensors based on this effect were prepared by mixing the fused C2 domains of synaptotagmin 1 (C2AB) with lipid-coated iron oxide nanoparticles (LCIOs) (Figure 1a). The C2AB moieties were expressed and purified from bacteria17 and the nanoparticles were
A
uthor Man
uscr
ipt
A
uthor Man
uscr
ipt
A
uthor Man
uscr
ipt
A
uthor Man
uscr
ipt
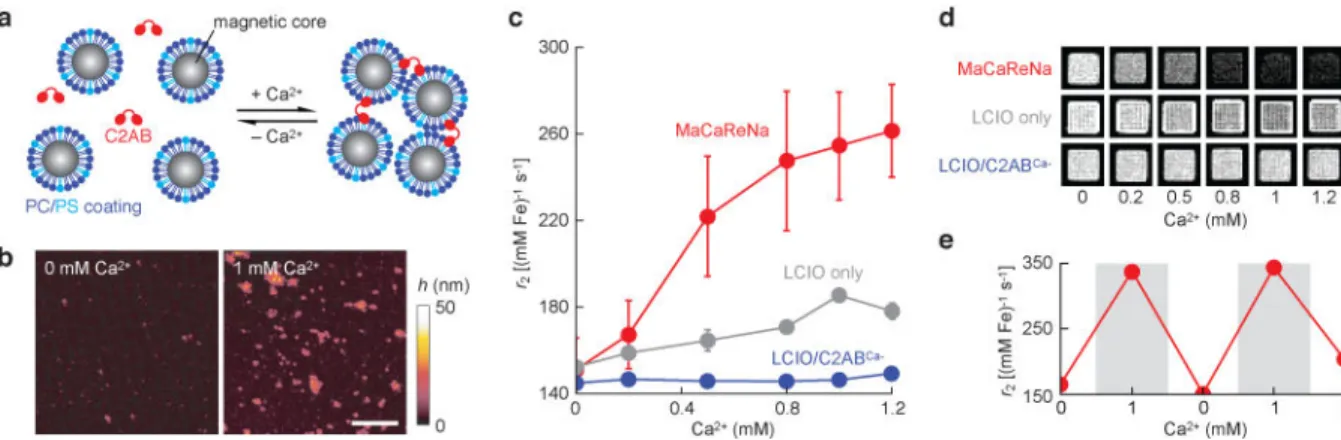
prepared by coating oleate-stabilized magnetic iron oxide cores with a 7:3 mixture of phosphatidylcholine (PC) and PS (see Methods). Initial tests were performed with combinations containing 1 nM nanoparticles (100 μM Fe) and 2.5 μM C2AB. Ca2+ -dependent aggregation of the sensor components was measured by dynamic light scattering (DLS) in artificial cerebrospinal fluid (aCSF) with or without 1 mM Ca2+. Observed hydrodynamic diameters were 35 ± 1 and 262 ± 14 nm, respectively, in low vs. high calcium conditions. Mg2+ concentration changes produced no discernable effects in DLS,
demonstrating specificity of Ca2+ dependence (Supplementary Figure S1). Atomic force microscopy (AFM) images further confirmed nanoparticle aggregation in the presence of Ca2+ (Figure 1b).
MaCaReNa responses were readily detectable by MRI, with a calcium-dependent increase in the strength of the contrast agent (transverse relaxivity, r2) from 151 ± 15 mM−1 s−1 at 0 mM
Ca2+ to 261 ± 21 mM−1 s−1at 1.2 mM Ca2+ (Figure 1c). This increase in r2 is consistent with
expected consequences of aggregation for magnetic nanoparticles with diameter below ~30 nm18. Half-maximal r2 changes were observed at 0.43 mM Ca2+. Calcium-dependent r2
changes could not be observed samples containing LCIOs without C2AB, or LCIOs mixed with a C2AB variant (C2ABCa−) engineered to lack calcium binding affinity (Supplementary Table 1 and Figure S2). These controls demonstrate specificity of calcium detection by the MaCaReNa mechanism. Raw images of samples containing MaCaReNas or control mixtures show corresponding T2-weighted MRI signal changes in each case (Figure 1d).
Importantly, calcium-dependent r2 changes could be reversed by subsequent addition of
excess ethylenediaminetetraacetic acid (EDTA), and restored again by further addition of excess CaCl2 (Figure 1e).
Response kinetics of the MaCaReNa probes are important for dynamic calcium sensing. To measure sensor response times, we performed DLS experiments in which calcium
concentrations were rapidly increased or decreased by addition of Ca2+ or a chelator, respectively, to MaCaReNa samples again containing 1 nM LCIOs and 2.5 μM C2AB (Supplementary Figure S3a). Results indicated substantial changes in light scattering reflecting clustering and unclustering of the sensors within the experimental dead time of ~20 s. Kinetic measurements of the LCIO-C2AB interaction on a faster time scale were obtained by measuring biolayer interferometry (BLI) changes following rapid immersion of a surface conjugated to C2AB into a solution containing LCIO particles (Supplementary Figure S3b). Observed time intervals for half maximal binding or dissociation of the particles were 4.9 ± 1.0 s and 4.1 ± 0.4 s, respectively. These results indicate that MaCaReNas formed from C2AB and LCIOs can achieve response rates suitable for calcium-dependent molecular-level functional MRI (molecular fMRI) on the time scale of seconds2.
To ascertain whether aggregated versus disaggregated probe states could be distinguished by MRI in living tissue, we intracranially injected rats over one hour with a total of 7.2 μL of 1 nM LCIOs in the presence or absence of 2.5 μM C2AB. To prevent agglomeration of particles before or during brain infusion, sensors and control samples were formulated in calcium-free artificial cerebrospinal fluid (aCSF) containing 5 mM ethylene glycol-bis(2-aminoethylether)-N,N,N′,N′-tetraacetic acid (EGTA). Volumetric analysis of T2-weighted
A
uthor Man
uscr
ipt
A
uthor Man
uscr
ipt
A
uthor Man
uscr
ipt
A
uthor Man
uscr
ipt
MRI scans showed detectable contrast effects over regions of 80 ± 60 μL3 (Supplementary Figure S4), demonstrating that distribution of MaCaReNas over sizeable measurement volumes in vivo is feasible. The region of contrast created by nanoparticle injection arose from convective spreading under the injection conditions we employed; because of parenchymal geometric constraints19 and the relatively slow predicted diffusion of both MaCaReNa components20, passive transport is unlikely to contribute significantly to probe distribution or to separation of LCIO and C2AB species from one another. T2-weighted MRI
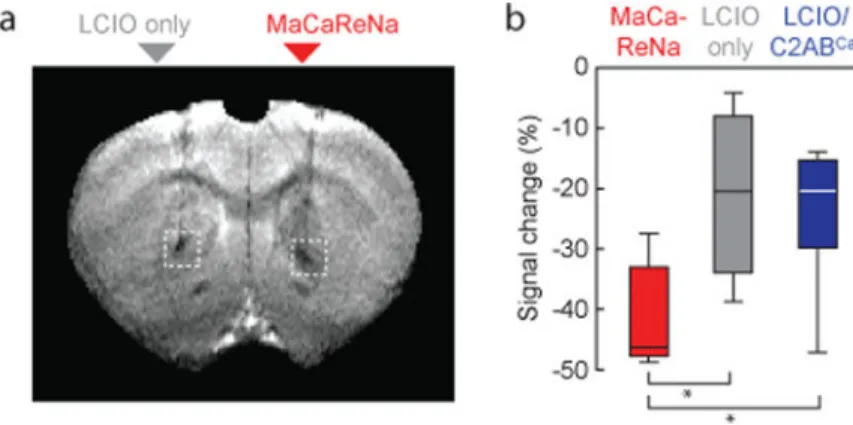
signal in areas infused with MaCaReNas was considerably lower than in areas infused with LCIO only (Figure 2a). A mean MRI signal decrease with respect to background of 42 ± 4% was observed in brain areas infused with MaCaReNas; this was significantly greater (t-test p ≤ 0.023, n ≥ 4) than signal changes observed in areas injected with LCIOs only (21 ± 8%) or with LCIOs mixed with C2ABCa− (24 ± 6%) (Figure 2b). These results suggest functionality of the MaCaReNa calcium-responsive mechanism in the living tissue.
To assess the ability of MaCaReNas to report dynamic changes in [Ca2+]o evoked by neural
activity, probes were injected intracranially into the rat striatum, followed by chemical neurostimulation using 0.6 μL pulses of 100 mM KCl in aCSF. A similar K+ infusion paradigm has been used previously to induce neural activity changes with a radius of over 1.5 mm21. In our experiments, K+ stimulation produced notable signal increases exclusively within areas infused with MaCaReNas (Figure 3a), consistent with the expected suppression of [Ca2+]o by stimulation and consequent decrease in r2 due to disaggregation of the calcium
sensors. Stimulus-dependent signal changes were reversible and could be repeated over multiple cycles of K+ stimulation and recovery with no apparent decrease in response amplitudes over the repeated treatments (Figure 3b,c). Observed rise times and decay times on the order of minutes likely reflect a mixture of K+ infusion dynamics, neural activity time courses, and sensor response characteristics. Corresponding K+-induced MRI changes could not be observed in the presence of control sensors formulated with C2ABCa− or lacking C2AB entirely (Figure 3b). Similarly, signal changes were not observed following mock stimulation by infusion of aCSF supplemented by 100 mM NaCl in place of KCl (Figure 3a,b). Brain stimulation with 0.6 μL pulses of the excitatory neurotransmitter glutamate22 (1 mM) also produced clear and repeatable signal increases in the presence of MaCaReNa sensors that could not be observed with C2ABCa− control probes (Figure 3d and Supplementary Figure S5). Neither K+ nor glutamate-dependent responses could be explained by direct effects of these stimulants on the MaCaReNas themselves (Supplementary Figure S6). These measurements therefore indicate the ability of MaCaReNas to report neural activity-dependent [Ca2+]o fluctuations in the absence of
artifacts from endogenous blood flow or other confounding factors.
Molecular fMRI signal changes induced by K+ stimulation in the presence of MaCaReNas (18 ± 5%) were significantly greater than signal changes induced by Na+ infusion in the presence of MaCaReNas (t-test p = 0.027, n = 4) or K+ stimulation in the presence of control sensors formulated with C2ABCa− (t-test p = 0.0099, n = 4) (Figure 3e). Glutamate-induced signal changes (10 ± 1%) were also significantly greater in the presence of MaCaReNas than in the presence of LCIO/C2ABCa− mixtures (t-test p = 0.0008, n = 4) (Figure 3e). Varying effects of K+ and glutamate stimulation were also reflected by differences in the slopes of the onset of signal changes observed during and after stimulation (Figure 3f). Potassium
A
uthor Man
uscr
ipt
A
uthor Man
uscr
ipt
A
uthor Man
uscr
ipt
A
uthor Man
uscr
ipt
stimulation evoked a sharper rise in MRI signal, consistent with the greater magnitude of its effect, but its decline to baseline was also faster as a percentage of its rise time (−30 ± 4% min−1 for K+ vs. −2 ± 4% min−1 for glutamate), consistent with the possibility that glutamate-induced [Ca2+]o depression might persist longer in the brain.
To probe the ability of MaCaReNas to detect more physiological neuronal activation on a faster time scale, we applied the probes in conjunction with medial forebrain bundle (MFB) electrical stimulation23, a neural activation paradigm used commonly in addiction research (Figure 4a). Stimulation parameters chosen for the experiments were within range of previous studies24,25, and suitable for evoking robust self-stimulation behavior in a standard operant paradigm (Supplementary Figure S7), demonstrating their relevance to naturalistic behavior and its underlying neurophysiology. To measure calcium responses to the stimulation, MaCaReNas were infused into dorsal striatum and then imaged using a block design paradigm26 in conjunction with T2-weighted spin echo echo planar imaging
performed with a frame rate of 0.25 Hz, which is characteristic also of conventional hemodynamic fMRI. Image contrast changes were observed only when functional MaCaReNas were infused ipsilaterally to the stimulated MFB, and not under control conditions with contralateral stimulation or calcium-insensitive LCIOs (Figure 4b–d). The magnitude of the average observed response was 13 ± 2%, comparable to the chemical stimulation paradigms of Figure 3, but here the response was evoked within seconds and peaked near the stimulus offset time (Figure 4c). This onset profile is similar to that reported previously using a closely-related stimulation paradigm in conjunction with a dopamine-sensitive MRI contrast agent24, reflecting the possibility that activation of MFB dopamine fibers contributes substantially to the observed calcium response.
Unlike dopamine time courses, which return to baseline shortly after MFB stimulation, the calcium-dependent signal remained elevated above baseline for several minutes before decreasing again, suggesting that [Ca2+]o stays suppressed over this time. To determine
whether this prolonged effect is truly indicative of underlying cellular activity, we recorded single unit activity from dorsal striatum during the same stimulus paradigm used for the molecular fMRI experiments. Measurements revealed that many striatal neurons experienced firing rate changes that persisted for about 2-3 mins following the MFB stimulus, paralleling the MRI results (Figure 4e). While subsets of the neuronal population showed increases or decreases in activity, the overall population showed a 26% increase in mean firing rate, which was highly significant with t-test p < 0.0001 (Figure 4f). Comparisons between pre- and post-stimulus average spike rates were highly significant in all three groups, with t-test p < 0.0001. The trends in neural spike rates we observed were qualitatively comparable to previously published recordings that demonstrated protracted changes in neuronal firing in multiple brain regions following MFB stimulation27,28. These results thus suggest that the time course of MaCaReNa responses primarily reflects the natural dynamics of neural activity elicited by MFB stimulation, perhaps arising in part from postsynaptic striatal dopamine receptor activation, rather than kinetic characteristics of the sensors themselves. Our findings thus demonstrate a molecular imaging paradigm suitable for monitoring [Ca2+]o dynamics in the interstitial space of the brain over biologically-relevant intervals
ranging from seconds to hours4,10. In doing so, the work extends an emerging set of methods
A
uthor Man
uscr
ipt
A
uthor Man
uscr
ipt
A
uthor Man
uscr
ipt
A
uthor Man
uscr
ipt
available for molecular fMRI2. In addition, the results establish that magnetic nanoparticle aggregation-based MRI sensors can function reversibly in complex biological tissue, a principle that can apply to mechanistically-related probes29. Although biological side-effects of MaCaReNas were not explicitly ruled out, the probe doses used here were too low to substantially perturb [Ca2+]o homeostasis through buffering (Ca2+ binding capacity of
injected sensors was < 10 μM), and previous studies have found that coated nanoparticles in the applied concentration range exhibit little toxicity30.
Future applications of MaCaReNa imaging could include characterization of extracellular calcium signaling in animal models, mechanisms that govern [Ca2+]o fluctuations, and
relationships of extracellular calcium to diverse biological phenomena in the brain and other organs. Future work should also address current challenges of the method, such as a need for faster measurements and more rigorous quantification of [Ca2+]o. Building on the initial
results presented here, MaCaReNas could be further optimized for neuroimaging
applications by tuning their Ca2+ affinities more precisely to concentrations in the 0.8-1.2 mM range and by reducing the particle size to promote faster response kinetics and improved probe distribution. Minimally invasive or fully non-invasive probe delivery methods, such as those employing ultrasound-assisted or receptor-mediated trans-blood-brain barrier transport, will also be important for applications that take full advantage of the whole-brain imaging capabilities of MRI.
METHODS
AnimalsAll animal experiments were performed following approval of the MIT Committee on Animal Care, and in accordance with Institutional and NIH guidelines. A total of 26 rats were used for data presented in this paper. All animals were male Sprague-Dawley rats, 8-10 weeks of age; they were purchased from Charles River Laboratories. Animals were housed and maintained on a 12 hr light/dark cycle with ad libitum access to food and water. Sample sizes for all animal experiments were chosen such that between-group comparisons provided a power of 0.8 when detecting 10% signal differences between groups using two-tailed t-tests with α = 0.05, assuming within-group standard deviations of approximately 5%.
Atomic force microscopy
30 μL of a sample solution was deposited onto a V-1 quality muscovite mica disc (Electron Microscopy Sciences) freshly cleaved using adhesive tape. The mica was incubated in a Petri dish for 30 min, rinsed with 1 mL of deionized water, and then dried initially with compressed air. The mica was further dried overnight at room temperature and protected from dust contamination. The prepared sample was measured in air using a Multimode 8 atomic force microscope equipped with a SCANASYST-AIR cantilever (Bruker
Instruments) operated in soft tapping mode.
A
uthor Man
uscr
ipt
A
uthor Man
uscr
ipt
A
uthor Man
uscr
ipt
A
uthor Man
uscr
ipt
Dynamic light scattering
Dynamic light scattering was performed using a DynaPro DLS system (Wyatt Technology) with a 1 s integration time at 22 °C. The laser power was adjusted so that all the samples gave scattering light intensity the order of 105 counts s−1.
Preparation of lipid-coated iron oxide nanoparticles (LCIOs)
4.5 mg of L-α-phosphatidylcholine from hen egg (Avanti Polar Lipids) and 1.5 mg of L-α-phosphatidylserine from porcine brain (Avanti Polar Lipids) were dissolved in 250 μL of chloroform. 50 μL of 5 mg Fe/mL iron oxide nanoparticle solution (10 nm with oleic acid coating in chloroform, Ocean NanoTech) was mixed with the lipid solution and the mixture was thoroughly evaporated to obtain an even brown lipid film. 200 μL of 10 mM HEPES buffer (pH 7.4) was added into the lipid film and sonicated until the entire brown layer was homogenously dispersed into the buffer, yielding a brown transparent solution. The mixture was applied into a magnetic μ column placed into a μMACS magnetic separator (Miltenyi Biotec), and washed four times with 50 μL buffer aliquots. Purified solution was eluted by removing the column from the magnet and adding 150 μL of the buffer. The eluate was centrifuged at 6000g for 10 min to remove large aggregates and then the supernatant was filtered using a 0.1 μm syringe top filter. The final resulting concentration of LCIOs was quantified from absorbance at 450 nm using a molar absorbance coefficient ε450 = 690 (M
Fe)−1 cm−1, which in turn was determined by a colorimetric assay using bathophenanthrolinedisulfonic acid31.
Purification of C2AB
Escherichia coli (BL21) expressing 6xHis-tagged C2AB was generously provided by Dr. Jihye Lee and Prof. J. Troy Littleton (MIT). 6xHis-tagged C2AB was purified according to published procedures17, with minor modifications. Briefly, E. coli cells harboring the tagged C2AB gene were grown in 5 mL of LB medium with 50 μg/mL of ampicillin at 37 °C overnight. 100 mL of LB/ampicillin medium was inoculated with 1 mL of the overnight culture and grown to OD600 = 0.6 for 2–3 h at 37 °C. Protein expression was induced by
adding 1 mL of 1 M isopropyl-β-D-1-thiogalactopyranoside (IPTG) during vigorous shaking. 4 hours after adding IPTG, cells were harvested by centrifugation at 6000g for 20 min at 4 °C. The obtained cell pellet (~ 1 g) was stored at −80 °C overnight and
subsequently lysed by addition of 5 mL of BugBuster reagent (EMD Millipore), 10 μL of Lysonase Bioprocessing Reagent (EMD Millipore), and 50 μL of P8849 protease inhibitor cocktail (Sigma-Aldrich). The cell lysate was vortexed quickly and nutated gently for 15 min at room temperature. The mixture was then centrifuged at 12000g for 20 min at 4 °C to pellet insoluble material. Collected supernatant was added to a column partially filled with 1 mL of Ni-NTA Superflow Resin (Qiagen) and previously pre-equilibrated with binding buffer (50 mM NaH2PO4, 300 mM NaCl, 10 mM imidazole, pH 8.0). The loaded column
was nutated for 1 h at 4 °C to promote protein binding. The resin was washed four times using 5 mL of wash buffer (50 mM NaH2PO4, 300 mM NaCl, 20 mM imidazole, 0.1%
Tween 20, pH 8.0) and four times using 5 mL of wash buffer without Tween 20. Then protein was eluted by addition of 1 mL of elution buffer (50 mM NaH2PO4, 300 mM NaCl,
250 mM imidazole, pH 8.0). The eluate was concentrated and exchanged into experimental
A
uthor Man
uscr
ipt
A
uthor Man
uscr
ipt
A
uthor Man
uscr
ipt
A
uthor Man
uscr
ipt
buffer conditions using a 10K Amicon Ultra filter (EMD Millipore). Protein purity was assessed by sodium dodecyl sulfate polyacrylamide gel electrophoresis, and protein concentration was determined using the Pierce 660 nm Protein Assay (Thermo Fisher Scientific).
Cloning of C2ABCa−
The calcium binding sites of C2AB were determined from structural data32 and Ca2+ binding residues were mutated to alanine in silico using Serial Cloner software
(www.serialbasics.free.fr). The resulting mutant sequence was ordered as a synthetic DNA fragment (Integrated DNA Technologies). The fragment was ligated into the original C2AB plasmid using, NEBuilder assembly enzymes (New England Biolabs).
Biolayer interferometry
BLI was performed on an Octet Red biolayer interferometry instrument (Pall ForteBio). C2AB was attached to the sensor probes via adhesion to an Ni-NTA coated tip. Binding kinetics were monitored following submersion of the C2AB-bound tip in aCSF containing 1.2 mM Ca2+ and 1 nM LCIOs (100 μM Fe). Dissociation rates were measured by then transferring the tips to calcium-free aCSF after briefly washing excess LCIOs off in complete aCSF. Kinetics data was analyzed using custom written MATLAB (MathWorks) scripts.
In vitro MRI
In vitro magnetic resonance imaging (MRI) was performed with a 7 T Biospec MRI scanner (Bruker). Samples were arrayed into bisected 384-well microtiter plates and imaged using a volume tranceiver coil. A multislice multiecho (MSME) pulse sequence was used to obtain T2-weighted images, with typical parameters including matrix size = 256 × 256, field of
view (FOV) = 5 cm × 5 cm, slice thickness = 2 mm, repetition time (TR) = 2000 ms, echo spacing with echo time (TE) = 8 ms, and number of echoes = 30. T2 values were obtained by
exponential fitting to MRI intensities as a function of echo time. Relaxivity (r2) values were
defined by two-point measurements of the slopes between 1/T2 of aCSF without
nanoparticles and 1/T2 of aCSF containing 100 μM Fe nanoparticles, and are reported as the
mean and standard errors of the mean (SEM) of measurements performed in triplicate. Relaxivity titrations were performed in aCSF with varying concentrations of calcium. Measurement of the reversibility of r2 changes was performed in 10 mM HEPES, 150 mM
NaCl, pH 7.4, with addition of excesses of CaCl2 and EDTA to achieve alternation between
0 mM and 1 mM Ca2+. Use of a lower ionic strength buffer for this experiment limited effects of the accumulation of CaCl2 and EDTA throughout the procedure but resulted in
slightly greater r2 values than observed in aCSF under high calcium conditions. Ex vivo MRI and analysis of nanoparticle infusion
To measure brain volumes affected by infusion of nanoparticle mixtures, animals were injected with 200/10 mg/kg ketamine/xylazine after MRI experiments and cardiac perfused with cold phosphate buffered saline with 10 units/mL heparin followed by 4%
paraformaldehyde. Animals were then prepared for high resolution postmortem imaging
A
uthor Man
uscr
ipt
A
uthor Man
uscr
ipt
A
uthor Man
uscr
ipt
A
uthor Man
uscr
ipt
according to published procedures33. Animals were decapitated and tissue was stripped from skull before incubating in 1 mM gadolinium diethylenetriaminepentaacetic acid for 96 h at 4 °C. The resulting fixed, contrast enhanced samples were then scanned with 100 μm isotropic resolution using a gradient echo pulse sequence implemented with TR/TE = 250/35 ms on the 7 T scanner. Rat brains were manually segmented for analysis and areas of hypointensity were further segmented from the 3D datasets by placing a seed value at the center of the injection area and thresholding at ±10% of the seed signal intensity. All 3D analysis was done using the segmentation editor in FIJI (http://fiji.sc/).
Cannula implantation and brain infusion of nanoparticle mixtures
Nanoparticle mixtures formulated for brain infusion included 1 nM LCIOs (100 μM Fe) alone or mixed with 2.5 μM C2AB protein (for MaCaReNas), 2.5 μM C2ABCa− (for control LCIO/C2ABCa− mixtures). All of these mixtures were formulated in calcium-free aCSF (125 mM NaCl, 2.5 mM KCl, 1 mM MgCl2, 1.25 mM NaH2PO4, 25 mM NaHCO3),
supplemented with 5 mM EGTA. Prior to infusion of these solutions, animals were anesthetized with ~2% isoflurane, shaved, and mounted in a rodent stereotaxic device (David Kopf Instruments); heart rates and blood oxygenation were monitored by a pulse oximeter (Nonin Medical). Each animal’s scalp was retracted and 28G holes were drilled into the skull above desired injection sites. 28G cannula guides that projected 2 mm below the surface of the skull (Plastics One) were implanted using SEcure light curing dental cement (Parkell, Inc.) and 33G metal injection cannulae that projected 5 mm below the skull were lowered to the appropriate depth through the holes. All injections were targeted to the caudate nucleus, coordinates 1 mm anterior, 3 mm lateral, and 5 mm ventral to bregma as chosen based on a standard rat brain atlas34. Nanoparticle infusions were performed using an injection rate of 0.12 μL/min for 1 h with control vs. test sides alternated for each
experiment to negate potential artifacts or bias. Metal cannulae were then removed and animals were transferred to an MRI rat imaging cradle (Bruker). Plastic cannulae for delivery of control and stimulatory agents during MRI were then lowered bilaterally through the guide cannulae to the contrast agent delivery sites, and subsequently fixed in place with ETC light curing dental cement (Parkell).
Calcium-dependent molecular fMRI with chemical brain stimulation
In vivo MRI measurements were obtained using a 9.4 T Biospec MRI scanner (Bruker) operating with a cross coil volume transmit, surface receive configuration. Rapid acquisition with refocused echoes (RARE) pulse sequences were used to acquire T2-weighted
anatomical and functional images. Imaging parameters for anatomical images included number of averages = 6, matrix size = 300 × 200, FOV = 3 cm × 2 cm, slice thickness = 1.2 mm, TR = 5000 ms, effective TE = 60 ms, RARE factor = 8. Imaging parameters for functional imaging scan series were matrix size = 75 × 50, FOV = 3 cm × 2 cm, slice thickness = 1.2 mm, TR = 3000 ms, effective TE = 90, RARE factor = 8. Acquisition time per image frame was 12 s. Chemical stimuli delivered during molecular fMRI experiments consisted of pulsed injections of complete aCSF supplemented by 100 mM KCl, 100 mM NaCl (control), or 1 mM glutamate, and delivered at a rate of 0.12 μL/min during continuous image acquisition. Each experiment consisted of a two minute pre-stimulation period,
A
uthor Man
uscr
ipt
A
uthor Man
uscr
ipt
A
uthor Man
uscr
ipt
A
uthor Man
uscr
ipt
followed by 5 min of stimulation and 10 min of rest. Three stimulations were performed for each animal.
Calcium-dependent molecular fMRI with electrical brain stimulation
Rats were purchased with pre-implanted jugular catheters (Charles River). After
acclimation, unipolar electrodes were implanted bilaterally into the MFB. Guide cannulae for striatal sensor infusion were implanted as described above, and headposts to fix their heads in place during imaging were attached above the sagittal suture using dental cement. The rats were allowed 3-7 days for recovery then anesthetized and infused with MaCaReNa sensor doses as per previous methods. Animals were then intubated via a tracheotomy, transferred to lighter chemical anesthesia with medetomidine (1 mg/kg IP), and paralyzed with pancuronium (2 mg/kg IP) to prevent motion artifacts during stimulation. Upon paralysis, animals were transferred to a small animal respirator (Inspira; Harvard Apparatus), and fixed via their headposts into a custom built cradle for imaging. Once positioned in the magnet, medetomidine (1 mg/kg/h) and pancuronium (2 mg/kg/h) were delivered continuously via an IP catheter, along with Nω-nitro-L-arginine methyl ester (L-NAME, 100 mg/kg/h IV) to suppress the hemodynamic signals. After 45 min of acclimation to these conditions, functional imaging was performed using T2 weighted spin echo echo
planar imaging (TE = 60 ms, TR = 4 s). During each animal’s scan session, stimulation was applied in five epochs consisting of two minutes baseline, 24 s MFB stimulation (0.3 mA, 200 Hz, 1 ms pulses, 75% duty cycle consisting of 3 s trains separated by 1 s between trains) and then five minutes of recovery before the next epoch.
Electrophysiology with electrical brain stimulation
Animals were prepared similarly to MRI studies. Immediately after implantation of the stimulation electrodes, animals were paralyzed, and anesthesia was switched to medetomidine. Using a micromanipulator (MP-285; Sutter Instrument Company), a 16 channel laminar probe (A1x16-10mm-100-177-A16; Neuronexus Technologies) was lowered into the dorsal striatum (~5 mm) through a previously drilled craniotomy (0.2 mm anterior and 3.0 mm lateral to bregma). Extracellular signals recorded via the electrodes were amplified using a 1x gain headstage (model E2a; Plexon Inc.) connected to a 50x preamp (PBX-247; Plexon) and digitalized at 50 kHz. A 250 Hz high-pass filtered was applied on the raw signal and single units were sorted using the Offline Sorter software (Plexon) based on their principal components, peak-valley, and non-linear energy ratio prior to sorting units. Time stamps of the sorted units were exported to MATLAB and post-stimulus time histograms and further statistics were computed using custom procedures. The sample size of neurons were chosen such that between-group comparisons provided a power of 0.95 and significance defined by two-tailed t-tests with α = 0.05.
Behavioral assessment of intracranial self-stimulation
Behavior experiments were performed in a plexiglass operant chamber (28 × 21 × 21 cm; Lafayette Instruments). One infrared nose poke sensor was positioned at one end of the operant chamber. Input from the nose poke sensor was recorded via a digital input/output interface (National Instruments). Such input triggered MFB stimulation in 3 s trains of 200 Hz, 0.3 mA, 1 ms electrical pulses, identical to the stimuli used in the fMRI experiments.
A
uthor Man
uscr
ipt
A
uthor Man
uscr
ipt
A
uthor Man
uscr
ipt
A
uthor Man
uscr
ipt
Two animals were shaped to the task and then tested over ten 60 s trials each, with an inter-trial interval of 10 s. Input and output events for every inter-trial were recorded and analyzed by custom-written computer scripts implemented in C and MATLAB to generate data presented in Supplementary Figure S7.
MRI data analysis
Images were reconstructed using Paravision software (Bruker) and further analyzed using custom routines implemented in MATLAB. For quantitative analysis of signal changes induced by injection of MaCaReNas, LCIOs, or LCIO/C2ABCa− mixtures (Figure 2), regions of interest (ROIs) were determined by manually selecting the centroids of apparent nanoparticle-induced hypointensity from MRI images. Signal change values were
determined by averaging observed intensities within a 3 × 3 pixel (1.2 × 1.2 mm) square around these centroids. In each case, the percent signal change (%SC) was determined as the difference between mean MRI intensity in each injection site ROI (Sinj) and the mean
intensity in a reference ROI positioned medial to the infusion zones (Sref), such that %SC =
100 • (Sinj − Sref)/Sref. Reported values are averaged over animals, with corresponding SEM.
Quantitative analysis of chemical stimulus-induced molecular fMRI signal changes (Figure 3) was performed on data converted on a per-voxel basis to percent signal change from baseline, according to the following relationship: %SC = 100 • [S(t) − Sbase]/Sbase, where
S(t) is the signal at any arbitrary time point and Sbase is the mean signal observed during the
two minute pre-stimulation period. Signal time courses for each animal were determined by manually selecting a brain hemisphere and then using an operator-blind algorithm to identify the centroids of apparent nanoparticle-induced hypointensity from MRI images. This ROI was defined around the pixel of peak signal change averaged over two minutes centered at the endpoint of injection, and averaging %SC values around this pixel over a 1.2 × 1.2 mm square ROI. These time courses were temporally smoothed over a moving window of 1 min, baseline corrected to remove linear drift (for multiple stimulus experiments only), and each series of stimulus responses was averaged over multiple animals to obtain mean time courses and corresponding error margins (SEMs) for each experimental condition. Percent signal change amplitudes for each stimulus type were defined as follows: %SC = 100 • (Sstim −
Sbase)/Sbase, where Sbase is the MRI signal intensity observed during the 2 min pre-stimulus
baseline and Sstim is the MRI signal observed during a 2 min window around the stimulant
infusion offset time. Signal change slopes associated with response to and recovery from stimulation were determined by linear fitting to the 5 minute stimulant infusion periods and 10 min post-infusion periods, respectively. The distribution of signal change amplitudes and slope values from multiple animals are presented as box plots. Only experimental sessions that were prematurely terminated due to major technical failures were excluded from analysis.
For the MFB stimulation experiments of Figure 4, baseline measurements, conversion to %SC, and ROI selection were again performed as described above. Responses to all five stimuli presented to each animal were averaged together before ROI analysis, and ROIs were centered around the pixel of maximum response within a 20 s window centered about the endpoint of stimulation. Stimulation traces from each animal were averaged and smoothed
A
uthor Man
uscr
ipt
A
uthor Man
uscr
ipt
A
uthor Man
uscr
ipt
A
uthor Man
uscr
ipt
over a 20 s window; traces presented in Figure 4c represent the mean and SEM time courses from multiple animals. Percent signal change amplitudes presented in Figure 4d were defined as %SC = 100 • (Sstim − Sbase)/Sbase, where Sbase is the mean baseline MRI signal
intensity and Sstim is the MRI signal observed during a 60 s window beginning at the
stimulus offset time; box plots depict data from multiple animals.
Code availability statement
Scripts used for data analysis are available upon reasonable request.
Data availability statement
Expression construct sequences and raw MRI datasets generated during and/or analyzed during the current study are available from the corresponding author upon reasonable request.
Supplementary Material
Refer to Web version on PubMed Central for supplementary material.
Acknowledgments
Project funding was provided by NIH grants R01-DA038642, DP2-OD2114, BRAIN Initiative award U01-NS090451, and an MIT Simons Center for the Social Brain Seed Grant to AJ. SO was supported by RGO, a JSPS Postdoctoral Fellowship for Research Abroad, and an Uehara Memorial Foundation postdoctoral fellowship. ER was supported by a Beatriu de Pinós Fellowship from the Government of Catalonia. We thank William White for assistance with the BLI experiments, Sarah Bricault for help with data analysis, and Deborah Pheasant at the MIT Biophysical Instrumentation Facility (BIF) for training and assistance with CD and BLI measurements; BIF instruments are available thanks to NSF grant 0070319 and NIH grant S10-OD016326. We are grateful to J. Troy Littleton and Jihye Lee for supplying the C2AB expression clone.
Abbreviations
aCSF Artificial Cerebrospinal Fluid BLI Biolayer Interferometry C2ABCa− Calcium-Insensitive C2AB DLS Dynamic Light Scattering
TE Echo Time
EDTA Ethylenediaminetetraacetic Acid
EGTA Ethylene Glycol-bis(β-aminoethylether)-N,N,N′,N′-Tetraacetic Acid [Ca2+]o Extracellular Calcium Concentration
FOV Field of View
fMRI Functional Magnetic Resonance Imaging [Ca2+]i Intracellular Calcium Concentration
A
uthor Man
uscr
ipt
A
uthor Man
uscr
ipt
A
uthor Man
uscr
ipt
A
uthor Man
uscr
ipt
HEPES 4-(2-hydroxyethyl)-1-piperazineethanesulfonic Acid LCIO Lipid-Coated Iron Oxide
L-NAME Nω-nitro-L-arginine Methyl Ester
MaCaReNa Magnetic Calcium-Responsive Nanoparticle MFB Medial Forebrain Bundle
MRI Magnetic Resonance Imaging
RARE Rapid Acquisition with Refocused Echoes ROI Region of Interest
TR Repetition Time r2 Transverse Relaxivity
References
1. Südhof TC. Calcium control of neurotransmitter release. Cold Spring Harb Perspect Biol. 2012; 4:a011353. [PubMed: 22068972]
2. Bartelle BB, Barandov A, Jasanoff A. Molecular fMRI. J Neurosci. 2016; 36:4139–4148. [PubMed: 27076413]
3. Rusakov DA. Depletion of extracellular Ca2+ prompts astroglia to moderate synaptic network activity. Sci Signal. 2012; 5:pe4. [PubMed: 22275219]
4. Nicholson C, Bruggencate GT, Steinberg R, Stöckle H. Calcium modulation in brain extracellular microenvironment demonstrated with ion-selective micropipette. Proc Natl Acad Sci USA. 1977; 74:1287–1290. [PubMed: 265573]
5. Smith SM, et al. Calcium regulation of spontaneous and asynchronous neurotransmitter release. Cell Calcium. 2012; 52:226–233. [PubMed: 22748761]
6. Jones BL, Smith SM. Calcium-sensing receptor: A key target for extracellular calcium signaling in neurons. Front Physiol. 2016; 7:116. [PubMed: 27065884]
7. Urwyler S. Allosteric modulation of family C G-Protein-coupled receptors: From molecular insights to therapeutic perspectives. Pharmacol Rev. 2011; 63:59–126. [PubMed: 21228259]
8. Egelman DM, Montague PR. Calcium dynamics in the extracellular space of mammalian neural tissue. Biophys J. 1999; 76:1856–1867. [PubMed: 10096884]
9. Wiest MC, Eagleman DM, King RD, Montague PR. Dendritic spikes and their influence on extracellular calcium signaling. J Neurophysiol. 2000; 83:1329–1337. [PubMed: 10712460] 10. Ding F, et al. Changes in the composition of brain interstitial ions control the sleep-wake cycle.
Science. 2016; 352:550–555. [PubMed: 27126038]
11. Dal Prà I, et al. Calcium-sensing receptors of human astrocyte-neuron teams: Amyloid-β-driven mediators and therapeutic targets of Alzheimer’s disease. Curr Neuropharmacol. 2014; 12:353– 364. [PubMed: 25342943]
12. Li W-hFraser SE, Meade TJ. A calcium-sensitive magnetic resonance imaging contrast agent. J Am Chem Soc. 1999; 121:1413–1414.
13. Atanasijevic T, Shusteff M, Fam P, Jasanoff A. Calcium-sensitive MRI contrast agents based on superparamagnetic iron oxide nanoparticles and calmodulin. Proc Natl Acad Sci U S A. 2006; 103:14707–14712. [PubMed: 17003117]
14. Mamedov I, et al. In vivo characterization of a smart MRI agent that displays an inverse response to calcium concentration. ACS Chem Neurosci. 2010; 1:819–828. [PubMed: 22778817]
A
uthor Man
uscr
ipt
A
uthor Man
uscr
ipt
A
uthor Man
uscr
ipt
A
uthor Man
uscr
ipt
15. Johnson I, Spence MTZ. The Molecular Probes Handbook: A Guide to Fluorescent Probes and Labeling Technologies. 11th. 2010.
16. Diao J, Yoon TY, Su Z, Shin YK, Ha T. C2AB: A molecular glue for lipid vesicles with a negatively charged surface. Langmuir. 2009; 25:7177–80. [PubMed: 19563216]
17. Lee J, Guan Z, Akbergenova Y, Littleton JT. Genetic analysis of synaptotagmin C2 domain specificity in regulating spontaneous and evoked neurotransmitter release. J Neurosci. 2013; 33:187–200. [PubMed: 23283333]
18. Matsumoto Y, Jasanoff A. T2 relaxation induced by clusters of superparamagnetic nanoparticles: Monte Carlo simulations. Magn Reson Imaging. 2008; 26:994–998. [PubMed: 18479873] 19. Syková E, Nicholson C. Diffusion in brain extracellular space. Physiol Rev. 2008; 88:1277–1340.
[PubMed: 18923183]
20. Tyn MT, Gusek TW. Prediction of diffusion coefficients of proteins. Biotechnol Bioeng. 1990; 35:327–338. [PubMed: 18592527]
21. Adámek S, Vyskočil F. Potassium-selective microelectrode revealed difference in threshold potassium concentration for cortical spreading depression in female and male rat brain. Brain Res. 2011; 1370:215–219. [PubMed: 21075087]
22. Ciriello J, Janssen SA. Effect of glutamate stimulation of bed nucleus of the stria terminalis on arterial pressure and heart rate. Am J Physiol. 1993; 265:H1516–H1522. [PubMed: 7902013] 23. Olds J, Milner P. Positive reinforcement produced by electrical stimulation of septal area and other
regions of rat brain. J Comp Physiol Psychol. 1954; 47:419–427. [PubMed: 13233369] 24. Lee T, Cai LX, Lelyveld VS, Hai A, Jasanoff A. Molecular-level functional magnetic resonance
imaging of dopaminergic signaling. Science. 2014; 344:533–535. [PubMed: 24786083] 25. Fiallos AM, et al. Reward magnitude tracking by neural populations in ventral striatum.
NeuroImage. 2017; 146:1003–1015. [PubMed: 27789262]
26. Penny WD, Friston KJ, Ashburner JT, Kiebel SJ, Nichols TE. Statistical Parametric Mapping: The Analysis of Functional Brain Images. 2011
27. Keene JJ. Prolonged unit responses in thalamic reticular, ventral, and posterior nuclei following lateral hypothalamic and midbrain reticular stimulation. J Neurosci Res. 1975; 1:459–469. [PubMed: 1225999]
28. Keene JJ. Prolonged medial forebrain bundle unit responses to rewarding and aversive intracranial stimuli. Brain Res Bull. 1976; 1:517–522. [PubMed: 1088089]
29. Haun JB, Yoon TJ, Lee H, Weissleder R. Magnetic nanoparticle biosensors. Wiley Interdiscip Rev Nanomed Nanobiotechnol. 2010; 2:291–304. [PubMed: 20336708]
30. Lewinski N, Colvin V, Drezek R. Cytotoxicity of nanoparticles. Small. 2008; 4:26–49. [PubMed: 18165959]
31. Tamarit J, Irazusta V, Moreno-Cermeño A, Ros J. Colorimetric assay for the quantitation of iron in yeast. Anal Biochem. 2006; 351:149–151. [PubMed: 16403430]
32. Fuson KL, Montes M, Robert JJ, Sutton RB. Structure of human synaptotagmin 1 C2AB in the absence of Ca2+ reveals a novel domain association. Biochemistry. 2007; 46:13041–13048. [PubMed: 17956130]
33. Szulc KU, et al. MRI analysis of cerebellar and vestibular developmental phenotypes in Gbx2
conditional knockout mice. Magn Reson Med. 2013; 70:1707–1717. [PubMed: 23400959] 34. Paxinos G, Watson C. The Rat Brain in Stereotaxic Coordinates: The New Coronal Set. 2004
A
uthor Man
uscr
ipt
A
uthor Man
uscr
ipt
A
uthor Man
uscr
ipt
A
uthor Man
uscr
ipt
Figure 1. Design and in vitro characterization of MaCaReNas
(a) Schematic of the sensor design based on LCIOs and C2AB. (b) Atomic force
microscopy of MaCaReNas imaged following exposure to 0 or 1 mM Ca2+. Scale bar = 500 nm and color scale denotes sample height (h). (c) Titration curve showing transverse relaxivity (r2) values as a function of [Ca2+] in aCSF, indicating MaCaReNa (red) responsiveness to calcium concentrations characteristic of the brain extracellular space (means ± SEM, n = 3). LCIOs formulated alone (gray) or in the presence of C2ABCa−
display little responsiveness to Ca2+ (blue). (d) T2-weighted images (TR/TE = 2000/72 ms)
of MaCaReNas and control mixtures, corresponding to the titration curves in (c). (e) Relaxivity changes observed in HEPES buffer over multiple cycles of calcium (gray) or EDTA (white) addition, calibrated to alternate between 1 and 0 mM free Ca2+ as noted.
A
uthor Man
uscr
ipt
A
uthor Man
uscr
ipt
A
uthor Man
uscr
ipt
A
uthor Man
uscr
ipt
Figure 2. MaCaReNa calcium-binding activity correlates with MRI contrast in vivo
(a) Injection of MaCaReNas into rat brain (right) induces substantially greater signal decrease than injection of LCIO nanoparticles alone (left). (b) Mean signal changes following intracranial injection of MaCaReNas (n = 7), LCIOs alone (n = 4), or calcium-insensitive LCIO/C2ABCa− mixtures (n = 5) were quantified in ROIs comparable to dotted white boxes in (a). Box plots indicate median (center line), first quartiles (box edges), and second quartiles (whiskers). Differences between MaCaReNas and both control conditions were significant (p ≤ 0.023).
A
uthor Man
uscr
ipt
A
uthor Man
uscr
ipt
A
uthor Man
uscr
ipt
A
uthor Man
uscr
ipt
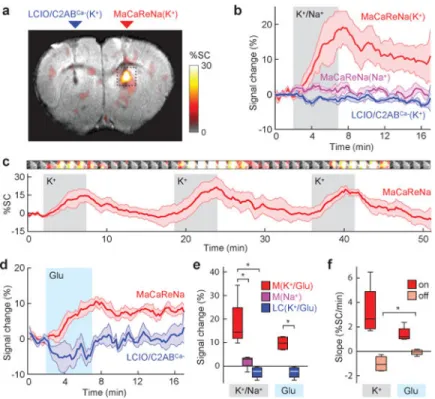
Figure 3. MaCaReNas report dynamic Ca2+ fluctuations in living rat brains
(a) K+ infusion (100 mM, 0.12 μL/min) induces molecular fMRI signal increases in the presence of MaCaReNa sensors (right) but not calcium-insensitive LCIO/C2ABCa− controls (left). Signal change amplitudes indicated by the color scale are superimposed on a
grayscale anatomical image for a representative rat (out of 4). (b) Signal change time courses near areas of contrast agent delivery show that K+ infusion (gray shading) in the presence of MaCaReNas induces clear responses (red trace), while 100 mM Na+ infusion in the presence of MaCaReNas (purple trace) and K+ infusion in the presence of LCIO/ C2ABCa− controls (blue trace) barely affects MRI signal. (c) Average time course (red trace) of three consecutive K+ stimuli (gray shading) shows reproducibility of MaCaReNa
responses (n = 4). Images above the trace correspond to dotted box in (a) and illustrate mean signal change from pre-stimulus baseline as a function of time (1.4 min average per image frame). (d) Dynamic signal changes in response to brain stimulation by glutamate infusion (1 mM, 0.12 μL/min) in the presence of MaCaReNas (red trace) and in the presence of LCIO/C2ABCa− (blue trace). (e) Average signal changes (response at stimulus offset time, minus baseline) measured under each of the stimulation conditions in (b) and (d).
MaCaReNas (M) in the presence of K+ or glutamate (Glu) were significantly different from LCIO/C2ABCa− controls (LC) and MaCaReNas in the presence of Na+ (p ≤ 0.027 and n = 4 for all groups). (f) Comparison of slopes for response onset (dark red) and recovery (light red) for K+ and glutamate stimulation. Recovery slopes were significantly less negative for glutamate stimulation, indicative of longer lasting [Ca2+]o depression (p = 0.04, n = 4). All
shading indicates SEM; box plots indicate median (center line), first quartiles (box edges), and second quartiles (whiskers).
A
uthor Man
uscr
ipt
A
uthor Man
uscr
ipt
A
uthor Man
uscr
ipt
A
uthor Man
uscr
ipt
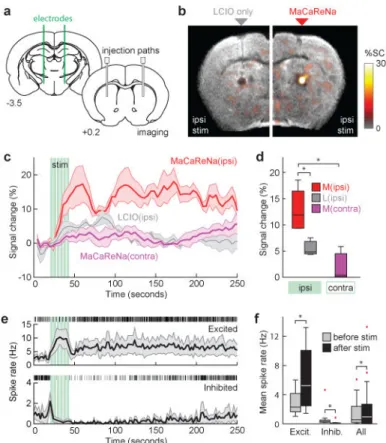
Figure 4. MaCaReNas report striatal responses to medial forebrain stimulation
(a) Schematic showing locations of bilateral MFB electrode implantation and striatal MacaReNa infusion; distance from bregma is noted below each brain section34. (b) Ipsilateral MFB stimulation induces MRI signal changes in the presence of MaCaReNas (right) but not control LCIO particles (left). Mean signal changes from four animals shown in color, superimposed over a T2-weighted scan. (c) Average response to ipsilateral (red) or contralateral (purple) MFB stimulation in the presence of MaCaReNas, and response to ipsilateral stimulation in the presence of control LCIO particles (gray). Stimulus pulse trains indicated by green vertical lines; shaded regions indicate SEM over multiple animals (n = 4 for MaCaReNas, n = 3 for controls). (d) Mean signal changes during the immediate post-stimulus interval for all conditions. MaCaReNas with ipsilateral stimulation were
significantly different from both the contralateral stimulation condition and with the LCIO control result (p < 0.05). (e) Single unit recordings in dorsal striatum using the MFB stimulus paradigm. Prolonged post-stimulus excitation (top) or depression (bottom) of subpopulations of units parallels the molecular fMRI time course. Mean spike rates shown with SEM over units (shading); representative rasters shown above each time course. (f) Mean spike rates before vs. after MFB stimulation for excited units (n = 9), inhibited units (n = 12), and all units (n = 38) recorded from two animals. All differences were significant with p < 0.0001 when comparing 30 two-second bins before vs. after stimulation. Box plots indicate median (center line), first quartiles (box edges), and second quartiles (whiskers); red tics denote outliers.