Publisher’s version / Version de l'éditeur:
Vous avez des questions? Nous pouvons vous aider. Pour communiquer directement avec un auteur, consultez la première page de la revue dans laquelle son article a été publié afin de trouver ses coordonnées. Si vous n’arrivez Questions? Contact the NRC Publications Archive team at
[email protected]. If you wish to email the authors directly, please see the first page of the publication for their contact information.
https://publications-cnrc.canada.ca/fra/droits
L’accès à ce site Web et l’utilisation de son contenu sont assujettis aux conditions présentées dans le site LISEZ CES CONDITIONS ATTENTIVEMENT AVANT D’UTILISER CE SITE WEB.
Computational Intelligence Journal, 20, 4, 2004
READ THESE TERMS AND CONDITIONS CAREFULLY BEFORE USING THIS WEBSITE. https://nrc-publications.canada.ca/eng/copyright
NRC Publications Archive Record / Notice des Archives des publications du CNRC :
https://nrc-publications.canada.ca/eng/view/object/?id=12d96b97-3533-41da-875a-35202f742420 https://publications-cnrc.canada.ca/fra/voir/objet/?id=12d96b97-3533-41da-875a-35202f742420
NRC Publications Archive
Archives des publications du CNRC
This publication could be one of several versions: author’s original, accepted manuscript or the publisher’s version. / La version de cette publication peut être l’une des suivantes : la version prépublication de l’auteur, la version acceptée du manuscrit ou la version de l’éditeur.
Access and use of this website and the material on it are subject to the Terms and Conditions set forth at A Weighted-Tree Similarity Algorithm for Multi-Agent Systems in E-Business Environments
National Research Council Canada Institute for Information Technology Conseil national de recherches Canada Institut de technologie de l'information
A Weighted-Tree Similarity Algorithm for
Multi-Agent Systems in E-Business
Environments *
Bhavsar, V., Boley, H., Yang, L. 2004
* published in Computational Intelligence Journal, 20(4), 2004. NRC 48060.
Copyright 2004 by
National Research Council of Canada
Permission is granted to quote short excerpts and to reproduce figures and tables from this report, provided that the source of such material is fully acknowledged.
A WEIGHTED-TREE SIMILARITY ALGORITHM FOR MULTI-AGENT SYSTEMS IN E-BUSINESS ENVIRONMENTS*
VIRENDRAKUMAR C. BHAVSAR1, HAROLD BOLEY2,and LU YANG1
1
Faculty of Computer Science, University of New Brunswick, Fredericton,New Brunswick, Canada
2
Institute for Information Technology e-Business, National Research Council of Canada, Fredericton,
New Brunswick, Canada
A tree similarity algorithm for match-making of agents in e-Business environments is presented. Product/service descriptions of seller and buyer agents are represented as node-labelled, arc-labelled, arc-weighted trees. A similarity algorithm for such trees is developed as the basis for semantic match-making in a virtual marketplace. The trees are exchanged using an XML serialization in Object-Oriented RuleML. Correspondingly, we use the declarative language Relfun to implement the similarity algorithm as a parameterised, recursive functional program. Three main recursive functions perform a top-down traversal of trees and the bottom-up computation of similarity. Results from our experiments aiming to match buyers and sellers are found to be effective and promising for e-Business/e-Learning environments. The algorithm can be applied in all environments where weighted trees are used. Key words: multi-agent system, e-Business, e-Learning, similarity measure, buyer-seller matching, arc-labelled trees, arc-weighted trees, Object-Oriented RuleML, Relfun.
1. INTRODUCTION
With the increasing adoption of e-Business, buyer-seller message exchange for negotiation will be increasingly supported by advanced technologies from the Semantic Web and Web Services. In the emerging multi-agent virtual marketplace, seller and buyer agents will conduct e-Business activities basically as follows: Using a semantic representation for the message content, sellers advertise their product/service offers and buyers issue product/service requests so that a match-making procedure can pair semantically similar offer and request content, after which the paired agents can carry out negotiations and finalize their transactions. The present study employs a multi-agent architecture similar to Agent-based Community Oriented Routing Network (ACORN) (Marsh et al. 2003) as the foundation for semantic match-making (Sycara et al. 2001) and focuses on its central similarity algorithm for comparing RuleML-like message contents (Boley 2003).
In a multi-agent system such as ACORN (Marsh et al. 2003) a set of key words/phrases with their weights is used for describing the information an agent is carrying or seeking. Product/service advertising and requesting can be realized on top of sets of weighted key words/phrases. However, such a flat representation is limited in that it cannot represent tree-like product/service descriptions. For example, when we want to describe a car, we often provide its colour, maker and model. The attribute colour is independent of the maker of the car, while the
*This paper is a revised and extended version of a paper presented at the Business Agents and the Semantic Web (BASeWEB) Workshop that was held in Halifax, Nova Scotia, Canada on June 14, 2003.
Address for correspondence: V. C. Bhavsar, Faculty of Computer Science, University of New Brunswick, Fredericton, New Brunswick E3B 5A3, Canada; e-mail:[email protected].
model is dependent of it because each car maker provides their own models. Therefore, to allow more fine-grained interaction between agents, we propose to represent descriptions in the form of weighted trees. Users give weights that reflect the importance of branches on all levels of such product/service describing trees. However, because of the many variants and refinements in modern products/services, a total match will rarely be possible; so partial matches, embodied in some measure of similarity, are needed. While some variety of trees has already been used in multi-agent systems to describe the content part of messages, tree similarity matching for such content representations has not been studied to our knowledge. On the other hand, many other flavours of similarity have been explored in Utility Theory and AI, in particular in Case-Based Reasoning (Richter 2001), some of which should be combinable with our tree similarity.
Node-labelled trees are a common data structure for information representation in various areas. In this paper, following Object Oriented (OO) modelling, F-Logic (Kifer et al. 1995), and the Resource Description Framework (RDF) (Lassila and Swick 1999), we propose node-labelled, arc-labelled (hence arc-unordered) trees, where not only node labels but also arc labels can embody semantic information. Furthermore, our trees are arc-weighted to express the importance of arcs. Arc labels represent attributes of products/services and arc weights represent their relative importance.
Trees must be transformed to an appropriate representation before the computation of their similarity. For a given application, buyer and seller trees must conform to the same standard schema in order to compute similarity. In a marketplace, the first step of a transaction between buyer and seller agents is to provide information that describes their requirements and offers. However, in a hybrid human-computer virtual marketplace, human buyers and sellers have to input that information. Thus, a user interface is needed for human buyers and sellers to input their descriptions. The interface implements a standard schema by generating instance trees only for well-formed input.
For the uniform representation and exchange of product/service trees we use a weighted extension of Object-Oriented RuleML (Boley 2003). In Weighted Object-Oriented RuleML, besides ‘type’ labels on nodes, there are ‘role’ labels on arcs, as in the alternating (or ‘striped’) syntax of RDF graphs (which quite often are trees or can be unrolled into trees); we assume here arc labels to be unique on each level, i.e. every pair of outgoing arcs of a given node must use different arc labels. Arc weights are numbers taken from the real interval [0,1] and employed as a general measure of relevance for branches, neutral w.r.t. any specific probabilistic, fuzzy-logic, or other interpretation.
Tree similarity (distance) techniques are an active area of research for applications like pattern recognition, image analysis and processing, natural-language processing (Kamat 1996) and bioinformatics. Previous work mostly dealt with node-labelled trees, whether they were ordered (Wang et al. 1998; Shasha et al. 2001) or unordered (Shasha et al. 1994). Operations including insertion, deletion and node label substitution (Lu 1979) with costs were defined to transform one tree to another to compute their distance complementary to their similarity. For local tree matching (Liu and Geiger 1999), operations such as merge, cut, and merge-and-cut, including costs, were also defined to find the best approximate match and matching cost. The Hamming Distance (Hamming 1986; Togneri and deSilva 2002) is also used in some approaches (Schindler et al. 2002) to compute the tree distance. However, because of our different tree representation, we needed to develop a new similarity measure as a recursive function, treesim, mapping any (unordered) pair of trees to a value in the real interval [0,1], not to be confused with the above arc weights, also taken from that interval. This will apply a co-recursive ‘workhorse’
function, treemap, to all pairs of subtrees with identical labels. For a branch in one tree without a corresponding branch in the other tree, a recursive simplicity function, treeplicity, decreases the similarity with decreasing simplicity. These functions are implemented in the functional-logic language Relfun (Boley 1999). Our current algorithm only considers a global measure for tree similarity, but not local measure. The Global measure computes the similarity of two trees based on matching pairs of arc labels and inner node labels. In this paper, the local similarity measure, which compares leaf node labels, is just an exact string comparison resulting in either 0.0 or 1.0. In order to demonstrate our tree similarity matching techniques, we specify here our particular buyer-seller interaction protocol elements.
Multi-agent systems provide a virtual marketplace for buyer and seller agents to conduct transactions. The form of the information carried by buyer and seller agents is crucial to their matching. In order to represent the hierarchical relationship between product/service attributes, we propose node-labelled, arc-labelled trees for product/service descriptions. However, because different users have different preferences on different product/service attributes, we allow users to assign weights to product/service attributes (arc labels) to indicate these preferences. Thus, the matching problem between buyers and sellers becomes the computation of tree similarity between buyer and seller agents. This paper proposes a new tree similarity measure based on our tree representation.
The paper is organized as follows. The architecture of a multi-agent system that carries out match-making of buyer and seller agents is outlined in the following section. The representation and generation of our node-labelled, arc-labelled, and arc-weighted trees are presented in Section 3. Many issues that need to be addressed while developing a similarity measure for our trees are discussed in Section 4. This section also presents our algorithm for computing the similarity of trees. Section 5 presents similarity results obtained with the Relfun implementation (included in the Appendix) of our algorithm. Finally concluding remarks are given in Section 6.
2. MULTI- AGENT SYSTEMS
Agent systems have been proposed and exploited for e-Business environments (see for example, (Yang et al. 2000)). In such systems, buyer agents deal with information about the items their owners want to buy and corresponding price they can accept, while seller agents deal with information about the items the sellers want to sell and the price they ask. Therefore, buyer agents and seller agents need to be matched for similarity of their interests and subsequently they can carry out negotiations (Chavez and Maes 1996). Furthermore, they may need another agent that acts as a middle man (Marsh et al. 2003) performing the match-making. A slightly more complex multi-agent architecture will be developed here.
2.1. The Architecture
The Agent-based Community Oriented Routing Network (ACORN) is a multi-agent architecture that can manage, search and filter information across the network. Among the applications of ACORN, e-Business is a very important one. We outline the architecture of an ACORN-like multi-agent system. This multi-agent system uses mobile agents.
Figure 1 shows an overview of the ACORN-like agent system architecture. The multi-agent system has the structure of a Client-Server system. Clients provide the interface to users. Users create and organize agents, such as buyer and seller agents, create and modify their profiles which describe the interests of users. As can be seen, user profiles are stored on the server side and the incoming agents are processed according to user profiles. The Main Server provides mobility to agents. When an agent reaches a new site, the agent can visit users and communicate with other agents at thematic meeting points, named Cafes.
The structure of an agent is shown in Figure 2. An agent contains its unique AgentID. The AgentType can be either buyer or seller. The agent also carries information about its owner (a buyer or seller). In this paper we focus on the Weighted Tree Metadata component of the agent, which carries a description of the products/services that a buyer wants to buy and a seller wants to sell.
2.2. Match-Making in the Cafe
As mentioned in Section 2.1, buyer and seller agents meet in a Cafe to conduct their transaction. In an ACORN-like multi-agent system, there can be more than one Cafe. Different Cafes are used for different applications. For example, one Cafe may be used for e-Commerce, while another Cafe is used for e-Learning.
One very important aspect of the multi-agent system is the exchange of information between agents in the pre-selected Cafe. Figure 3 shows a Cafe with buyer and seller agents. The buyer
Main Server User Info User Profiles User Agents Agents Cafe-1 Cafe-n To other sites Web Browser User
FIGURE 1. ACORN-like (Marsh et al. 2003) multi-agent system.
AgentMatcher 1 AgentMatcher n
AgentID AgentType Metadata about Owner Weighted Tree Metadata
and seller agents do not communicate with each other (Marsh et al. 2003) directly, but communicate through the AgentMatcher (Sarno et al. 2003) of the Cafe. One of the AgentMatcher’s components, Similarity Computation, is responsible for calculating the tree similarity between buyers and sellers. For example, if two agents enter the Cafe, one representing a car seller who wants to sell a Ford car that was made in 2002, another agent representing a car buyer that wants to buy a Ford car made in 1999, the e-Commerce Cafe is the place where an AgentMatcher computes their similarity and, above a threshold, lets them exchange their information.
We have adapted the above match-making scenario to e-Learning as part of the eduSource project (Boley et al. 2004). In this project, the buyer agent represents a learner and the seller agent is a course provider. The similarity computation and information exchange between learner and course agents work the same way as those between buyer and seller agents described above.
3. TREES 3.1. Representation
Various representations of trees and their matching are possible. To simplify the algorithm, we assume our trees are kept in a normalized form: the arcs will always be labelled in lexicographic (alphabetical) left-to-right order. The arc weights on the same level of any subtree are required to add up to 1. Two flat example trees that describe the course “JavaProgramming” are illustrated in Figure 4 (a) and (b). To emphasize the difference between arc labels and node labels, node labels will always be bold-faced.
FIGURE 4. Leaner and course trees.
JavaProgramming Credit Thinking inJava Textbook Tuition Duration $800 2months 3 0.2 0.1 0.3 0.4 JavaProgramming Credit JavaGuidence Textbook Tuition Duration $1000 2months 3 0.1 0.5 0.2 0.2
(a) Tree of a learner agent. (b) Tree of a course agent.
FIGURE 3. Match-making of buyer and seller agents in a Cafe (adopted from (Marsh et al. 2003)).
Cafe Buyer 1 Buyer 2 Seller 1 Seller 2 Buyer n Seller m AgentMatcher
Figure 4 (a) represents a tree carried by a learner agent. In this tree, the course this learner searches is “JavaProgramming”. Subtrees stretching out from this root node represent the learner’s preferences about this course. For example, this learner gives the arc “Tuition” the highest weight “0.4” relative to other arcs to express that cost will be the most important factor for his/her decision-making. The leaf node “$800” is the amount of money he/she is expecting. This learner only gives the arc “Duration” (of 2 months) a rather low weight “0.1”, which means that he/she does not care much about how long the course will last. The other two subtrees (leaves) are analogous.
In order to be applicable to real world description refinement, we do not limit the complexity, breadth or depth, of any subtree. So, the trees in Figure 4 could have extra subtrees for the interaction language, prerequisites, etc., as well as a non-leaf “Textbook” subtree mentioning a website etc.
Capturing these characteristics of our arc-labelled, arc-weighted trees, Weighted Object-Oriented RuleML, a RuleML version for OO modelling (Boley 2003), is employed for serialization in Web-based agent interchange. The XML child-subchild structure reflects the shape of our normalized trees and XML attributes are used to serialize the arc labels and weights. So, the tree in Figure 4 (b) will be serialized as shown in Figure 5 (a).
In Figure 5 (a), the complex term (cterm) element serializes the entire tree and the _opc role leads to its root-node label, “JavaProgramming”. Each child element _slot is a metarole, where the start tag contains the names and weights of arc labels as XML attributes name and weight, respectively, and the element content is the role filler serializing a subtree (e.g. a leaf). Consider the first _slot metarole of the cterm as an example. The attribute name has the value “Credit”, describing the credit name of the course “JavaProgramming”. The other attribute weight, with the value “0.1”, endows the “Credit” branch with its weight. The content between the _slot tags is an ind (individual constant) serializing a leaf node labelled “3”. Such weights have the interpretation of relative importance. For example, from a course’s point of view the “Credit” weight means that the importance of the credit of this course is 0.1 relative to the other subtrees “Duration”, “Textbook” and “Tuition”, which have importance “0.5”, “0.2” and “0.2”, respectively. cterm[ -opc[ctor[javaProgramming]], -slot[name[Credit],weight[0.1]][ind[3]], -slot[name[Duration],weight[0.5]][ind[2months]], -slot[name[Textbook],weight[0.2]][ind[javaGuidence]], -slot[name[Tuition],weight[0.2]][ind[$1000]] ] <cterm> <_opc><ctor>JavaProgramming</ctor></_opc>
<_slot name=“Credit” weight=“0.1”><ind>3</ind></_slot>
<_slot name=“Duration” weight=“0.5”><ind>2months</ind></_slot> <_slot name=“Textbook” weight=“0.2”><ind>JavaGuidence</ind></_slot> <_slot name=“Tuition” weight=“0.2”><ind>$1000</ind></_slot>
</cterm>
FIGURE 5. Symbolic tree representations.
(a) Tree serialization in Weighted OO RuleML.
For the purpose of our Relfun implementation, Weighted OO RuleML serializations such as Figure 5 (a) become Relfun structures such as Figure 5 (b). The correspondence is quite obvious, except that we have to use, e.g., –slot to denote a metarole, because any symbol beginning with a “_” (like any capitalized symbol) in Relfun denotes a variable.
3.2. Generation
It is clear that trees users have in mind must be transformed to the internal representation before computing their similarity. In order to make the similarity values reasonable and comparable, trees cannot be generated arbitrarily by buyers or sellers. For a specific application, e.g., e-Commerce, trees representing the information of buyers and sellers have to conform to the same standard schema. The standard schema for a specific application restricts what node labels and arc labels will be allowed in instance trees.
Using e-Learning application as an example, course providers want to advertise their courses, while learners want to search appropriate courses. In order to describe a course, from our eduSource project experience, we need to specify the course name, course level, interaction language, etc. For the specific e-Learning application, Internet-enabled hardware and software are also needed. In our design of a standard schema for both learners and course providers, we tried to address concerns of both sides. Figure 6 shows the core of our standard tree schema for eduSource. Most node labels and arc labels in Figure 6 conform to the Candian Learning Object Metadata (CanLOM) standard (CanCore 2003).
In the above tree schema, we do not provide any arc weights because they are decided by the course providers and learners. For every leaf node, we give an enumation of potential values for
Educational General Configuration AgeRange Hardware Description Context E-mail Technical Software Title Language Course Level {9-11,12-17,18- 25,26-33,34-40,41-47,48-54} {Grade1, …,Grade12, SecondaryEducation} {English, French,…, Chinese} {“How C Programming Works”, … , “Introduction to Java”} {Yes,No} {PC, … , Mac} {IE,Netscape, Mozilla}
FIGURE 6. A standard tree schema for e-Learning.
Educational General Configuration AgeRange Hardware Description Context E-mail Technical Software Title Course Level 18-25 Grade8 HowCProgrammingWorks Yes PC IE
FIGURE 7. An instance tree generated from the interface in Figure 8.
1.0
0.2 0.8 0.3
learners and course providers to select from. For example, for the arc “Language”, learners or course providers can select English or the other listed languages as their favorite interaction language. For certain nodes, also ‘built-in’ types could be employed, for example, boolean or string.
Based on the tree schema, interfaces have been designed for learners and course providers to input their preferences. Figure 8 shows a learner interface based on Figure 6, as used to input the instance tree shown in Figure 7.
In this interface, there are three groupboxes: Course Description, Educational Level and Computer Configuration. Each groupbox corrsponds to one subtree stretching out from the root node “Course” in Figure 6. But the occurrence of these groupboxes in the interface does not conform to the “Educational-General-Technical” sequence in the tree schema. As mentioned in Section 3, arc labels at the same level in any subtree are kept in lexicographic order. However, in the interface, the text label “Course Name” should occur earlier than any other text labels because it is the most important information for both learners and course providers. Also, some text labels do not completely conform to the arc or node labels in the tree schema because the interface should be as intuitive as possible.
Before every text label there is a check box to specify preferences. In Figure 8, the text label “Interaction Language” is not checked. Those unchecked text labels will lead to missing branches in instance trees. After every text label there is a combobox for selecting
conforming values. Users also need to specify the importance (weights) of the checked text labels. In the interface, the scale of every importance slider is extended to the convenient interval [0,10]. Within every groupbox, all the importance values for checked text labels are thus forced to add up to 10.
Based on the snapshot of the learner interface in Figure 8, the instance tree in Figure 7 is generated. Its arc weights are not from 0 to 10, but from 0 to 1: every importance value is devided by 10 to get the corresponding arc weight from the real interval [0,1]. There is also an interface for course providers with slightly different conventions. Both interfaces, however, conform to the same tree schema shown in Figure 6.
4. SIMILARITY OF TREES
When developing a tree similarity measure, several issues have to be tackled because of the quite general shape of trees, their recursive nature, and their arbitrary sizes. The similarity function maps two such potentially very complex trees to a single real number ranging between 0 and 1. These issues are discussed in the first subsection with examples. The similarity algorithm is outlined in the subsequent subsection and fully listed in the appendix.
4.1. Issues
In this subsection, we present six groups of characteristic sample trees that explore relevant issues for developing a similarity measure. Section 5 gives similarity values of these trees using the algorithm given in Section 4.2.
Example 1:
In Figure 9, tree t1 and tree t2 have the same root node label “Auto”. But the node labels of
subtrees (leaf nodes) are all different. In this example, although the two leaf nodes have numeric values, we do not carry out any arithmetic operation on these values to find out their closeness. Therefore, the similarity of these trees could be defined as zero. However, we have decided to award a user specifiable similarity ‘bonus’ reflecting the equality of the root nodes.
Example 2: Auto 0.5 Make 2002 Ford Year 0.5 Auto 0.5 Make 1998 Chrysler Year 0.5
FIGURE 9. Two trees with mismatching leaves.
t1 t2 Auto 0.0 Make 2002 Ford Year 1.0 Auto 1.0 Make 1998 Ford Year 0.0
(a) Trees with opposite extreme weights.
t1 t2 Auto 0.0 Make 2002 Ford Year 1.0 Auto 1.0 Make 2002 Ford Year 0.0
(b) Trees as in (a) but with identical leaves.
This example can be viewed as a modification of Example1. In Figure 10 (a), tree t1 and tree
t2 have one identical subtree, the leaf “Ford,” and therefore the similarity of these two subtrees
could be considered as 1.0. However, we note that the weights of the arcs labelled “Make” are 0.0 versus 1.0. This indicates that the agent of tree t1 puts no emphasis on the “Make” of the
automobile, even though “Ford” is specified. The agent of tree t2 puts the whole emphasis on the
“Make” of the automobile. The averaged weight, using the arithmetic mean, of the corresponding branches is (0.0 + 1.0)/2 = 0.5. Our similarity measure for the “Make” branches, then, is defined using a pre-multiplier of value 1.0, because of the same label “Ford,” as 1.0*(0.0 + 1.0)/2 = 0.5. We could have chosen to use the geometric mean, which would give zero branch similarity. However, we think that the branch similarity should be nonzero for identical subtrees. Since the leaf node labels for the “Year” branches are different we use a pre-multiplier of 0.0, and we obtain 0.0*(1.0 + 0.0)/2 = 0.0. Thus, the weights of the branches do not contribute to the similarity, as stated for Example 1. We consider the similarity of trees with one having an arc weight equal to 0.0 to be larger than the similarity of trees with one having a missing arc. Thus, the similarity S(t1, t2) of the entire trees t1, t2 is defined as follows:
S(t1, t2) = 1.0*(0.0 + 1.0)/2 + 0.0*(1.0 + 0.0)/2 = 0.5.
In Figure 10 (b), tree t3 and tree t4 are the same as in Figure 10 (a) but have identical leaves.
In this case, the trees are exactly the same except for their weights. In an e-Business environment this can be interpreted as follows. While the seller and buyer agents have attached opposite branch weights to reflect their subjective preferences, their autos represented are exactly the same. This implies that the similarity of the two trees should be equal to 1.0. Indeed, we obtain the similarity analogously to the case of (a), as follows:
S(t3, t4) = 1.0*(0.0 + 1.0)/2 + 1.0*(1.0 + 0.0)/2 = 1.0.
Example 3:
Figures 11 (a) and (b) represent two pairs of trees only differing in the weights of the arcs of t2 and t4. In Figure 11 (a), t1 has only one arc with label “Make,” which also occurs in tree t2. But
their leaf node labels are different. The situation of Figure 11 (b) is the same as Figure 11 (a) except that the weight of the label “Make” is 0.9 in tree t4, while it is 0.1 in tree t2. On cursory
look, the similarity of both pairs of trees should be identical because the leaf node differences between each pair of trees are identical. However, we should not overlook the contribution of the weights. In tree t2, the weight of arc-label “Make” is much smaller than that in tree t4. Thus,
during the computation of similarity, the weight of the arc labelled “Make” should make a different contribution to the similarity: the importance of the “Chrysler-Ford” mismatch in Figure 11 (a) should be much lower than the same mismatch in Figure 11 (b). So, we expect S(t1, t2) > S(t3, t4).
FIGURE 11. Tree pairs only differing in arc weights.
0.1 Category Auto Chrysler Auto 0.45 Make 2000 Ford Year t1 t2 1.0 Make 0.45 Sedan (a) t3 t4 (b) 0.9 Category Auto Chrysler Auto 0.05 Make 2000 Ford Year 1.0 Make 0.05 Sedan
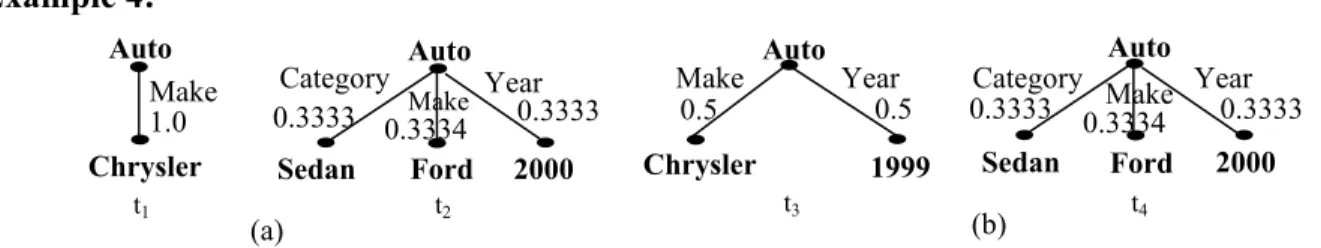
Example 4:
In Figure12 (a), tree t1 only has one arc, while tree t3 in Figure 12 (b)has two arcs. Tree t2
and tree t4 are identical. However, in both pairs of trees, for identical arc labels, the leaf nodes
are different. For example, both tree t3 and tree t4 have arc label “Year”, but their node labels are
“1999” and “2000”, respectively. Tree t1 only has one different subtree compared to tree t2, but
tree t3 has two different subtrees compared to tree t4. Therefore, S(t1, t2) > S(t3, t4).
Example 5:
In Figures 13 (a) and (b), trees t1 and t2 and trees t3 and t4 have almost the same structure
except one pair of node labels “2002” and “1999”. So, we are sure that node labels and arc labels cannot make S(t1, t2) and S(t3, t4) different. But for the arc label “Year”, Figure 13 (a) and Figure
13 (b) have different weights which should lead to S(t1, t2) < S(t3, t4), because of the higher
mismatch of weights in Figure 13 (a) compared to Figure 13 (b).
Example 6:
Figure 14 gives four sample trees with an increasing number of subtrees. Tree t1 is an empty
tree (a labelled tree) while the other trees have one or more branches. Intuitively, when comparing tree t1 to the other trees, the more complex a tree, the smaller the tree’s simplicity (we
refer to it as treeplicity), and, consequently, the smaller its similarity with t1. Thus, we initially
expected that S(t1, t2) > S(t1, t3) > S(t1, t4). Clearly, S(t2, t3) > S(t2, t4). For a discussion of the
actual results obtained see Section 5.
FIGURE 12. Tree pairs with left-tree refinement.
0.3334 Make Auto Chrysler Auto 0.3333 Make 2000 Ford Year t1 t2 1.0 Category 0.3333 Sedan Category Auto Chrysler Auto Make 2000 Sedan Year t3 t4 0.5 Make Ford (a) (b) Year 0.5 1999 0.3333 0.3334 0.3333
FIGURE 13. Tree pairs with the same structure.
0.2 Make Auto 0.3 1999 Ford Year t2 0.5 Sedan (a) 0.2 Category Auto 0.3 2002 Ford Year t1 Make 0.5 Sedan Category Make Auto Year t4 (b) 0.3333 0.3333 0.3334 Make Year t3 0.3333 0.3333 0.3334 Auto Category Category 1999 Ford Sedan 2002 Ford Sedan Auto Auto Year 2002 Make 0.2 0.3 0.5
FIGURE 14.Trees with an increasing number of subtrees.
t1 t4 Auto Category Sedan Ford Make 0.5 0.5 t3 Auto t2 Make 1.0 Ford Category Sedan Ford
4.2. The Algorithm
The similarity algorithm is defined recursively, by case analysis. Here we explain its main functions treesim, treemap, and treeplicity in semi-formal English. Using the RuleML cterm representations introduced in Figure 5, the appendix gives the full formal definition in Relfun (Boley 1999). The call structure is as follows, where [bracketed] parameters are distinguished from (parenthesised) arguments: The main function treesim[N,A](t,t') calls the ‘workhorse’ function treemap[N,A](l,l’), which co-recursively calls treesim; treemap also calls treeplicity(i,t). The parameter “N” (with a value between 0 and 1) takes into account the relative importance of the roots versus the (sub)trees underneath. The functional parameter “A” specifies an adjustment function to prevent similarity degradation with depth deepening.
treesim[N,A](t,t')
The treesim recursion is terminated by two (sub)trees t and t' that are leaf nodes or empty trees, in which case their similarity is 1.0 if their node labels are identical and 0.0 otherwise. If only one of the (sub)trees is a leaf node, the other being a non-leaf node (including an empty tree), the leaf node is ‘converted’ into an empty tree taking over the leaf node label, and the similarity of the resulting trees is computed.
The similarity of two (sub)trees, t and t', including leaves, with different node labels is defined to be 0.0.
If two non-empty (sub)trees have identical rootnode labels, their similarity will be computed via treemap by a recursive top-down (root-to-leaf) traversal through the subtrees, ti and t'i, that
are accessible on each level via identical arc labels li; on a given level, the index i
─ implicit in the recursion of our implementation ─ accesses the arc labels in lexicographic (left-to-right) order. A node-equality fraction N ─ a ‘bonus’ value from [0,1] ─ is added to the complementary fraction (1-N) of this subtree comparison (in this paper, the value of N is consistently assumed to be 0.1).
treemap[N,A](l,l’)
The treemap function recursively compares two lists, l and l', of weighted arcs on each level of identical-rootfan-out identified by treesim.
In general, the arcs can carry arbitrary weights, wi and w'i from [0,1]. The weights are
averaged using the arithmetic mean, (wi + w'i)/2, and the recursively obtained similarity si of trees
ti and t'i─ adjusted to A(si) by an arc function A ─ is multiplied by the averaged weight. Finally,
on each level the sum of all such weighted adjusted similarities, A(si)(wi + w'i)/2, is divided by the sum of all averaged weights:
∑ (A(si)(wi + w'i)/2) / ∑ (wi + w'i)/2 (1)
In general, A can be any function from [0,1] to [0,1], but we assume A(x) ≥ x to compensate similarity degradation for nested trees. Two examples are the identity function, A(si) = si, and the
square root, A(si) = si . This arc-similarity-adjusting function also permits different (seller,
buyer) agents to use different ‘yardsticks’, even when comparing the same pair of trees. For example, for agents biased towards higher similarities, the square root function is preferable to the identity function.
In the special case that weights on some level of both trees add up to 1, the denominator of formula (1) becomes 1. Hence, if we require that the weights on each level of both trees add up to 1 (a reasonable assumption used throughout this paper), formula (1) will be simplified:
∑ (A(si)(wi + w'i)/2) (2)
Suppose that, on a given level, for an arc label li in t there exists no identical arc label in t' (or
vice versa). In this case, the algorithm uses treeplicity to compute the similarity based on the simplicity of an ‘extracted’ tree consisting of a newly generated root and the subtree reachable via li. Intuitively, the simpler the tree extracted from t, the larger its similarity to the
corresponding empty tree extractable from t'. So, we use the simplicity as a contribution to the similarity of t and t'.
treeplicity(i,t)
During the similarity computation of two trees, whenever a subtree is missing in the other tree, treeplicity is called for the subtree. With a depth degradation index i (initialised with 1-N by treemap) and a single tree t as inputs, this simplicity measure is defined recursively to map an arbitrary single tree t to a value from [0,1], decreasing with both the tree breadth and depth. The recursion process terminates when t is a leaf node or an empty tree. For a non-empty (sub)tree, simplicity will be computed by a recursive top-down traversal through its subtrees. Basically, the simplicity value of a tree t is the sum of the simplicity values of its subtrees multiplied with arc weights from [0,1], a subtree depth degradation factor ≤ 0.5, and a subtree breadth degradation factor from (0,1].
For any subtree ti underneath an arc li, we multiply the arc weight of li withthe recursive
simplicity of ti. To enforce smaller simplicity for wider trees, the reciprocal of the tree breadth is
used on every level as the breadth degradation factor. On each level of deepening, the depth degradation index i is multiplied with a global depth degradation factor treeplideg ≤ 0.5 (= 0.5 will always be assumed here), and the result will be the new value of i in the recursion.
The smaller the treeplideg factor, the smaller will be the tree simplicity value. As described in Example 6, Section 4.1, smaller tree simplicity also leads to smaller tree similarity. Based on the sum of the infinite decreasing geometric progression ...
2 1 ... 2 1 2 1 2 + + + + n being 1, we
assume that treeplideg is 0.5 in order to enforce the smallest acceptable degradation through the recursion: this guarantees that the simplicity of finite trees will always be smaller than 1. For leaf nodes or empty trees found on any level, the current i value will be their simplicity. For example, if tree t consists just of a leaf node, its simplicity value should be i. Thus, since we initialise i with 1-N and assume N = 0.1, every leaf’s simplicity is 0.9.
5. EXPERIMENTAL RESULTS
In this section we consider the examples discussed in Section 4.1 and use our implemented algorithm in Section 4.2 to obtain similarity values. Table 1 summarizes the similairity values obtained for all tree pairs. In our experiments we have set the node-equality parameter N to 0.1.
For Example 1, the complete mismatch of corresponding leaf nodes leaves only the user specified similarity ‘bonus’ of 0.1, reflecting the equality of the root nodes contributing to the similarity. The similarities of Example 2 (a) and (b) are obtained as 0.5 and 1.0, respectively, as desired (see Section 4.1).
Since the importance of the “Chrysler-Ford” mismatch in Figure 11 (a) of Example 3 should be much lower than the same mismatch in Figure 11 (b), we expected S(t1, t2) > S(t3, t4). It turns
out that S(t1, t2) is more than two times bigger than S(t3, t4).
For Example 4 we anticipated that S(t1, t2) > S(t3, t4). Our program gives consistent results.
Our results confirm the expected result of S(t1, t2) < S(t3, t4) for the Example 5.
Example 6 consists of four trees and we first expected S(t1, t2) > S(t1, t3) > S(t1, t4).
However, we observe that we obtain S(t1, t2) = S(t1, t3) = S(t1, t4). This can be explained as
follows. Our constraint that weights on the same level add up to 1 together with our similarity-decreasing use of the weights imply that more branches in one of the trees do not necessarily make it less similar to the other tree since its weights must also be decreased. For instance, a single 1.0-weighted branch is worth as much as two 0.5-weighted branches. Thus, the t1
similarities with t2, t3, and t4, are identical.
In order to prevent rapid depth degradation of the similarity for complex trees, we propose three arc similarity adjusting functions as similarity parameters to ensure that the results are reasonable and intuitive. This is exemplified here with two 2-level trees shown in Figure 15.
Example Tree Tree Similarity
Example 1 t1 t2 0.1 t1 t2 (a) 0. 5 Example 2 t3 t4 (b) 1.0 t1 t2 0.2823 Example 3 t3 t4 0.1203 t1 t2 0.2350 Example 4 t3 t4 0.1675 t1 t2 0.55 Example 5 t3 t4 0.7000 t1 t2 0.3025 t1 t3 0.3025 t1 t4 0.3025 t2 t3 0.8763 Example 6 t2 t4 0.8268 Auto Category Ford Sedan Miles 0.3 0.4 Price Year 10000 Make Engine Model 0.3 0.5 0.3 0.7 Taurus 0.5 t1
FIGURE 15. Applying three arc-adjusting functions to a pair of trees.
V-6 2001 20000 Auto Category Ford Sedan Miles 0.6 0.2 Year 10000 Small Make Engine Model 0.5 0.5 0.2 Taurus 0.5 0.5 t2 V-8 Size 1999 TABLE 1. Experimental results of the examples in Section 4.1.
The square root function satisfies our assumption from Section 4.2 that A(x) ≥ x in the closed interval [0,1], and actually achieves A(x) > x in the open interval (0,1). We also conducted experiments with compositions of root functions and logarithmic functions. For tree t1
and t2 in Figure 15, if we use A(si) = si , we get S(t1,t2) = 0.6398; while if we use A(si) =
) 1 (
log2 si + , we obtain S(t1,t2) = 0.6696. Should the user want the similarity to increase faster
than this composition, he/she can also use A(si) = 3 si , resulting in S(t1,t2) = 0.6813;
analogously, one could use higher roots of si or of log2(si +1). However, we feel the results
obtained from the composition log2(si +1) are the most reasonable ones, especially for binary trees. Ultimately, it is up to the user to choose appropriate adjustment functions.
6. CONCLUSION
The outlined multi-agent system is a novel architecture for agents to represent information and interact with each other. We focus on the metadata information these agents carry, and a similarity measurement over this information. In order to make the interaction between agents more meaningful and fine-grained, we chose trees to represent this information. More precisely, these trees are node-labelled, arc-labelled, and arc-weighted. The characteristics of these kinds of trees led us to use complex terms of Weighted Object-Oriented RuleML and XML attributes within them to represent arc labels and arc weights.
Our tree similarity algorithm, as part of semantic match-making between agents, computes the similarity of subtrees in a recursive way. It can be parameterized by different functions to adjust the similarity of these subtrees. This gives agents the option to tailor their similarity measure for trees based on their subjective preferences. Other parameter functions could, e.g., be “local” similarity measures for leaf nodes of various types. The appendix gives the full definition of the extensible core algorithm in Relfun. This executable functional specification has proved to be a flexible test bed for our experiments. These experiments have given us meaningful results for e-Commerce/e-Learning environments. The algorithm can also be applied in other environments wherein weighted trees are used, and reimplemented in other languages, as we did in Java.
This multi-agent system has already been adapted for an electric power grid application with power plants as sellers and power distributors as buyers (Sarno et al. 2003). The tree representations and the similarity algorithm described in the current paper could be used unchanged in this new application. This has shown the flexibility of our match-making architecture for e-Business environments.
For expressing buyer queries, we have already generalized our trees to non-ground trees containing “Don’t Care” leaves that have similarity value 1.0 with arbitrary corresponding seller trees. Furthermore, local similarity measures will be incorporated as a polymorphic functional parameter, based on the semantic leaf comparison of our eduSource e-Learning application (Boley et al. 2004). Finally, in a dynamic marketplace, it would be desirable to allow more flexible agent interactions. In future work we will thus consider user-definable buyer-seller interaction protocols.
ACKNOWLEDGEMENTS
We thank the anonymous reviewers from the BASeWEB program committee and the CI journal for helpful feedback, as well as Daniel Lemire, NRC IIT e-Business, and Michael Richter, University of Kaiserslautern, for many discussions, especially about product modelling and alternatives to the arithmetic mean. We also thank the CANARIE eduSource Project as well as NSERC for their support.
REFERENCES
BOLEY, H. 1999. Functional-Logic integration via minimal reciprocal extensions. In Theoretical Computer Science 212, Elsevier, pp. 77-99.
BOLEY, H. 2003. Object-Oriented RuleML: User-level roles, URI-grounded clauses and order-sorted terms. Springer-Verlag, Heidelberg, LNCS-2876, pp. 1-16.
BOLEY, H., V.C. BHAVSAR, D. HIRTLE, A. SINGH, Z. SUN, and L. YANG. 2004. AgentMatcher search in weighted, tree-structured Learning Object Metadata. Presented at Learning Objects Summit, Fredericton, March 29-30, 2004.
CanCore. 2003. CanCore guidelines version 1.9: educational category. Accessed on January 30, 2004:
http://www.cancore.org/guidelines/1.9/CanCore_guidelines_Educational_1.9.pdf.
CHAVEZ, A. and P. MAES. 1996. Kasbah: An agent marketplace for buying and selling goods. In Proceedings of the
First International Conference on the Practical Application of Intelligent Agents and Multi-Agent Technology, London, pp. 75-90.
HAMMING, R.W. 1986. Error-correcting codes. In Coding and Information Theory (Second Edition). Prentice-Hall,
Englewood Cliffs, NJ, 1986.
KAMAT, V.N. 1996. Inductive learning with the evolving tree transformation system. Ph.D. thesis, Faculty of Computer Science, University of New Brunswick, Fredericton, Canada.
KIFER, M., G. LAUSEN and J. WU. 1995. Logical foundations of object-oriented and frame-based languages. JACM 42(4):741-843.
LASSILA, O. and R.R. SWICK. 1999. Resource Description Framework (RDF) model and syntax specification.
Recommendation REC-rdf-syntax-19990222, W3C.
LIU, T., and D. GEIGER. 1999. Approximate tree matching and shape similarity. In Proceedings of the Seventh International Conference on Computer Vision, Kerkyra, pp. 456-462.
LU, S. 1979. A tree-to-tree distance and its application to cluster analysis. IEEE Transactions on Pattern Analysis and Machine Intelligence, PAMI-1(2):219-224.
MARSH, S., A. GHORBANI and V.C. BHAVSAR. 2003. The ACORN multi-agent system. Web Intelligence and Agent Systems, IOS Press, Amsterdam, 1(1):1-21.
RICHTER, M.M. 2001. Case-Based Reasoning: past, present, and future. Invited Futures Talk, International
Conference on Case-Based Reasoning (ICCBR-2001), Vancouver, British Columbia, Canada.
SARNO, R., L. YANG, V.C. BHAVSAR and H. BOLEY. 2003. The AgentMatcher architecture applied to power grid transactions. In Proceedings of the First International Workshop on Knowledge Grid and Grid Intelligence, Halifax, pp. 92-99.
SCHINDLER, B., F. ROTHLAUF, and H. J. PESCH. 2002. Evolution strategies, network random keys, and the one-max
tree problem, In Applications of Evolutionary Computing: EvoWorkshops, Edited by Stefano Cagnoni, Jens Gottlieb, Emma Hart, Martin Middendorf and Gunther R. Raidl. Springer, Vol. 2279 of LNCS, pp. 143-152.
SHASHA, D., J. WANG, and K. ZHANG. 2001. Treediff: approximate tree matcher for ordered trees. Accessed on
October 20, 2003: http://www.cs.nyu.edu/cs/faculty/shasha/papers/tree.html.
SHASHA, D., J. WANG, and K. ZHANG. 1994. Exact and approximate algorithm for unordered tree matching. IEEE
Transactions on Systems, Man and Cybernetics, 24(4):668-678.
SYCARA, K., M. PAOLUCCI, M. VAN VELSEN, and J. A. GIAMPAPA. 2001. The RETSINA MAS infrastructure.
Robotics Institute, Carnegie Mellon University, CMU-RI-TR-01-05.
TOGNERI, R., and C. J. S. deSILVA. 2002. Fundamentals of channel coding. In Fundamentals of Information Theory
WANG, J., B. A. SHAPIRO, D. SHASHA, K. ZHANG, and K. M. CURREY. 1998. An algorithm for finding the largest approximately common substructures of two trees. IEEE Transactions on Pattern Analysis and Machine Intelligence, 20:889-895.
YANG, Q., C. CARRICK, J. LAM, Y. WANG, and H. ZHANG. 2000. Exploiting intelligent agents and data mining for e-Commerce. In Electronic Commerce Technology Trends. Edited by W. Kou and Yesha. IBM Press, pp. 115-134.
Appendix: The Weighted Tree Similarity Algorithm in Relfun % Assumes both weighted trees are already in a 'lexicographic' normal form % (roles branch off in 'alphabetic' order).
% Tree representation uses OO RuleML syntax in Relfun, where roles start % with a "-", not with a "_" (free in XML, but variable prefix of Relfun): % http://www.ruleml.org/indoo
% Uses the parameter N(ode) for specifying the fraction to which the equality % of tree-root node labels is counted relative to the result of the recursive % comparison of its list of subtrees.
% Uses the functional parameter A(djust), which can be the id(enti)ty, sqrt, % etc., for compensating similarity degradation for nested trees.
% A binary function, treesim, computes the similarity between its two tree % arguments, co-recursively calling treemap, which sums up the similarities % of its two lists of (sub)trees. We assume that the weights in each subtree % fan-out sum up to 1. Here, 1 means total similarity; 0 represents absolute % dissimilarity. Since treesim is symmetric in its two arguments, some of the % algorithm's clauses could be simplified (incurring an efficiency penalty). % Analogously, a unary function, treeplicity computes the simplicity of its % single tree arguments, co-recursively calling treeplimap. The simplicity % measure is used by the similarity measure for subtrees occurring in only one % of the trees. Here, 1 means total simplicity; 0 (never to be reached) would % represent infinite complexity.
% Only the deterministic, functional subset of Relfun is required, where '=' % is the 'cut-return' infix and "lhs = rhs if cond" is a conditional equation; % the unconditional equation "lhs = rhs" abbreviates "lhs = rhs if true". % Built-ins are taken from Common Lisp. E.g., string< and string> compare % two string or symbol arguments for 'lexicographic' less and greater order. % Source at http://www.cs.unb.ca/~boley/treesimilarity/treesim.rfp
% runs at http://serv-4100.dfki.uni-kl.de:8000/~vega/cgi-bin/rfi
% Paste the program into the above URL's Database window:
treesim[N,A](ind[Leaf],ind[Leaf]) = 1. % Same leaves treesim[N,A](ind[Leaf1],ind[Leaf2]) = 0. % Different leaves treesim[N,A](cterm[ -opc[ctor[Label]] % Same node Label ],
cterm[ -opc[ctor[Label]] % on two empty trees: ])
treesim[N,A](cterm[ -opc[ctor[Label]] % Same node Label on two trees, | Rest1 ],
cterm[ -opc[ctor[Label]] % one or both being non-empty: | Rest2 ])
=
+(N, % add N(ode) fraction *( -(1,N), % to 1-N fraction of treemap[N,A](Rest1,Rest2) ) ). % subtree list comparison treesim[N,A](cterm[ -opc[ctor[Label1]] % Different node Labels
| Rest1 ],
cterm[ -opc[ctor[Label2]] % on arbitrary trees: | Rest2 ])
= 0. % 0
treesim[N,A](ind[Label], % Same Label on leaf and on cterm[ -opc[ctor[Label]] % arbitrary tree (e.g. empty): | Rest ])
=
treesim[N,A](cterm[ -opc[ctor[Label]] % Substitute empty tree ],
cterm[ -opc[ctor[Label]] | Rest ]).
treesim[N,A](cterm[ -opc[ctor[Label]] % Same Label on arbitrary tree | Rest ],
ind[Label]) % (e.g. empty) and on leaf: =
treesim[N,A](cterm[ -opc[ctor[Label]] | Rest ],
cterm[ -opc[ctor[Label]] % Substitute empty tree ]).
treesim[N,A](ind[Label1], % Different Labels on leaf and cterm[ -opc[ctor[Label2]] % on arbitrary tree (e.g. empty): | Rest ])
= 0. % 0
treesim[N,A](cterm[ -opc[ctor[Label1]] % Different Labels on arbitrary | Rest ], % tree (e.g. empty)
ind[Label2]) % and on leaf: = 0. % 0
treemap[N,A]([],[]) = 0. treemap[N,A]([ First | Rest ],
[]) % no Role1 in empty T2 =
+( *( 0.5,treeplicity(-(1,N),
cterm[ -opc[ctor[Label]],First ])), treemap[N,A](Rest,[]) ).
treemap[N,A]([], % no Role2 in empty T1 [ First | Rest ])
=
+( *( 0.5,treeplicity(-(1,N),
cterm[ -opc[ctor[Label]],First ])), treemap[N,A]([],Rest) ).
treemap[N,A]([ -slot[name[Role],weight[Weight1]][Subtree1] % T1 and T2 start | Rest1 ],
[ -slot[name[Role],weight[Weight2]][Subtree2] % with same role | Rest2 ])
= % With assumption +( *( /( +(Weight1,Weight2),2), % Weight sum = 1: A(treesim[N,A](Subtree1,Subtree2))), % A(djusted) sub- treemap[N,A](Rest1,Rest2) ). % tree comparison treemap[N,A]([ -slot[name[Role1],weight[Weight1]][Subtree1] | Rest1 ], [ -slot[name[Role2],weight[Weight2]][Subtree2] | Rest2 ]) = +( *( 0.5, treeplicity(-(1,N), cterm[ -opc[ctor[Label]], -slot[name[Role1],weight[Weight1]][Subtree1] ])), treemap[N,A](Rest1, [ -slot[name[Role2],weight[Weight2]][Subtree2] | Rest2 ]) ) if
string<(Role1,Role2). % Role1 missing in T2 treemap[N,A]([ -slot[name[Role1],weight[Weight1]][Subtree1] | Rest1 ], [ -slot[name[Role2],weight[Weight2]][Subtree2] | Rest2 ]) = +( *( 0.5, treeplicity(-(1,N), cterm[ -opc[ctor[Label]], -slot[name[Role2],weight[Weight2]][Subtree2] ])), treemap[N,A]([ -slot[name[Role1],weight[Weight1]][Subtree1] | Rest1 ], Rest2) ) if
string>(Role1,Role2). % Role2 missing in T1
treeplicity(I,ind[Leaf]) = I. % I: Current depth degradation index treeplicity(I,cterm[-opc[ctor[Label]]]) = I. % (initialized with 1-N fraction) treeplicity(I,cterm[ -opc[ctor[Label]],First | Rest ])
=
*( /(1,1+(len(Rest))), % Breadth degradation factor treeplimap(I,[First | Rest ])). treeplimap(I,[]) = 0. treeplimap(I,[-slot[name[Role],weight[Weight]][Subtree] | Rest ]) = +(*(Weight,treeplicity(*(treeplideg(),I),Subtree)), treeplimap(I,Rest)).
SYMBOLS
A arc adjustment function to prevent similarity degradation with tree depth N node-equality fraction taken from [0,1]
t (or ti,ort') node-labelled, arc-labelled, arc-weighted tree
li arc label
S(ti, tj) similarity of two trees
si similarity value obtained by S
A(si) application of arc adjustment function A to similarity si wi arc weight for arc label li
TABLES
TABLE 1. Experimental results of the examples in Section 4.1.
FIGURE CAPTIONS FIGURE 1. ACORN-like (Marsh et al. 2003) multi-agent system. FIGURE 2. Structure of an agent.
FIGURE 3. Match-making of buyer and seller agents in a Cafe (adopted from (Marsh et al. 2003)).
FIGURE 4. Leaner and course trees. FIGURE 5. Symbolic tree representations.
FIGURE 6. A standard tree schema for e-Learning.
FIGURE 7. An instance tree generated from the interface in Figure 8. FIGURE 8. A learner interface snapshot inputting the tree in Figure 7. FIGURE 9. Two trees with mismatching leaves.
FIGURE 10. Trees with opposite branch weights. FIGURE 11. Tree pairs only differing in arc weights. FIGURE 12. Tree pairs with left-tree refinement. FIGURE 13. Tree pairs with the same structure.
FIGURE 14. Trees with an increasing number of subtrees.