Publisher’s version / Version de l'éditeur:
Vous avez des questions? Nous pouvons vous aider. Pour communiquer directement avec un auteur, consultez la première page de la revue dans laquelle son article a été publié afin de trouver ses coordonnées. Si vous n’arrivez pas à les repérer, communiquez avec nous à PublicationsArchive-ArchivesPublications@nrc-cnrc.gc.ca. Questions? Contact the NRC Publications Archive team at
PublicationsArchive-ArchivesPublications@nrc-cnrc.gc.ca. If you wish to email the authors directly, please see the first page of the publication for their contact information.
https://publications-cnrc.canada.ca/fra/droits
L’accès à ce site Web et l’utilisation de son contenu sont assujettis aux conditions présentées dans le site LISEZ CES CONDITIONS ATTENTIVEMENT AVANT D’UTILISER CE SITE WEB.
International Workshop on Recording, Modeling and Visualization of Cultural
Heritage [Proceedings], 2005
READ THESE TERMS AND CONDITIONS CAREFULLY BEFORE USING THIS WEBSITE.
https://nrc-publications.canada.ca/eng/copyright
NRC Publications Archive Record / Notice des Archives des publications du CNRC : https://nrc-publications.canada.ca/eng/view/object/?id=3a76edd0-57ca-47ef-8c89-c2278bd1d73e https://publications-cnrc.canada.ca/fra/voir/objet/?id=3a76edd0-57ca-47ef-8c89-c2278bd1d73e
NRC Publications Archive
Archives des publications du CNRC
This publication could be one of several versions: author’s original, accepted manuscript or the publisher’s version. / La version de cette publication peut être l’une des suivantes : la version prépublication de l’auteur, la version acceptée du manuscrit ou la version de l’éditeur.
Access and use of this website and the material on it are subject to the Terms and Conditions set forth at
Ultra-High Resolution Imaging at 50µm using a Portable XYZ-RGB
Color Laser Scanner
Blais, François; Taylor, John; Cournoyer, Luc; Picard, Michel; Borgeat,
Louis; Dicaire, Louis-Guy; Rioux, Marc; Beraldin, Jean-Angelo; Godin, Guy;
Lahnanier, C.; Aitken, G.
National Research Council Canada Institute for Information Technology Conseil national de recherches Canada Institut de technologie de l'information
High Resolution Imaging at 50µm using a
Portable XYZ-RGB Color Laser Scanner *
Blais, F., Taylor, J., Cournoyer, L., Picard, M., Borgeat, L., Dicaire, L.-G.,
Rioux, M., Beraldin, J.-A., Godin, G., Lahnanier, C., and Aitken, G.
May 2005
* published in International Workshop on Recording, Modeling and Visualization of Cultural Heritage. Centro Stefano Franscini, Monte Verita. Ascona, Switzerland. May 22-27, 2005. NRC 48099.
Copyright 2005 by
National Research Council of Canada
Permission is granted to quote short excerpts and to reproduce figures and tables from this report, provided that the source of such material is fully acknowledged.
1 INTRODUCTION
During the years, the Visual Information Technology Group of the National Research Coun-cil of Canada and its collaborators have developed and tested different prototypes of 3D digital laser scanner systems and processing algorithms. They have been applied to a wide variety of applications: robotics, industrial inspection, anthropometry, automation, space, and naturally cultural heritage. The experience gained in testing these applications, from several hundred me-ters underground (mining applications) to more than 200 km above ground (space applications onboard the space shuttle), and from labs environment to operations in France, Israel, Italy, and China, is extremely valuable. Heritage applications have always been an important 3D research activity at NRC, in collaboration with several Canadian Museums as well as international insti-tutions including the “Centre de recherche et de restauration des musées de France” (C2RMF).
The advantages of 3D imaging systems in the field of heritage is now recognized and widely accepted. 3D imaging systems provide an accurate high-resolution three-dimensional digital re-cord of an object that can be used as an archival quality rere-cord and in a variety of related activi-ties including display, conservation, replication, detection of copies, and VR applications. Mu-seum curators, art historians and conservators frequently use a variety of traditional scientific techniques such as X-radiography, infrared photography, ultra-violet fluorescence photography, and multi-spectral analysis for connoisseurship and conservation research examinations on mu-seum collections. 3D imaging of works of art offers a significant new analytical tool to these experts. More precisely, no other method captures the detailed high-resolution recording of the surface relief or 3D structure of the paint layer, brush-stroke details as well as crack pattern formations due to aging. Several research activities around the world are also currently investi-gating ways of integrating these different 2D and 3D datasets with a variety of computer graph-ics tools.
Ultra-High Resolution Imaging at 50 µm using a Portable
XYZ-RGB Color Laser Scanner
F. Blais, J. Taylor, L. Cournoyer, M. Picard, L. Borgeat, L.G. Dicaire, M. Rioux, J.-A. Beraldin, G. Godin
National Research Council Canada, Ottawa, Canada.
C. Lahanier, G. Aitken
Centre de recherche et de restauration des musées de France, Paris, France
ABSTRACT: The objective of this work is to evaluate the performance requirements of a 3D acquisition system for the recording and documentation of paintings. Two laser scanners were tested. A very high-resolution RGB color laser range scanner (range resolution 10 µm) was used to acquire the very fine 3D and color details of the surface of paintings. The second system de-signed for larger volumes had two main roles: to acquire the overall shape of the painting and to track and monitor the position of the high-resolution laser range scanner for global positioning. An evaluation of the results, the advantages and limitations of 3D are presented with a special emphasis on range artifacts, residual errors, system speed and global usefulness of 3D imaging and modeling, from an application perspective.
From a technology point of view, heritage applications offer the benefits of pushing the 3D technology to its limits of resolution while providing direct feedback to developers. Paintings in particular, because of their very limited 3D surface depth but very high surface color details, of-fer serious technological challenges, from acquisition, image resolution, storage, to the display of the results. For instance, any deviation or errors will immediately be amplified and any bias of artifacts in the measurements can lead to erroneous conclusions even though the data are within the normal specifications of the system. It is therefore primordial that the level of accu-racy and precision in any 3D technique be precisely understood. It is also critical to consider 3D from an application point of view and one objective of this paper is to try to answer this ques-tion for paintings.
Scanner specifications are far away from giving a real insight into the actual performance on real objects; for example even the specified -z resolution which is obtained by measuring the deviation from a perfectly flat surface is often artificially improved by smoothing (filtering) which will directly affect the lateral resolution of the system (equivalent to defocusing). This might not be as important for many mechanical parts but is critical for paintings. Other key questions such as depth of focus, bias errors, mechanically induced errors, range artifacts cre-ated by surface or texture discontinuities are also barely discussed. It is the same for errors in-troduced by data manipulation, quantization and aliasing (re-sampling), polygonal mesh, texture mapping, and the display of the data (algorithm and display).
The objective of this work is to validate the application of high-resolution 3D imaging for the recording and documentation of paintings, to better define what should be the specifications of such a 3D system, as well as to obtain 3D data for ongoing research. Two 3D imaging systems research prototypes – the High-Resolution Color Laser Scanner as well as the Large Volume of View or “BigScan” Laser Scanner – were tested in the C2RMF labs in Paris (Louvre) in May 2004. In order to meet the objectives of this project, the High-Resolution Color Laser Scanner system went through an important redesign.
During this visit, four paintings were scanned; they were an anonymous Spanish panel paint-ing Dame en Prière, representative of the Renaissance period (limited depth details and dark contrasted colors), and three oil on canvas paintings by Renoir, Femme Nue Dans un Paysage,
Gabrielle et Jean et Portrait d’un Jeune Homme et d’une Jeune Fille.
Section 2 will present the challenges associated with scanning paintings from an application point of view. Questions such as necessary scanning resolution, acquisition speed, and portabil-ity will be presented. Section 3 will cover the technology and how the two laser scanners were integrated. Sections 4 and 5 will present the results obtained to date with a focus on key techno-logical challenges and the most important sources of residual errors that still affect accuracy. 2 APPLICATION REQUIREMENTS
A large number of possible 3D scanners are available on the market. Blais [2004] presented an overview of different systems available to acquire the 3D shape of objects highlighting some of the advantages and disadvantages of the different methods. With recent advances in technol-ogy, the specification compromises are now mostly imposed by the laws of physics and only a few by technology such as acquisition rate or mechanical components. For example, diffraction limited optics and depth of focus give the maximum lateral resolution of the optical system and not anymore the number of pixel on the CCD/CMOS detector. A comparison of 3D systems based solely on a few specification numbers (e.g. range resolution) must be avoided, more than often leading to erroneous conclusions. A 3D system must be considered as a whole which in-cludes acquisition but also software tools.
Only a few 3D acquisition systems have been tested for the acquisition of the 3D surfaces of paintings. Lahanier [2004] presented scans performed on paintings using a commercial pattern projection 3D camera; results and performances were not disclosed. Guidi [2003] also used a
commercial pattern projection system to detect the overall shape of a painting; high-resolution imaging was not the primary objective. Fontana [2003-2005] developed a system specifically for scanning paintings using a conoscopic micro-profilometer; good depth resolution <6 µm and a maximum acquisition speed of 500 points per second (100 to 400 Hz typical) are reported. Color information is recorded separately and software registered.
A good survey of previous work done at NRC using the color auto-synchronized 3D laser scanner is presented in Taylor [2003]. This original system was also tested to acquire high-resolution surface texture and signatures of Rembrandt and Corot paintings. The results demon-strated the potential of the technology for scanning paintings. A few practical limitations were also highlighted. The 3D camera was mounted on a gantry type structure which was necessary to guaranty rigidity and accuracy in the measurements but making it non-portable. Also the paintings were laid down horizontally under the 3D scanner which increased the potential risk of damage. Acquisition speed and overhead time (setup, data storage and transfer, communica-tion, system tuning) were also limiting factors that needed improvements for portable operation on a remote site. From these experiments, the following technological requirements were identi-fied:
• Portability: previous experiments required bringing the painting to the lab which in many cases is unacceptable. Portability also implies that the environment where the scans will be performed will be far from ideal; portability must not hinder accuracy. Scans will be performed in sections to reduce the overall size of the equipment and to compromise be-tween weight, rigidity, stability and accuracy of the mechanical structure. Environmental constraints (external vibrations, temperature, air turbulence, and atmospheric pressure) must be semi-controlled to guaranty global accuracy in the measurements.
• Spatial resolution: previous experiments showed that in order to detect brush strokes de-tails and small cracks, image resolution must be within 50 µm to 80 µm (the diameter of the human air is typically 80 µm). The laser spot should not exceed 100 µm in diameter to match the Nyquist criteria. Consequently the laser camera head must be at all times mechanically positioned within the operating depth of focus taking also into considera-tion a possible warping of the painting surface (e.g. wood panels).
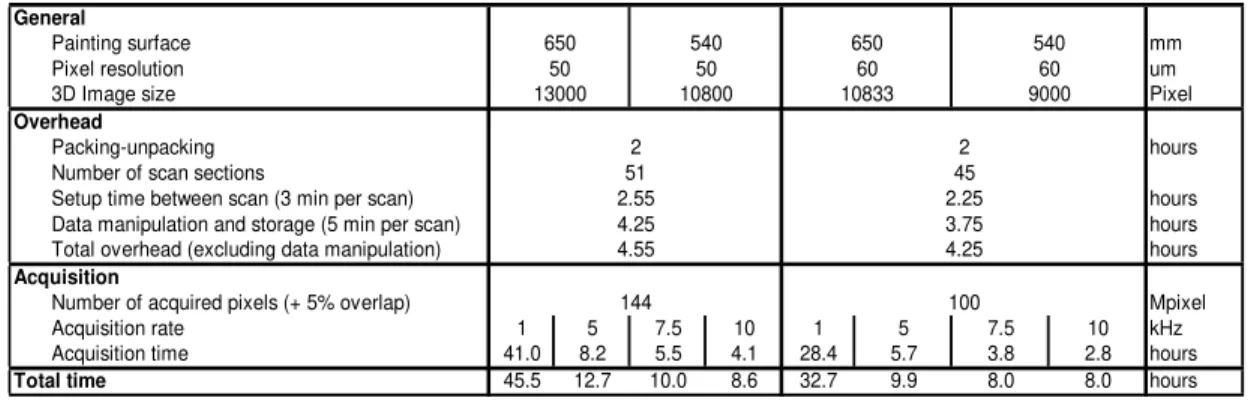
• Image size: assuming that the painting surface is 65 cm × 54 cm (e.g. the Renoir), a 50 µm resolution will produce an image of 13000 × 10800 pixels (137 MPixels). Handling such a big image is problematic in real-time, from acquisition, data storage, calibration to the display of large datasets.
• Real-time processing constraints: overhead operations such as setup, data transfer and modeling must be done in parallel to scanning in order to minimize the setup times and to verify the quality of the measurements at the same time they are acquired. Data manipula-tion must not disturb the 3D acquisimanipula-tion (computer real-time multitasking and communi-cation constraints).
• Total acquisition and processing time: practical constraints imposed by the “normal op-erations” of museums also imply that a complete scan should preferably be completed within a predefined period of time (e.g. when the museum is closed to public), and to minimize human factors (e.g. fatigue). It is assumed that the equipment must not be left unsupervised for obvious reasons.
Table 1 illustrates the total time required to perform a scan at four acquisition rates: 1 kHz, 5 kHz, 7.5 kHz and 10 kHz. The normal operation speed for the NRC Color Laser Scanner varies between 10 kHz and 7.5 kHz (high sensitivity mode). Table 1 also shows that other factors such as setup and data manipulation are far from being negligible. For example, the overhead is rela-tively negligible at 1 kHz but it is an important percentage of the total scanning time at 10 kHz and therefore is worth optimizing. Another interesting element is the data storage and data ma-nipulation, 4 hours are not important if done at the same time the system is acquiring the 3D data but may double the total acquisition time if it can’t be done simultaneously. The total ac-quisition time of 8 to 9 hours is acceptable and can be completed within the “normal operations” of a museum which will not be the case at 1 kHz where it will take more than a week. To in-crease the speed of acquisition to 100 kHz for example is not yet justified; data processing and
General
Painting surface mm
Pixel resolution um
3D Image size Pixel
Overhead
Packing-unpacking hours
Number of scan sections
Setup time between scan (3 min per scan) hours
Data manipulation and storage (5 min per scan) hours
Total overhead (excluding data manipulation) hours
Acquisition
Number of acquired pixels (+ 5% overlap) Mpixel
Acquisition rate 1 5 7.5 10 1 5 7.5 10 kHz
Acquisition time 41.0 8.2 5.5 4.1 28.4 5.7 3.8 2.8 hours
Total time 45.5 12.7 10.0 8.6 32.7 9.9 8.0 8.0 hours 4.25 100 2 45 2.25 3.75 650 50 13000 650 540 60 60 10833 9000 144 2 51 2.55 4.25 4.55 540 50 10800
manipulations will take much longer. It is interesting to note that from a practical point of view many potential solutions might no longer be valid.
3 THE NRC 3D TECHNOLOGY
One of the systems, the High Resolution Color Laser Scanner, used for this project, has been developed for the simultaneous digitization of the shape and color of paintings and museum ob-jects. Figure 1 illustrates the principle of operation. The system scans a small (less than 100 µm diameter) “white” laser spot from a RGB (red, green, blue) laser source over the surface of the painting (Figure 2). The three lasers are combined into a single mode optical fiber, projected on the object, and imaged by a linear CCD where the three color components are split using a prism. The well known principle of optical triangulation is used.
Figure 1: Color optical triangulation principle. Figure 2: Prototype of the laser scanner system.
The scanner head is mounted on a very accurate translation stage to scan small sections of 4 cm × 20 cm of the painting (Figures 3 and 4). The translation stage is itself mounted on rigid tripods. The triangulation based detection system simultaneously records the shape (x,y,z) measurements and the color (R,G,B) reflectance from the spot on the painting in perfect registra-tion.
In the resolution configuration used for this experiment, the system provides a lateral spatial (x and y) resolution between 50 to 60 µm and a depth uncertainty of 10 µm on flat surfaces. As
Table 1: Example of time requirements for a portable 3D acquisition system (best case).
R G B Las e r CCD Lens Color separation prism Red Green Blue γ D ept h of fo cus Z D Zmin Zmax
mentioned above, one of the objectives of this research is to verify if this resolution is sufficient to record brush stroke details as well as to examine, measure and compare craquelures and other surface features. The system has been reengineered to meet the objectives specified in section 2 and to allow ‘true’ real-time multitasking operation. A 5× gain in speed was obtained (10× in-cluding overhead). Because of time constraints imposed by Table 1, the scans were performed at 60 µm. The scanners and system control setup used to scan the paintings at the C2RMF is illus-trated in Figures 3 and 4.
Figure 3: The 6 DOF positioning of the High-Resolution Color System (foreground) is monitored in real-time by the large volume system (background). Bottom-left Lissajous tracking pattern on the sphere.
Figure 4: The tracking system monitors the po-sition of the painting and automatically gener-ates a grid pattern. Each grid accurately indi-cates the sections to be scanned to minimize the overlay. The tracking system also records the overall shape of the painting to a resolution of 200 µm.
The second scanner used in this project was the Large Volume of View or “Big Scan” Laser Scanner. This system is also a triangulation based scanner which uses a monochrome green laser for the rapid digitization of larger objects. The main task for this scanner was to record the over-all shape of the paintings to monitor dimensional changes and features such as warping or dis-tortion of panel paintings. The maximum –z resolution used for this project was 100 µm and the lateral spatial (x and y) resolution was 200 µm. This scanner was also used to monitor the loca-tion of the high-resoluloca-tion color camera relative to the painting and the orientaloca-tion of the scan-ner with respect to the linear translation stage. This was accomplished by tracking in 3D the white spheres mounted on the color camera as illustrated in Figure 3 (bottom-left).
The Large Volume laser scanner was also programmed to project optical laser markers on the surface of painting to help define each 4 cm × 20 cm sub-sections as shown on Figure 4. Optical markers were found necessary to help the operator positioning the camera in front of the paint-ing within a tolerance of 2 mm (5% of overlap of a 4 cm scan). Movpaint-ing the tripods in Figure 3 was found difficult (we have since modified this configuration). Although this solution seems a-priori over kill, the accuracy and the simplicity and re-configurability were a definite advantage in this first experiment. Alternative solutions are currently being investigated such as low cost cross-laser markers
Each 3D scan was automatically transferred in real-time to a host Windows based computer for calibration, data manipulation and pre-registration, to verify the quality of the dataset and to guaranty that all the images had sufficient overlap for proper registration, using the
Poly-worksTM suite of software tools and within the time frame specified in Table 1. Real-time
dis-play of images and signal profiles, to adjust laser power, to optimize the range and orientation of the 3D camera, and to provide an immediate feedback from the modeling task, is imperative.
4 PRELIMINARY RESULTS
The color Figures 8 to 11 detail images of the 3D models data and of selected sections that il-lustrate some preliminary results on the type of image data recorded on the paintings during this work. It is important to note that the complete paintings were digitized at high-resolution; mod-eling and archival quality 3D image files of such large datasets of the paintings are still the sub-ject of continuous research. For example, a unique feature of optical sensing technology for the examination of paintings with varnished surfaces is that the shape data recorded by the scanner originates from the immediate surface of the paint layer, under the varnish, rather than from the varnish surface. This results in a detailed high-resolution recording of the surface relief or 3D structure of the paint layer from brush stroke details as well as craquelure formations due to ag-ing. No other technique (other than optical) captures this type of information. However the ef-fects due to change of index of refraction of the varnish are still the subject of investigation; the real-surface of the painting will be closer depending on the angle of incidence of the laser light and of the thickness of the varnish layer. The effects of light penetration inside the paint layer(s), similar to marble surface (Godin [2001]) are still under investigation.
The following was observed:
• Of particular importance are the acquisition setup-up and how the equipment is used. Many errors are human generated and these errors are difficult or impossible to correct afterward. We found that repetitive manipulations can quickly lead to errors if not quickly detected by pre-processing the data at the same time they are acquired.
• An accuracy of 100 µm seems sufficient to acquire the overall shape of the painting. A lateral resolution of 50 µm is sufficient to detect most important details. The craquelure pattern is easily measured as well as surface defects such as chips and imperfections. The wood grain is also accurately measured on wood panels.
• The very fine details (<5 µm) produce global changes in the range image that although not detectable using computer software, are perceived by the human brain. This is par-ticular exaggerated with low grazing incident illumination which amplifies the noise as well. These measurements are of the same magnitude as some other sources of errors such as range artifacts, mechanically induced errors, or simply noise and therefore must be analyzed with great care.
• Other sources of errors were also observed. With canvas painting for example, the air turbulence created by the displacement of a person inside the room or simply by opening a door located 5m from the painting was sufficient to generate small oscillations in the surface of the painting. These small localized burst of oscillations of a few Hertz were later removed using notch filtering methods. This correction was possible only because the acquisition rate is much higher than the oscillations; this will be difficult to correct at 1 kHz for example.
Human factors, display, and interpretation of the image are also extremely important elements still open to debate. Because of the low range variations in the painting surface, temptation is great to increase the contrast or to use almost horizontal grazing illumination that amplifies noise and artifacts. The human brain automatically detects these details (an analogy – the “red eyes” in a color picture, only a few pixels in a 5Mpixels image but is the first element that we automatically detect). Furthermore, because of the size of the image files, resampling is also of-ten performed which will lead to aliasing errors in the image if improperly done.
5 SYSTEM ERRORS AND FUTURE DISCUSSION
In this section we cover only the most important sources of errors that can affect the accuracy of a portable 3D optical system. More than often these sources of errors are not visible but be-cause of the flatness of paintings, a surface feature to be visible can be over-amplified by using extremely low grazing incident illumination display (shading) or highly contrasted images, this will also amplify the system errors and can potentially create bias or patterns on the object (e.g. waves). The systematic system errors are most of the time within the specified accuracy of the
3D system (<10 µm) but because the human brain is extremely good at detecting patterns, they can easily be interpreted as originating from the painting rather than from systematic errors.
There are no clear answers to this fundamental question and interpretation of the 3D image data is still open to debate. Basically we can easily say that if the range variation is >10 µm (and range artifacts have been compensated) then the feature is originating from the painting. If the visible feature is <10 µm, then the range variations may or may not originate from the painting, closer scrutiny is needed.
This section will attempt to highlight the most important source of errors that can create arte-facts (<10 µm), to help interpreting the 3D data. The following discussion applies to most type of 3D systems. Of particular importance are stability and repeatability which are absolute re-quirements for proper calibration and possible software compensation, and to guaranty accurate alignment of multiple image patches.
5.1 Mechanical Errors – Linear Translation
Electromechanical positioners are one of the most limiting factors for an accurate portable system, mostly because of their weight and cost. There are many factors that affect the capabili-ties of a linear stage to position accurately in three-dimensional space. Abbe errors, straightness, flatness, pitch, roll, yaw, hysteresis, backlash, orthogonal alignment, encoder errors, mounting surface, and cantilevered loading all contribute to positioning errors in three-dimensional space. Figure 5 illustrates the most common errors; a particular attention must be given to Abbe errors where small angular errors can create large positioning errors because of cantilever effects. Many of these errors will not show on a single scan but they will be obvious when stitching the different sections of the model; errors will accumulate.
5.2 Laser Focus and Depth of Focus
The object surface must be at the best possible focus position in order to obtain the best quality image; random noise on the 3D data will increase with defocusing. To obtain such small resolu-tion, depth of focus is very small, specified by the numerical aperture of the focusing lens. In the case of a pattern projection system, the depth of focus is a combination of both the projector lens and the camera imaging lens and is usually smaller than for laser systems. With color sys-tems and because of chromatic aberrations only the best quality lens can be used.
In the case of Figure 4, the laser scanner orientation and position was adjusted such that the sur-face of the painting is always inside the “best focus range” (±1 cm). This operation proved to be critical and difficult to adjust. From this experiment, important but simple modifications have been introduced to the mechanical design that greatly simplify this task reducing the setup time of Table 1 from 3 minutes per section to 1 minute on average.
5.3 Laser Surface Penetration
Surface penetration is an important subject that is still barely explored. Godin [2001] studied the problem of laser penetration in marble. Figure 6 shows the effect of surface penetration in the case of a semi-transparent surface where a percentage of the light is reflected at different depth. Change in the optical path depends on the index of refraction of the material (e.g. var-nish) but also on the coefficient of absorption within the material and should be different for the three wavelengths of the RGB laser source. In the simplified case of a transparent surface (e.g. clear varnish) the net effect is a constant shift in the measurement (surface appears closer to the camera). The measured surface will be constraint by zpaint ≤ zmeasured ≤ zvarnish. This subject is still unexplored.
Exp ect ed c en troid Me asu red ce ntro id 5.4 Detector noise
The measurement of the centroid of equation 1 can be affected by various sources of noise (Blais [1986]): the size of the laser spot, the ambient noise (e.g. electrical), quantization noise in the analog to digital conversion, and the geometry of the CCD pixels (e.g. inter-pixel gaps). The use of multiple colors almost nullifies the effect of the geometry of the CCD on range inaccu-racy. The other source of noise will however be amplified by grazing illumination and will
modify the texture of the display of the surfaces. This random noise is of high frequency and depends mostly on the SNR of the combined detector and A/D converters and will increase with low power returned laser signal (dark surfaces). The net effect is in an apparent change of granularity (texture) for dark surfaces
5.5 Range artifacts
Range artifacts are rarely discussed, only the basic pin-hole/single ray models (perfect focus) is used in papers. Range artifacts created by range discontinuities have been the subject of stud-ies in the mid 80s and a few methods have been proposed (Buzinski [1992], other references can also be found in Blais [2004]). Because of the difficulty of the task, these studies are still at their embryonic stages and a good solution has yet to be found. Range artifacts compensation is a complex problem of deconvolution and as such is ill-conditioned. Range artifacts are induced by a shift in the measurement of the centroid of the imaged laser spot from a perfect surface as illustrated in Figure 7. Range artifacts are directly linked to the capabilities of the optical sys-tem to resolve the illuminated point on the object (Nyquist criteria).
5.5.1 Range discontinuities
Figure 7 illustrates the effect of a shift in the centroid computation of the laser beam. This shift can occur if the object is smaller than the size of the laser beam or on edges (Figure 7a). Rather than imaging the full Gaussian laser beam profile, only a section of it is captured creat-ing a shift in the centroid position on the detector and consequently a variation in range. Assum-ing the center of mass is computed, from Figure 7a this shift is:
(1)
where x0 and x1 corresponds to transitions and xo is the expected centroid of the laser spot. As-suming we have γ=10 deg and that the only ½ of a 100 µm laser spot is imaged, then a centroid shift ∆x = 20 µm can produce a very large range error ∆z= 100 µm. Depending on the direction of the triangulation/scan either the range error will procude either smoother edges or bumps in
Figure 5: Errors originating from a linear transla-tion stage. Roll in particular is a very important
source of error. Figure 6: The effect of surface penetration on the laser spot: size and coma distortion.
∫
∫
⎟⎠ ⎞ ⎜ ⎝ ⎛ − − ⎟ ⎠ ⎞ ⎜ ⎝ ⎛ − − ⋅ ⋅ ⋅ = ∆ 1 0 2 1 0 1 0 2 1 0 2 2 x x xo x x x xo x e I e x I x σ σ ∆z=∆xtan( )
γ( )
∫
⎟⎠ ⎞ ⎜ ⎝ ⎛ − − ⋅ ⋅ = ∆ 1 0 2 1 2 1 x x xo x RGB e x x I I x σ Centroid shift ∆X γ Exp ect ed ce ntr oid Me asu red ce ntr oid Range error ∆ Z Not visible Measured range profile Real range profile Z Xthe range image. From Equation 1 increasing the triangulation base, for example γ=30 deg, will reduce range artifacts to ∆z= 30 µm. Another possibility is to compensate this error using signal processing as it will be discussed in the next section.
This problem is more complex in the case of a 3D pattern projection system and imaging camera. Because of pixel size, the exact centroid of a point can be shifted depending where it lies within a CCD pixel. Range artifact will be further amplified if the image on the CCD detec-tor is out of focus; a point spot on the object surface will cover several pixels. Furthermore the Bayer color filter (green-red-blue-green) that is normally used on CCD or CMOS camera can also create range artifacts on discontinuities.
5.5.2 Texture and color (intensity) discontinuities
Equation 1 can be generalized to surface artifacts created by a change in color texture or more specifically a change in reflectivity (intensity variations) as illustrated in Figure 7b. The phe-nomena is similar to range discontinuities except that in this case equation 1 is rewritten as
(2)
where I(x) is the intensity profile and IRGB is the color measurement from the laser scanner. As it is the case for range discontinuities, intensity artifacts will produce either a bump or a valley in the range data. A simple way to verify if a given range sensor procudes range artifacts (black and white letters for example) is to rotate the surface by 180 deg and to compare the two im-ages. The average should be close (but not yet 100% perfect) to the real object surface. Obvi-ously their differences will be range artifacts. This solution will unfortunately double the total acquisition time. Another optical solution is to use a dual-triangulation system (Blais [2004]), or to compensate the data by software.
Figure 12 shows the right eye of the “Dame en prière” zoomed to highlight the details of range artifacts. The small bumps in the shaded range image are created by color discontinuities in the eye, also seen in Figure 8. The shape of these bumps is identical to the profile deviation illustrated in Figure 7. The artifact compensation algorithm we are currently investigating con-sists of a deconvolution of equation 2 to find the best estimate I(x), the reference xo, and the size of the spot σ, knowing the intensity measurement IRGB. The problem is complicated by the fact that the size of the laser spot σ depends on the range, scanning angle, and object texture (pene-tration in the material). Our current results show that the worst case error is reduced by 5× to 10× therefore producing a typical maximum error ∆z ~10 µm for a light/no-light transition (e.g.
saturation). However most color variations are within a range of 0.01 ≤ I(x) ≤≤ 1.0 and
maximum range error seems to be within 2 µm to 5 µm (Figure 12).
a) b)
Figure 7: (a) Range artifact created by a shift in the centroid of the laser spot due to a step discontinuity (b) Range artifact created by a shift in the centroid of the laser spot due to color variations (intensity dis-continuity) in the surface of the object.
( )
∫
⎟⎠ ⎞ ⎜ ⎝ ⎛ − − ⋅ = 1 0 2 1 2 x x xo x RGB I x e I σ Measured range profile Real range profile X Centroid shift X6 CONCLUSION
In this paper we have addressed the 3D acquisition of paintings from an application point of view. The practical limits imposed by portability, resolution, acquisition time, overhead, and operational constraints were analyzed from a practical point of view. The key system perform-ances were developed, our laser scanner prototype modified and tested by acquiring the shape of four paintings considered “typical”. The final key question: “are these specifications suffi-cient?” is still under investigation.
We found that a lateral resolution of 50 µm to 60 µm seems sufficient to properly acquire the color surface details. To improve the lateral resolution (e.g. 25 µm) will slow down the total ac-quisition time by 4× and might not be practical unless both data analysis and detection perform-ances are simultaneously improved. This work has also demonstrated that it is imperative to analyze the 3D data and to do image pre-alignment at the same time the data are acquired. It was also demonstrated that overhead is a very important time consuming aspect of the application. The 10 µm range resolution seemed to be sufficient for the accurate analysis of the Renoir paint-ings which exhibit higher surface relief (~mm). In the case of the Renaissance period the
ex-tremely smooth painting techniques used in the 16th century creates very low surface details and
at the same time very high sharp contrasted colors (dark-bright colors). Most of the important surface details (>10 µm) are easily measured. However in order to display the very faint surface relief (<10 µm) such as possible finger prints or even brush strokes, the settings of the display or image processing must be over-exaggerated which also amplifies range artifacts, noise, and other residual errors from the 3D system. We have developed compensation models to remove the very small mechanical oscillations due to vibrations and to reduce the effects of air turbu-lence. Furthermore a first version of range artifact deconvolution greatly reduced range artifacts to within 2-5 µm. The residual errors are well within the 10 µm range resolution of the system but can still be potentially detected by the human eye which can lead to erroneous conclusions if not properly or “hastily” investigated. The type of software tools that can be developed to help in analyzing the data is still to be determined.
7 REFERENCES
Blais, F. “A Review of 20 Years of Range Sensor Development” Journal of Electronic Imaging, 13(1): 231-240. January 2004.
Blais, F., Rioux, M., “Real-Time Numerical Peak Detector”, Signal Processing, 11 : 145-155, 1986. Businski, M., Levine, A., Stevenson, W.H., “Performance characteristics of range sensors utilizing
opit-cal triangulation”, IEEE National Aerospace and Electronics Conference, 1992, 1230-1236.
Fontana, R., Gambino, M.C., Greco M., Marras, L., Pampaloni, E., Pelagotti, A., Pezzati, L. Poggi, P., “2D imaging and 3D sensing data acquisition and mutual registration for painting conservation”, Videometrics VIII, Proc. SPIE, Vol. 5665, Jan. 12-20, 2005, pp. 51-58.
Fontana, R., Gambino, M.C., Greco M., Marras, L., Materazzi, M., Pampaloni, E., Pezzati, L. Poggi, P., “Integrating 2D and 3D data for diagnostics of panel paintings”, Optical Metrology for Arts and Mul-timedia, SPIE, Vol. 5146, June 25-26, 2003, pp. 88-96.
Godin, G., Rioux, M., Beraldin, J.-A., Levoy, M., Cournoyer, L., “An Assessment of Laser Range Meas-urement of Marble Surfaces”, Proceedings of the 5th Conference on Optical 3-D MeasMeas-urement Tech-niques, Vienna, Austria. October 1-4, 2001. pp. 49-56.
Guidi, G., Atzeni, C., Lazzari, S., “3D optical scanning diagnostics for Leonardo Da Vinci’s ’Adorazi-one dei Magi’ conservation”, Proceedings of the 4th International Conference on 3-D Digital Imaging and Modeling (3DIM2003), Banff, Alberta, Canada, October 6-10, 2003.
Lahanier, C., Aitken, G., Taylor, J., Blais, F., Borgeat, L., Beraldin J.-A., Rioux, M., Breuckmann. B., Colantoni, P., Cournoyer, L., De Deyne, C., Picard, M., Pillay, R., Godin, G., “The 2D multi-spectral digitisation and the 3D modelling of easel paintings”, to be presented, ICOM-CC, 14th Triennal
Meet-ing ICOM-CC, 12-16 Sept. 2005, The Hague, The Netherlands.
Taylor, J., Beraldin, J.-A., Godin, G., Cournoyer, L., Baribeau, R., Blais, F., Rioux, M., Domey, J., “NRC 3D Technology for Museum and Heritage Applications,” The Journal of Visualization and Computer Animation, 14:(3), 2003.
Titre : Dame en Prière Artiste: ANONYME École: Espagne Date: 1575 – 1599 Matérial: bois
Technique: peinture à l’huile Dimensions: 310 x 215 mm Propriétaire: Musée du Louvre C2RMF reference: F11823 Numero d’inventaire: RF 2090
a)
b) c)
Figure 8: Detail of face scanned at a lateral resolution of 50 microns. (a) Color image showing craquelure formation. (b & c) Shaded monochrome image of same area showing brush stoke details of eyes, mouth and craquelure. Light sphere indicates direction of light source. Range artifacts are not compensated (see Figure 12). (to be reproduced in color)
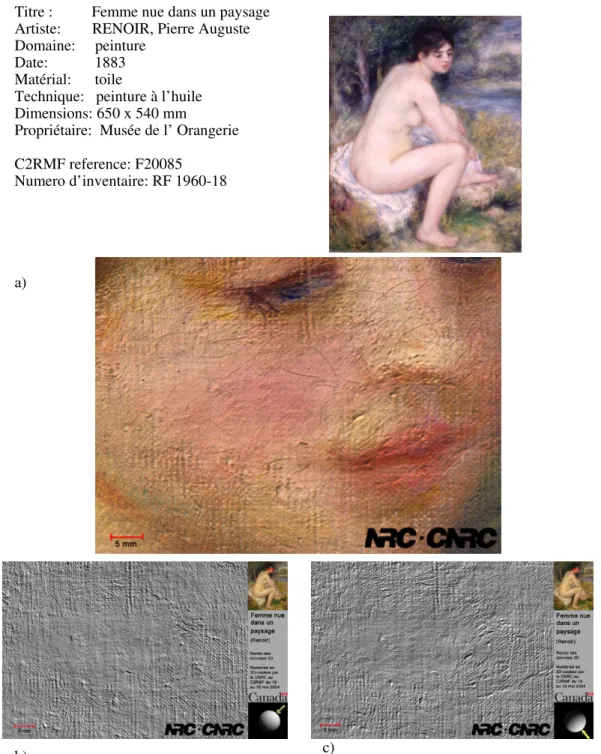
Titre : Femme nue dans un paysage Artiste: RENOIR, Pierre Auguste Domaine: peinture
Date: 1883 Matérial: toile
Technique: peinture à l’huile Dimensions: 650 x 540 mm
Propriétaire: Musée de l’ Orangerie C2RMF reference: F20085
Numero d’inventaire: RF 1960-18
a)
b) c)
Figure 9: Detail of face area scanned at a lateral resolution of 50 microns. (a) Color image showing craquelure formation. (b & c) Shaded monochrome image of same area showing craquelure and canvas relief due to thin paint layer. Light sphere indicates direction of light source. (to be reproduced in color) .
Titre : Gabrielle et Jean
Artiste: RENOIR, Pierre Auguste Domaine: peinture
Date: 1895 - 1896 Matérial: toile
Technique: peinture à l’huile Dimensions: 650 x 540 mm
Propriétaire: Musée de l’ Orangerie C2RMF reference: F20028
Numero d’inventaire: RF 1963-13
a)
b) c)
Figure 10: Detail of chin and shoulder area of Jean scanned at a lateral resolution of 50 microns. (a) Color image showing brush stroke formation. (b) Shaded monochrome image of same area showing en-hanced brush stroke details. Light sphere indicates direction of light source. (to be reproduced in color)
Titre : Portrait d’un jeune homme et d’une jeune fille
Artiste: RENOIR, Pierre Auguste Domaine: peinture
Date: 1875 - 1880 Matérial: toile
Technique: peinture à l’huile Dimensions: 320 x 460 mm
Propriétaire: Musée de l’ Orangerie C2RMF reference: F19274
Numero d’inventaire: RF 1963-24
a)
b)
Figure 11: (a) Detail illustrating tool to measure profile of surface elevation of paint layer across red line (b) Measurement profile of width and depth of crack across red line. (to be reproduced in color)
a)
b)
Figure 12: (a) Range artifact created by a sharp intensity transition (Figure 8, right-eye of Dame en prière), (b) initial results from the compensation algorithm. (to be reproduced in color)