Publisher’s version / Version de l'éditeur:
Vous avez des questions? Nous pouvons vous aider. Pour communiquer directement avec un auteur, consultez la première page de la revue dans laquelle son article a été publié afin de trouver ses coordonnées. Si vous n’arrivez pas à les repérer, communiquez avec nous à [email protected].
Questions? Contact the NRC Publications Archive team at
[email protected]. If you wish to email the authors directly, please see the first page of the publication for their contact information.
https://publications-cnrc.canada.ca/fra/droits
L’accès à ce site Web et l’utilisation de son contenu sont assujettis aux conditions présentées dans le site LISEZ CES CONDITIONS ATTENTIVEMENT AVANT D’UTILISER CE SITE WEB.
Student Report (National Research Council of Canada. Institute for Ocean Technology); no. SR-2005-18, 2005
READ THESE TERMS AND CONDITIONS CAREFULLY BEFORE USING THIS WEBSITE.
https://nrc-publications.canada.ca/eng/copyright
NRC Publications Archive Record / Notice des Archives des publications du CNRC :
https://nrc-publications.canada.ca/eng/view/object/?id=7e84e9bf-1aa9-4bb4-8d49-761a71438ca0 https://publications-cnrc.canada.ca/fra/voir/objet/?id=7e84e9bf-1aa9-4bb4-8d49-761a71438ca0
NRC Publications Archive
Archives des publications du CNRC
For the publisher’s version, please access the DOI link below./ Pour consulter la version de l’éditeur, utilisez le lien DOI ci-dessous.
https://doi.org/10.4224/8895229
Access and use of this website and the material on it are subject to the Terms and Conditions set forth at
MK ll medium gimbal side-pull experiment
National Research Council Conseil national de recherches Canada Canada Institute for Ocean Institut des technologies
Technology océaniques
MK II MEDIUM GIMBAL SIDE-PULL EXPERIMENT
SR-2005-18
Tim Osmond
ABSTRACT
The new yaw resistant Mk II Medium Gimbal was tested throughout May 2005. An experiment
was conducted to quantify the adverse effects of side force on the internal load cell in the
gimbal. Side force was applied both through the centerline of the gimbal with respect to the
z-axis and in moment to the gimbal both forward and rearward. Side forces of between 0 and 55
lbs were applied to the gimbal as the gimbal was experiencing rearward forces (drag forces)
ranging between 0 and 300 lbs. This experiment demonstrated that there was on average
0.0139 lbs of absolute error added to the internal load cell with the addition of each pound of
side force. Applying side force 6 inches rearward and forward of center, 0.0148 lbs and
0.0155 lbs respectively, of absolute error are added, on average for every pound of side force
applied. This amounts to on average 0.76, 0.82 and 0.85 lbs of error added in the center,
TABLE OF CONTENTS 1.0 INTRODUCTION...1 2.0 EXPERIMENT OBJECTIVE ...1 3.0 EXPERIMENTAL FACILITY...1 4.0 PROCEDURE ...2 5.0 RESULTS...3 6.0 DISCUSSION...5 7.0 CONCLUSIONS ...6 8.0 FIGURES ...7
Figure 1 – Mk II Medium Gimbal... 7
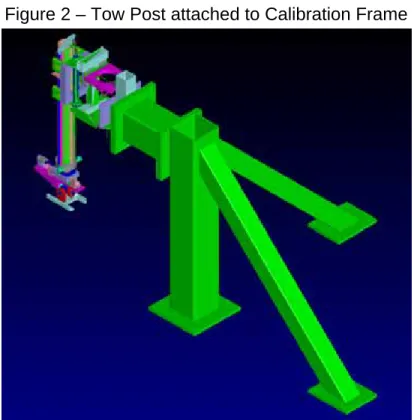
Figure 2 – Tow Post attached to Calibration Frame ... 7
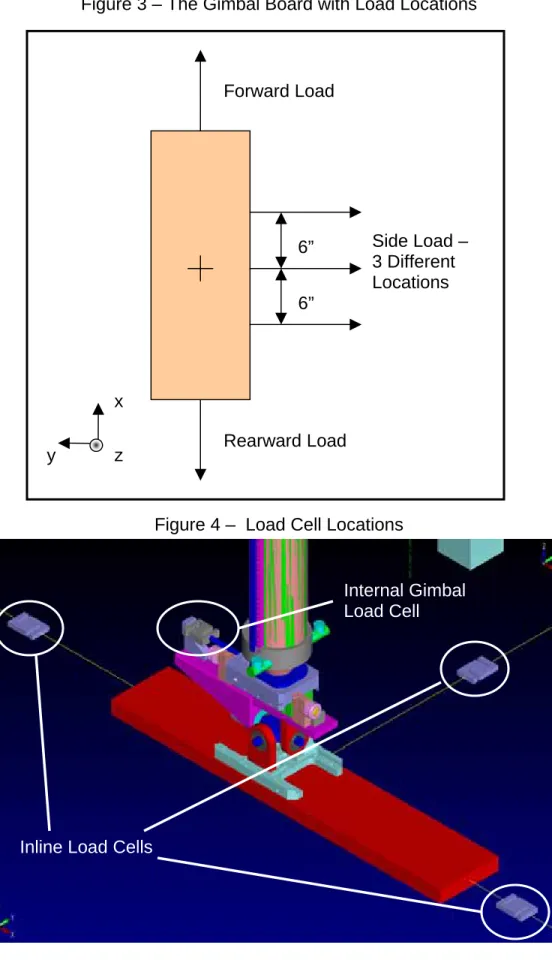
Figure 3 – The Gimbal Board with Load Locations... 8
Figure 4 – Load Cell Locations ... 8
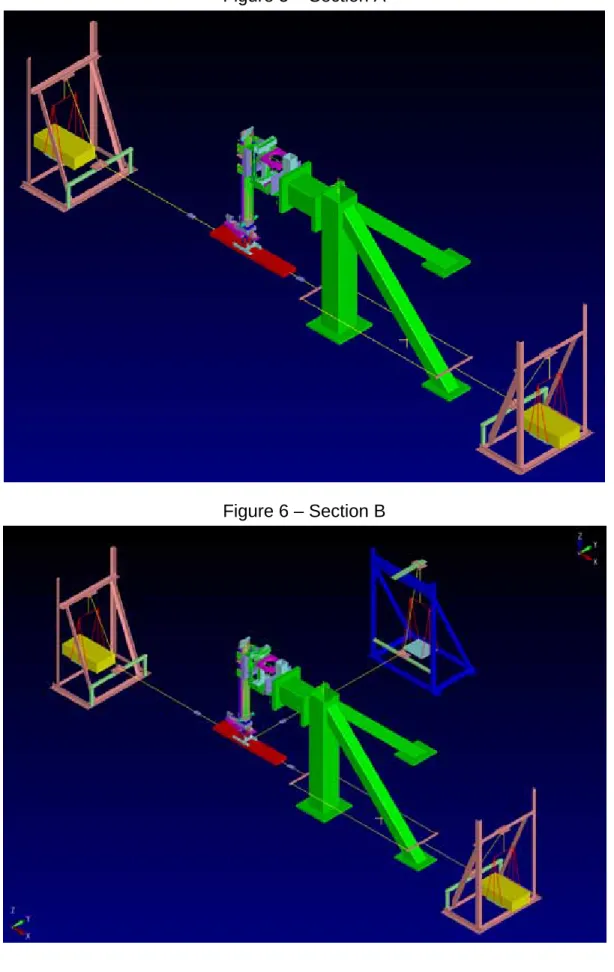
Figure 5 – Section A ... 9
Figure 6 – Section B ... 9
APPENDIX A: SECTION A RESULTS
1.0 INTRODUCTION
Within IOT a new yaw restrained tow post and Mk II medium gimbal have been designed and fabricated (for further details regarding this equipment see the Mk II Medium Gimbal Yaw Restrained Tow Post design manual, June 15, 2004). Before this new equipment may be issued for use, it must be tested to ensure that it operates to theoretical expectations and where it does not, tests must determine the extent to which there is deviation. A side pull experiment was conducted with the new Mk II medium gimbal throughout May 2005 as part of an effort to make these determinations. This report is assembled to present findings of this side pull experiment.
2.0 EXPERIMENT OBJECTIVE
The Mk II medium gimbal is outfitted with an internal load cell that may be interchanged from 50 lbs, 100 lbs and 300 lbs. It is intended to measure model drag and reverse drag only and should not be affected by side forces applied through the center axis or in moment about the z-axis with the gimbal.
This experiment was designed to determine the extent to which, if any, side force interferes with readings from the internal load cell in the medium gimbal. To make this determination there were two sections in this experiment referred to as Section A and Section B.
The objective (Objective A1) of section A was to determine the internal load cells deviation from theoretical expectations without side force applied.
There were two objectives in section B. The first object (Objective B1) was to apply a perpendicular load to the gimbal without moment and determine the effects on the gimbal internal load cell. The second objective (Objective B2) was to apply both side force and moment to the gimbal to quantify the effect on the gimbal internal load cell.
All side forces applied were applied perpendicular to the x-axis with respect to the gimbal. Side forces were applied through the neutral point on the x-axis of the gimbal as well as 6 inches in the positive x direction and 6 inches in the negative x direction. (see figure 1)
3.0 EXPERIMENTAL FACILITY
To conduct the necessary pulls to accomplish objectives A1, B1 and B2 the gimbal needed to be free to experience forward and rearward loads as well as side loads without undergoing pitch or roll. To accomplish this the gimbal was suspended attached to the bottom of the tow post. The pitch-lock plate was attached to the gimbal. This prevented the gimbal from both pitch and rolling.
The tow post was bolted to the calibration frame found in the prep shop of the Institute for Ocean Technology. (see figure 2)
A gimbal board was fabricated that contained the necessary features to allow the gimbal to be bolted to the board and allow cables be attached to the front and the rear of the boards as well as several locations on the side of the board. (see figure 3)
Cables, pull frames, weigh pans and pulleys were used to apply loads to the board.
In-line load cells were used to measure the loads applied to the gimbal board through each cable (see figure 4). A 300 lbs load cell was used as the gimbal internal load cell for this experiment.
A Data Acquisition System (DAS) measured the output from each load cell.
4.0 PROCEDURE
All experimental facility components were located (c-clamps, pulleys, pull frames, load cells and shackles) or fabricated (pulley plates, pull frame bars, cables, the gimbal board and the calibration frame bridal).
All load cells were manually calibrated. Known weights were hung from the load cells and the voltages were recorded using the DAS. This data was implemented into an excel chart and a trend line was used to generate the slope equation (the equation is of the form mX + b). This equation was entered into the DAS and the zero intercept (b value) was the determined based on the load cell reading while undergoing 0 load. A load cell undergoing 0 load is considered to be a load cell lying in a horizontal position with nothing attached.
The experimental facility was fully assembled as described above. A 300 lbs load cell was used for the rear load cell (positive drag) and for the internal gimbal load cell. A 100 lbs load cell was used for forward load (negative drag) and for the side load cell (see load cell
locations, figure 4).
This experiment was composed of two sections. Section A was intended to determined the error in the gimbal before any side load was applied. Section B was intended to determine the error in the gimbal after the side load was applied.
Section A (see figure 5)
Load cell readings were manually recorded with the application of each load. A preload
tension was applied to the forward and rearward load cell. A net forward load of approximately 20 lbs was applied to the gimbal. From this point the rearward load was incrementally
increased until a net rearward load of approximately 270 lbs was reached. This was repeated three times. The differences between the forward and rearward load cells are used to produce a theoretical load values for the internal gimbal load cell.
Section B (see figure 6)
The front, rear and side cables were preloaded. The side pull cable was attached to the center connection point of the gimbal board. Load cell readings were taken at every load addition. A random load was applied in the rearward direction to the gimbal. At this rearward load, side
loads were randomly increased in six increments to approximately 55 lbs. This was then repeated using different incremental loads. The rearward load was then increased and the process of loading the side pull was repeated. The process of increasing the rearward load was repeated until there was a net rearward load on the gimbal of approximately 280 lbs. To reach this load five random increments of rearward load were used.
Section B was repeated, only with the side load attached both 6 inches forward of the centerline of the gimbal and 6 inches rearward of the centerline of the gimbal (see figure 3).
Section B is summarized for clarity. The gimbal was tested at 3 different side pull positions; the center of the gimbal axis, 6 inches rearward of center and 6 inches forward of center. At each location a small preload was applied in the forward direction. Loads were then applied in the rearward direction to simulate drag. Rearward loads ranged between 0 and 280 lbs in 5 random increments. At each increment of rearward load, 12 (2 x 6) random loads ranging from 0 and 55 lbs were applied as side pulls. Readings were taken for all four load cells at each increment.
5.0 RESULTS
All results recorded from this side pull experiment are found under
\\Knarr\CAD_User\Projects\421016\Medium_Gimbal_MkII\Tosmond\WeightApplications.xls
Data taken from section A is found on sheet “Section A” and is contained in APPENDIX A. Data taken from section B is found on sheets “Side Pull (1), (2), and (3)” and is contained in
APPENDIX B.
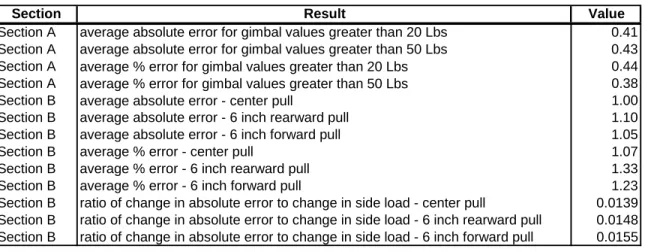
A summary of the averages and ratios calculated from the recorded data is shown on table 1.
Table 1 – Mk II Medium Gimbal Experimental Results
rom the data contained in APPENDIX B, charts 1, 2 and 3 have been generated.
Section Result Value
Section A average absolute error for gimbal values greater than 20 Lbs 0.41 Section A average absolute error for gimbal values greater than 50 Lbs 0.43
Section A average % error for gimbal values greater than 20 Lbs 0.44
Section A average % error for gimbal values greater than 50 Lbs 0.38
Section B average absolute error - center pull 1.00
Section B average absolute error - 6 inch rearward pull 1.10
Section B average absolute error - 6 inch forward pull 1.05
Section B average % error - center pull 1.07
Section B average % error - 6 inch rearward pull 1.33
Section B average % error - 6 inch forward pull 1.23
Section B ratio of change in absolute error to change in side load - center pull 0.0139 Section B ratio of change in absolute error to change in side load - 6 inch rearward pull 0.0148 Section B ratio of change in absolute error to change in side load - 6 inch forward pull 0.0155
Chart 1 Center Pull -0.500 0.000 0.500 1.000 1.500 2.000 2.500 0 10 20 30 40 50 60 7 Trial Number 0 Change in Absolute Error Per Lbs Side Pull Change in %Error
per Lbs Side Pull
Absolute Error
Chart 2
6 Inches Rearw ard
-0.500 0.000 0.500 1.000 1.500 2.000 2.500 60 70 80 90 100 110 120 130
Trail Num ber
Change in Absolute Error Per Lbs Side Pull Change in %Error per Lbs Side Pull
Chart 3 6 Inches Forward -0.500 0.000 0.500 1.000 1.500 2.000 2.500 120 130 140 150 160 170 180 190 Trail Number
Change in Absolute Error Per Lbs Side Pull Change in %Error Per Lbs of Side Pull
Absolute Error
6.0 DISCUSSION
Data taken from Section A indicated that there was some error inherent in the gimbal without the inclusion of side load. Absolute error in the gimbal recorded to be on average 0.41 lbs for gimbal readings greater than 20 lbs and 0.43 lbs for gimbal readings greater than 50 lbs with the internal gimbal continually under reading theoretical values. In terms of % error this
equated to an error of approximately 0.44% for gimbal readings greater than 20 lbs and 0.38 % for gimbal readings greater than 50 lbs. For readings less than 20 lbs, the experiment did not yield meaningful results.
The data taken from Section B shows that side force on the gimbal does have some effect on the error in the internal load cell of the medium gimbal. Throughout the experiment the
absolute error would increase to the order of several tenths of a pound between the range of 0 – 55 lbs of added side force. Using the data recorded it was calculated that on average the error increased 0.0139 lbs per pound of side force added to the gimbal when the side force was applied to the center of the gimbal. This value increased only slightly to 0.0155 lbs and 0.0148 lbs per pound of side force added for side forces applied 6 inches forward and
rearward respectively of the center point for the gimbal. This equates to an increased error of, on average 0.76 lbs, 0.85 lbs and 0.82 lbs of added error with an addition of 55 lbs side force to the center, 6 inches forward and 6 inches rearward respectively. Average moments for the rearward and forward applied forces were 165 in-lbs with a maximum moment of 330 in-lbs
In charts 1, 2 and 3 we can see the absolute error increase as the side load is incrementally increased to 55 lbs. As the load is returned to 0 we see the absolute error drop off. However we also see that the ratio of the change in absolute error to the change in side load added remains nearly constant throughout the entire section for all three pull locations. The ratio of the change in % error to the change in side load is included in these charts and shows consistency through each set of side pulls.
An unusual occurrence in the load cells was noted. After load was applied and then removed the load cells only returned to the same starting point within a couple of pounds. This was particularly true for the load cell in the gimbal. Before commencing a pull the load cell was noted to be in a certain amount of pretension. After the pull test the load cell would be reading a different value by any difference up to as large as 2 lbs. I would have expected the load cell to return to its original value to within several tenths of a pound. This indicates that the primary source of error may have been discrepancies within the load cell.
7.0 CONCLUSIONS
The medium gimbal internal load cell was found to be reading an error of on average between 0.38% - 0.44% when a 300 lbs internal load cell was used to measure drag loads of 20 lbs or greater. This error was found to exist before the application of side force.
With the application of side force without moment there was an increased in the error of the internal load cell. This was calculated to be on average 0.0139 lbs of error in the internal load cell for every pound of side force applied. This equaled on average an increase of 0.76 lbs of error with the addition of 55 lbs.
With the application of side force and moment applied to the gimbal there was an increase in error of the internal load cell. This was calculated to be on average 0.0148 lbs for a rearward force containing an average moment of 165 in-lbs. The average error gain was 0.82 lbs error at 55 lbs side force, 330 in-lbs moment. For the forward force the error was calculated to be on average 0.0155 lbs with an average moment of 165 in-lbs. The average error gain was 0.85 lbs error at 55 lbs side force, 330 in-lbs moment.
8.0 FIGURES
Figure 1 – Mk II Medium Gimbal
Positive y - direction Positive x - direction Positive z – direction
Figure 3 – The Gimbal Board with Load Locations Forward Load Rearward Load Side Load – 3 Different Locations 6” 6” x y z
Figure 4 – Load Cell Locations
Inline Load Cells
Internal Gimbal Load Cell
Figure 5 – Section A