Publisher’s version / Version de l'éditeur:
Vous avez des questions? Nous pouvons vous aider. Pour communiquer directement avec un auteur, consultez la première page de la revue dans laquelle son article a été publié afin de trouver ses coordonnées. Si vous n’arrivez pas à les repérer, communiquez avec nous à [email protected].
Questions? Contact the NRC Publications Archive team at
[email protected]. If you wish to email the authors directly, please see the first page of the publication for their contact information.
https://publications-cnrc.canada.ca/fra/droits
L’accès à ce site Web et l’utilisation de son contenu sont assujettis aux conditions présentées dans le site
LISEZ CES CONDITIONS ATTENTIVEMENT AVANT D’UTILISER CE SITE WEB.
Paper (National Research Council of Canada. Institute for Research in
Construction), 1989
READ THESE TERMS AND CONDITIONS CAREFULLY BEFORE USING THIS WEBSITE. https://nrc-publications.canada.ca/eng/copyright
NRC Publications Archive Record / Notice des Archives des publications du CNRC :
https://nrc-publications.canada.ca/eng/view/object/?id=3d046330-c176-4cd0-8e59-60be830264e4 https://publications-cnrc.canada.ca/fra/voir/objet/?id=3d046330-c176-4cd0-8e59-60be830264e4
NRC Publications Archive
Archives des publications du CNRC
This publication could be one of several versions: author’s original, accepted manuscript or the publisher’s version. / La version de cette publication peut être l’une des suivantes : la version prépublication de l’auteur, la version acceptée du manuscrit ou la version de l’éditeur.
For the publisher’s version, please access the DOI link below./ Pour consulter la version de l’éditeur, utilisez le lien DOI ci-dessous.
https://doi.org/10.4224/40001426
Access and use of this website and the material on it are subject to the Terms and Conditions set forth at
A decision logic for trading between fire safety measures
Ser
TB1
N21d
National Research
Conseil national
n
0162
l'l
Council Canada
de recher@hea Canada
c. 2
BLDG
Institute for
lnstitut de
-
Research in
recherche en
Construction
construction
A
Decision Logic for Trading Between
Fire Safety Measures
by T.Z. Harmathy et al.
Reprinted from
Fire and Materials
Vol. 14. No. 1. March 1989
p. 1-10
(IRC Paper No. 1621)
NRCC 30907
HRC-
ClSmt R C
L I B R A R Y
B I B L I O T H ~ Q U E
I R C
CNqC-
ICISTA
l'aide
de
donnks statistiques et
d'intrants
Delphi, on a ClaborC
une
logique
qui
peut
apporter un
soutien quantitatif pour la prise
de dtcisions concernant l'equivalence
de
diverses mesures de
&wit6
incendie. L'auteur pdsente des exemples d'utilisation de la
logique et tire des conclusions quant aux mtrites
relatifs de ces mesms.
/
FIRE AND MATERIALS VOL 14, 1-10 (1989)A
Decision Logic for Trading between Fire Safety
Measures
T. Z. Harmathy et al.*
1834 Playfair Drive, Ottawa, Ontario, Canada K1H 5S1
Based on statistical data and Delphi input, a logic has been worked out which is capable of offering quantitative support for decisions concerning the equivalence of various fire safety alternatives. Examples of tbe use of the logic are presented and some conclusions drawn as to the relative merits of various fire safety measures.
INTRODUCTION
In light of the considerable effort expended in arguments over trade-offs between fire safety requirements it is surprising how little attention the problem has received from fire researchers. The lack of interest may be at- tributed to the paucity of statistical data which are normally needed in supporting a convincing argument.
Trading the automatic sprinkler system against other active or passive safety measures has always been one of the most contentious issues that come before the commit- tees charged with the preparation of building codes. The merits and demerits of sprinklering have been examined, primarily on economic grounds, in some studies per- formed by NBS (National Bureau of Standards) scientists1. and by the principal author of this paper.3 A decision model has also been suggested on how to trade a set of safety measures against any other: but, for lack of input information, that model has been of little practical value.
Clearly, trading one set of fire safety measures against another is possible only if the two sets are accepted as equivalents. Thus the problem of trading between fire safety requirements is in fact a problem of searching out equivalent alternatives.
Organized in 1985, a Delphi group assumed the task of examining the availability of factual information needed as input into the mentioned decision model and sup- plementing the missing information with Delphi input. Assessing the economic merits of the various equivalent alternatives was outside the mandate of the group.
SCOPE OF THE STUDY
The study was visualized from the outset to cover only the area under the direct control of building codes, in other words, only 'structures' (according to the NFPA termin- ology) of non-industrial use. The occupancies to be considered were grouped as follows:
(1) Dwellings; (2) Apartments;
(3) Hotels, motels; (4) Health care buildings; (5) Office buildings; (6) Educational buildings.
DECISION LOGIC
Although the decision model adopted by the group has been described elsewhere: to save the reader the effort of looking up references it will be briefly outlined in this section.
The premise on which the decision logic has been based is that as long as the expected annual fire losses (human losses (death and injuries) and property losses, both expressed in monetary terms) are the same, any set of fire safety measures is equivalent to any other. Clearly, this premise is quite flexible; it allows for society's changing valuation of human life in relation to property.
The following equation has been suggested for the calculation of the fire loss expectation:
where
L = fire loss (human
+
property) expectation (dol- lars per year per square metre of floor area),N = expected nunlber of fire incidents (per year per square metre of floor area),
P, = probability that, given ignition, the fire will not reach flashover,
PFN = probability that, given flashover, the fire will not spread to other compartment(s),
PFSD = probability that, given flashover, the fire will spread to other compartment(s) by destruc- tion,
P,,, = probability that, given flashover, the fire will spread to other compartment(s) by convec- tion (by the advance of flames and hot gases),
1, = average loss (human
+
property) resulting from fires that do not reach flashover (dollars per incident),* Part of the study was conducted by a Delphi group; Chairman: T. Z. Harmathy, Members: K. H. Almand, V. R. Beck, D. W. Belles, I. A. Benjamin, C. L. Beyler, R. W. Bletzacker, J. L. Bryan, H. J. Campbell, J. A. Campbell, W. J. Christian, J. G. Degenkolb, R. W. Fitzgerald, W. L. Gamble, J. Gering, C. E. Hermance, P. Higginson, W. W. Jones, S. B. Martin, J. R. Mehaffey, H. E. Nelson, W. J. Parker, J. 0 . Ppnderson, A. F. Robertson, E. L. Schaffer, F. R. Steward, T. E. Waterman and J. M. Watts.
03084501/89/01ooO1-10S05.00
0
1989 by John Wiley & Sons, Ltd.Received November 1987 Revised November 1988; Accepted December 1988
T. Z. HARMATHY ET AL.
IF, = average loss (human
+
property) resulting follows: from postflashover fires that do not spread(dollars per incident), O I P , I I
I,,, = average loss (human
+
property) resulting 0 I P,, I 1 ( 5 )from postflashover fires that spread by de- N, Pp and PFN are quantities to be evaluated from fire struction (dollars per incident),
I,,, = average loss (human
+
property) resulting statistics. from postflashover fires that spread by con-vection (dollars per incident).
A compartment is defined as a building space which, EXPECTED NUMBER OF FIRE INCIDENTS most of the time, is separated from other building spaces
'lased door(s). a sinde-famil~ The number of fires is, as a rule, related to floor areas.
Or an apartment two, three or perhaps more
While data on the number of fire incidents are readily
rooms can often be regarded as a compartment' available (e.g. from NFPA statistics), finding or devel-
Among the listed Iour probabilities three-P~~, P ~ ~oping infomation on the total floor areas for various ~ , PFscare conditional on the same event: flashover. Since occupancies is
a very task.
no spread, spread by destruction and spread by con- The last column in Table 1 lists for six occupancies the vection are looked UP"' as mutuall~ exclusive alter- number of fires per year per square metre of natives, floor area. The rest of the table summarizes the back- PFN
+
PFSD ~ ~+
PFSC - - . = 1 (2) . . ground information used in developing the data in the last column. The sources and assumptions are described P F s ~ depends On the fire resistance of the in the footnotes to the table. As most fires occur betweenbuilding and its value can be assigned by design.' Two are 8:m and 8:M) a.m., it is not surprising to see that the truly independent quantities:
number of fires Der floor area seems to be related Pp: probability of no-flashover (given ignition), primarily to the night-time people-concentration in the
building. and
P,,: probability of no-spread (given flashover). Consequently, Eqn (1) can be rewritten as follows:
L c N P p l p & N(1- P&1- PFN
-
PFsD)lFx ASSESSMENT OF Pp AND PFN+
PFSD~FSD+
PFN ~ F N1
(3) Since the building code requirements applicable to Pp and PFN are both conditional probabilities (the first dwellings and low-rise apartment buildings are minimal conditional on ignition, the second on flashover-as well and yet these buildings have most of the features truly as ignition), and their range of variation is restricted as characteristic of community living, it seemed logical toTable 1. Numbers of buildings, total floor areas, fire occurrences and expected number of fues for six types of occupancies
Types of buildings
Number of buildings
(or housing units) Total floor area
(1 000) 10sm2 Expected Number
Number of fires per from from from from of year per 1 O6 m2 Energy US Energy US fires based on US Survey' statistics Survev Statistics (1000) statistics
Dwellings 66 200b 12510' 501 .5d 40.1
Apartments 24 200b 2 11 5' 1 04.5d 49.4
Hotels, motels 71' 95' 7.5d 79.0
Health care buildings 44 62' 110 21 58 1 6.8h 78.1
Office buildings 600 587' 646 799' 19.6' 24.5
Educational buildings 161 181' 526 5718 1 3.5d 23.6 " For 1979; based on ref. 6.
Number of housing units; estimated for 1985 from information in Table 1283 of ref. 7. ' Estimated for 1985 from information in Tables 1283 and 1290 of ref. 7.
NFPA data for 1985; from ref. 8.
Estimated for 1985 from information in Table 1385 of ref. 7.
The total number of rooms, as estimated for 1985 from information in Tables 1358 and 1381 of ref. 7, is 2.7 x
lo6.
This estimate has been confirmed by the American Hotel and Motel Association. It has been assumed that the average room area is 35 m2.Estimated for 1985 from information in Table 1299 of ref. 7.
Average for the period 1980-83; from ref. 9.
Ref. 8 reports for 1985 49 000 fires for Stores and Offices. Based on floor areas of buildings in this category, it is estimated that 40% of these fires occur in offices.
A DECISION LOGIC FOR TRADING BETWEEN FIRE SAFETY MEASURES 3
/egard them among the non-industrial buildings as 'refer- ence buildings'. The factors that characterize these refer- ence buildings and their relation to the communal facili- ties were thought of as providing an ensemble of 'reference conditions'. The probabilities of no-flashover and no-spread under such reference conditions were looked upon as 'reference probabilities'.
According to the decision logic adopted by the Delphi group, the probabilities applicable to a specific building (characterized by the presence of one or more factors not normally present in reference buildings) were to be asses- sed by adding (positive or negative) increments to the
reference probabilities in the following way:
abilities (P,), and (P,,), (no-flashover and no-spread, respectively, in dwellings and low-rise apartment build- ings). Unfortunately, a closer examination will reveal that the 'extent of fire' categories in Table 2 are rather ambiguous, and therefore the tabulated values need some further clarification.
The number of deaths
per
fire incident (shown in the last columns of Tables 2 and 3) provides some guidance.It is important to note that this number increases steadily with the extent of fire (Table 2). We can see, therefore, that the fires referred to as 'undeterminedjnot reported' must have
been
mainly fires confined to an object or part of a room.Using the deaths per fire incident data, a realistic interpretation of the tabulated information can be de- rived, such as that shown in Table 4. According to this table,
(7) 215007
(P,), = = 0.786 where the 0 subscripts indicate reference conditions and
(APP)i and (APFN)i are probability increments pertaining to an ith factor responsible for some deviation from the reference conditions. The terms under the summation sign will be called 'relative probability increments'. Naturally, the restrictions imposed on the values of
P,
and P,,,
as expressed by Eqns (4) and (5), still apply.INFORMATION ON (PPIO, (PFNIO AND (PFSDIO The TriData agency (US) and the Insurers Advisory Organization (Canada) were contacted for statistical data suitable for use in the decision algorithm. Since the data received from the two sources showed remarkable simi- larities, the more comprehensive US data were chosen for detailed analysis.
The information supplied by the TriData agency1' was abstracted from the records of the National Fire Incident Reporting System (NFIRS). They covered some 274000 fire incidents which, according to the NFPA statistics,' represented 45% of all fires that occurred in dwellings and apartments. Parts of the NFIRS information are reproduced in Tables 2 and 3.
At first glance, Table 2 seems to contain all the information necessary for quantifying the reference prob-
Table 3, in which the number of fire incidents, deaths and injuries are shown as functions of the property loss, provides some additional guidance. At $4000 property loss a sharp rise occurs in the number of deaths per fire incident which, according to Tables 2 and 4, should be interpreted as indicating fire development beyond the preflashover stage. It appears that some value between
$3000 and $ 4 0 0 (perhaps $3500) should be regarded as the upper limit for property losses in fires that do not reach the flashover stage. With the data in Table 3,
(The last term, 536612, reflects the choice
of
$3500 as the upper limit of property loss sufferedin
preflashover fires.) There is another jump in the number of deaths per tire incident at $9000, which suggests(see
the last column of Table 2) that property losses in the $35W9000 interval are characteristic offires that, given flashover, will remain confined to the compartment of fire origin. Again, withTable 2. Number of fires, deaths and injuries in dwellings and apartments, as related to tbe extent of fire (NFIRS data for 1985)"
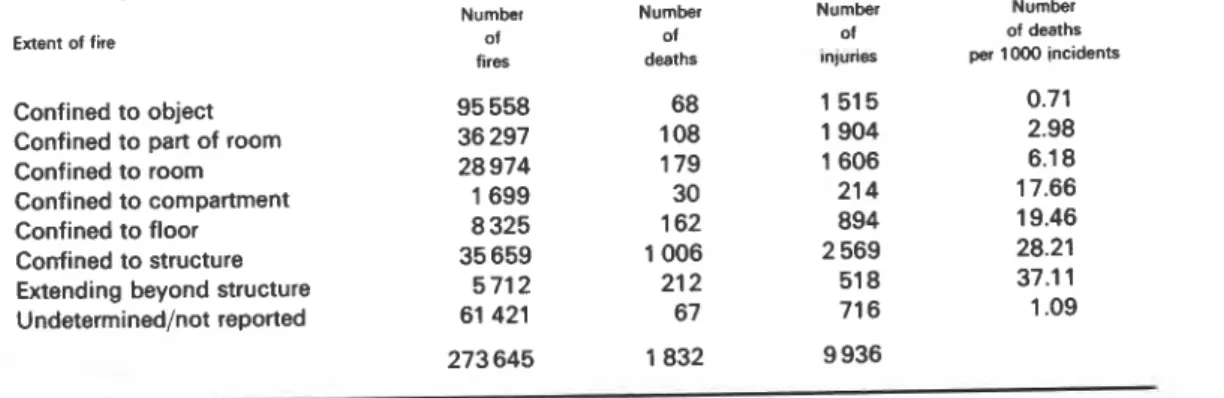
Number Number Number Number
Extent of fire of of of of deaths
fires deaths injuries per 1000 incidents Confined to object
Confined to part of room Confined to room Confined to compartment Confined to floor Confined to structure Extending beyond structure Undetermined/not reported
4 T. Z. HARMATHY ET AL.
Table 3. Number of fires, deaths and injuries in dwellings and apartments, as related to property
losses (NFIRS data for 1985)1°
Number Number Number Number
Propew loss (S) of of of of deaths
fires deaths injuries per 1000 incidents
0- 999 188189 290 3 385 1.54 1 000- 1 999 15 867 37 725 2.33 2000- 2 999 8 693 37 499 4.26 3000- 3999 5 366 39 355 7.27 4000- 4999 3019 44 1 84 14.57 8 360 ! 5000- 5999 90 455 10.77 6000- 6999 2 357 35 169 14.85 7000- 7 999 1 882 26 139 13.82 8000- 8999 2 099 30 160 14.29 9000- 9 999 975 22 83 22.56 10000-11 999 5 370 122 439 22.72 12 000-1 3 999 2 129 32 1 46 15.03 1 4 000-1 5 999 3 848 92 352 23.91 1 6 000-1 7 999 1 858 60 177 32.29 18 000-1 9 999 871 20 62 22.96 20 000-29 999 7 554 226 725 29.92 30 000-39 999 5010 189 500 37.72 40 000-49 999 2 705 131 339 48.43 50 000- 7 493 31 0 1 042 41.37 273 645 1 832 9 936
Table 4. Interpretation of information in Table 2
Nature of fire
As interpreted in this report As classified in Table 2
Fires confined to object (Given ignition) Fires confined to part of room No flashover 75% of fires confined to room
Fires undeterminedlnot reported
25% of fires confined to room (Given flashover) Fires confined to compartment No spread 80% of fires confined to floor
20% of fires confined to floor (Given flashover) Confined to structure Spread Extending beyond structure
Number of fires
the information in Table 3,
Clearly, there is a fair agreement between the values developed for (P,), and (P,), from the information in Tables 2 and 3 by complementary reasoning. Since the
property loss figures were thought to yield a more objective basis for estimating the extent of fire than the descriptive terms used in Table
2,
it was decided that the latter values of (P,), and (P,), would be used in the decision logic.The available statistical data give no clue whatever as to the probability of fire spread by the destruction of compartment boundaries. Fire investigation reports often make mention of structural damages sufficient to allow spread, but there is good reason to believe that a great many of those damages were the consequences rather than causes of fire spread. Observations clearly indicate that, in buildings designed according to the accepted norms, convection is by far the most common mode of spread. It seemed reasonable to assume that (P,,,), x 0.1, i.e. under reference conditions 10% of postflashover fires would spread by the destruction of compartment boundaries. It should be emphasized, how- ever, that establishing a reference value for P,, is only of marginal interest, since the actual value of P,,, as mentioned earlier, can be assigned by design.'
1
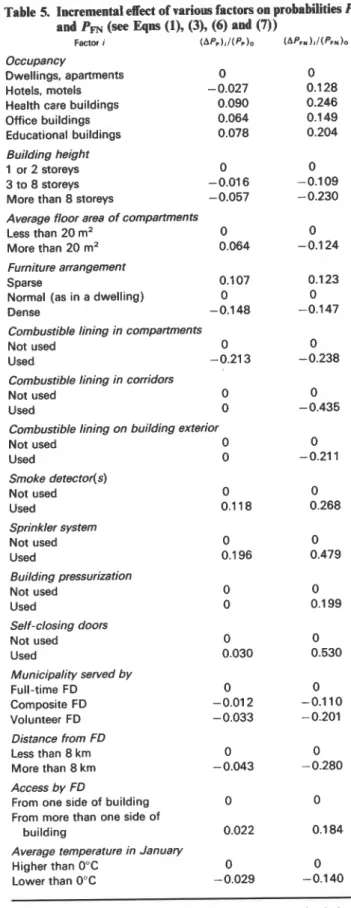
A DECISION LOGIC FOR TRADIN( 3 BETWEEN FIRE SAFETY MEASURES 5FORMATION ON (APP)i/(P& AND
(APFN )iI(Pm)o
The relative probability increments, (APP),/(Pp), and
(APFN /(Pm),, have been assessed by the Delphi group.
(See Dalkey's report1' for details on the Delphi techni- que.) The information developed by the group, converted to make it suitable for use as input into the decision logic, is presented in Table 5. By definition, the relative prob- ability increments representing reference conditions are equal to 0.
The work of the group, the interpretation of the Table 5 data, the original Delphi ratings and the need for con- verting the original ratings are discussed in the Appendix.
INFORMATION ON l p , I,, I,, AND Im
A tabulation of NFIRS data (similar to that in Table 3 but more detailed) was analyzed to develop information on fire losses in a form suitable for the decision logic. The result of this analysis is presented in Table 6.
There is no factual basis to ascertain if the property losses in fires spreading by destruction are any larger than those in fires that spread by convection. It was assumed that the destruction of a compartment boundary adds $5000 to the property loss. With the additional assump- tion (discussed earlier) that about 10% of the fully developed fires that spread do so by destruction, the average property losses per fire for the two kinds of spreading fires were estimated (using the applicable infor-
' mation in Table 6) as follows:
i
, For fires spreading by destruction: $43 698 per fire I For fires spreading by convection: $38 698 per fire
!
As discussed in a recent article by Ramachandran,I2I the value of human life and the cost of injury are very
I
controversial subjects. There are many who question the morality of putting a dollar tag on human life and suffering. Those charged with making trade-off decisions, however, cannot be concerned with moral issues. The values reported in the Ruegg-Fuller study1 will be used here, according to which a human life is worth $0.558x lo6 and the cost of injury is $0.022 x lo6 (The values quoted here have been adjusted for 1985, using the consumer price index.) These are well-accepted figures, routinely used in cost-benefit studies.
With the information in Table 6, the discussed assump- tion on losses resulting from fires spreading by destruc- tion and convection, and the NBS figures for the monet- ary value of human loss, I,, I,, , I,,, and I,,, (see above for notations) have been calculated and the results are shown in Table 7.
1
DISCUSSIONFor convenience, much of the information developed so far has been summarized in Table 8. Tables 5 and 8 now can provide all the information necessary for the use of the decision logic.
Table 5. Incremental effect of various factors on probabilities Pp
and PFN (see Eqm (11, (3), (6) and (7))
Factor I ( A P p ) j I ( P p ) o ( A P F N ) I / ( P F N ) o Occupancy
Dwellings, apartments 0 0
Hotels, motels -0.027 0.1 28
Health care buildings 0.090 0.246
Office buildings 0.064 0.1 49
Educational buildings 0.078 0.204
Building height
1 or 2 storeys 0 0
3 to 8 storeys -0.01 6 -0.1 09
More than 8 storeys -0.057
-
0.230Average floor area of compartments
Less than 20 m2 0 0
More than 20 m2 0.064 -0.124
Furniture arrangement
Sparse 0.107 0.123
Normal (as in a dwelling) 0 0
Dense -0.148 -0.147
Combustible lining in compartments
Not used 0 0
Used -0.21 3 -0.238
Combusfible lining in corridors
Not used 0 0
Used 0 -0.435
Combustible lining on building exterior
Not used 0 0 Used 0 -0.21 1 Smoke detector(s) Not used 0 0 Used 0.1 18 0.268 Sprinkler system Not used 0 0 Used 0.1 96 0.479 Building pressurization Not used 0 0 Used 0 0.1 99 Self-closing doors Not used 0 0 Used 0.030 0.530 Municipality senled by Full-time FD 0 0 Composite FD -0.01 2 -0.1 10 Volunteer FD -0.033 -0.201 Distance from FD Less than 8 km 0 0 More than 8 km -0.043 -0.280 Access by FD
From one side of building 0 0
From more than one side of
building 0.022 0.1 84
Average temperature in Januaty
Higher than 0°C 0 0
Lower than 0°C -0.029 -0.140
Notes: (1) The reference conditions are characterized by 0
increments.
(2) Positive values indicate improved safety; negative
values indicate decreased safety.
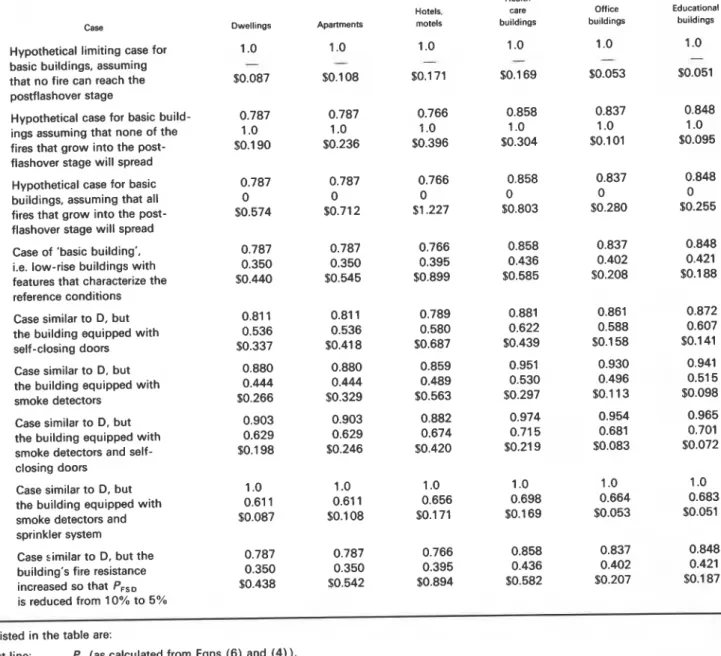
The results of a number of sample calculations are presented in Table 9. A and C in the table represent hypothetical cases, the best and the worst situations for Case D buildings from the point of view of fire loss
T. Z. HARMATHY ET AL.
\
Table 6. Numbers of fires, property losses, deaths and injuries in dwellings and apartments, as related to the nature of fire(derived from NFIRS data for 1985)'O Nature of fire'
Average
Number Property property Deaths Injuries
of loss Deaths Injuries loss par per
fires ( l o 8 $ ) ($/fire) 1000 fires 1000 fires
Fires not reaching the
flashover stage 21 5 432 149.0 384 4787 692 1.78 22.2
Fully developed fires that
~
do not spread 20 400 11 6.2 244 1284 5696 12.0 62.9
Fully developed fires
that spread 37813 1482.2 1 204 3865 39198 31.8 102.2
i
Total 273645 1 747.4 1 832 9936
i
a AS interpreted from property loss data as follows:
(1) Fires not reaching the flashover stage: property loss from 0 to $3500; (2) Fully developed fires that do not spread: property loss from $3500 to $9000; (3) Fully developed fires that spread: property loss larger than $9000.
Table 7. Losses per fire incident, detailed according to the needs of the decision logic (Eqn (3)) Losses in fires
that do not Losses in fires that grow beyond flashover (S per incident)
reach flashover Non-spreading Spreading fires
Types of loss (S par incident) fires by destruction by convection
Property loss 692 5 696 43 698 38 698
Death 993 6 696 1 7 744 17 744
Injury 488 1 384 2 248 2 248
1,=2173 IF, = 13 776 IFSO = 63 690 IFsc = 58 690
Table 8. Summary of the information to be used in the decision logic (Eqn (3))
Variable Value
Expected number of fire incidents (per year per m2 floor area):
N
Dwellings Apartments Hotels, motels Health care buildings Office buildings Educational buildings Reference probabilities (PP)O (PFN l o (PFSD 10
Losses ($ per fire incident)
/P
I F N
IFS,
'FSC
expectation. B is also a hypothetical case which can perhaps be regarded as the practical aim of fire pro- tection.
Case D relates to 'basic buildings'. With dwellings and low-rise apartment buildings a basic building is one with more or less the features that characterize the reference conditions. (The relative probability increments for refer- ence conditions are, by definition, equal to 0 in Table 5:
see above.) As to other occupancies, a basic building is, as a rule, a hypothetical low-rise building with none of the fire safety features required by the building codes.
To explain the meaning of the values in Table 9, attention is directed to health care buildings equipped with smoke detectors (Case F). The table shows that the probability that a fire will not grow to flashover (P,) is 95.1% and the probability that a fully developed fire will not spread beyond the room of origin (PFN) is 53.0%. (The corresponding figures for a 'basic' health care build- ing (Case D) are 85.8% and 43.6%, respectively.) The fire loss expectation is $0.297 per year per square metre of floor area.
According to the adopted decision logic, the equival- ence of fire safety measures is judged by the equality of the fire loss expectations. The cases presented in Table 9 were not selected to illustrate the working of this principle. An analysis of the following two cases may serve as illus- tration.
Case I : Two-storey office building, the rooms are
lined with combustible materials, the building is fully sprinklered;
Case 2: Ten-storey office building, the ofices are
equipped with self-closing doors.
The following values can be calculated, using Tables 5 and 8, and Eqns (6), (7) and (3):
Case 1: Pp = 0.824, PFN = 0.487, L = $0.205 per
year per square metre of floor area;
Case 2: Pp = 0.816, P,, = 0.507, L = $0.208 per
A DECISION LOGIC FOR TRADING BETWEEN EIRE SAFETY MEASURES
Table 9. Results of sample calculations using the decision logic (Eqn (3))"
Health Hotels. care
Case Owell~ngs Apartments motels buildings
Hypothetical limiting case for basic buildings, assuming that no fire can reach the postflashover stage
Hypothetical case for basic build- ings assuming that none of the fires that grow into the post- flashover stage will spread Hypothetical case for basic buildings, assuming that all fires that grow into the post- flashover stage will spread
Case of 'basic building', i.e. low-rise buildings with features that characterize the reference conditions Case similar to D, but the building equipped with self-closing doors Case similar to D, but the building equipped with smoke detectors
Case similar to D, but the building equipped with smoke detectors and self- closing doors
Case similar to D, but the building equipped with smoke detectors and sprinkler system
Case similar to D, but the building's fire resistance increased so that P,,, is reduced from 10% to 5% Office buildings Educational buildings
1
a Listed in the table are:First line: P, (as calculated from Eqns (6) and (4)).
Second line: P,, (as calculated from Eqns (7) and (5)).
Third line: L loss (property
+
human, as calculated from Eqn (3), using data listed in T bles 5 and 8), inI'
$ per year per m2 floor area.Conclusion: The two office buildings are roughly equivalent from the point of view of fire safety. After studying the information in Table 9 the following conclusions can be drawn:
(I) With basic low-rise buildings the optimum fire safety situation (Case A) can be achieved by the combined use of sprinklers and smoke detectors, whch may prevent a fire from reaching the postflashover stage. The expenses, however, may be prohibitive (see e.g.
references 1 and 3), and therefore achieving the situ- ation in Case B should perhaps be considered as a potential goal.
(2) The practical fire safety objective (represented by Case B) may be approximated in some occupancies by the use of smoke detectors alone (see Case F), and
in others by the combined use of smoke detectors and self-closing doors (see Case
G).
(3) Case I illustrates the futility of trying to improve fire safety by increasing the fire-resistance requirements. (4) If the equality of fire loss expectations is regarded as
the criterion of equivalence with respect to fire safety, then the building code requirements may !x relaxed for office and educational buildings. but they should be strengthened for hotels and motels.
It is encouraging to see that the conclusions yielded by the logic are in line with the dictates of common sense. Some available data, statistical data and others devel- oped on theoretical grounds also seem to support the validity of the logic.
An analysis of the NFIRS datalo indicates that for the 'basic' dwellings and apartments (not equipped with
8 T. Z. HARMATHY ET AL.
\
sprinkler systems and smoke detectors) the average fireloss in 1985 (property loss plus human loss, the latter assessed as described above) amounted to $0.545 per year per square metre of floor area. The corresponding figure in Table 9 is from $0.440 to $0.545.
The Ruegg-Fuller study1 claims that in dwellings the combined use of sprinklers and smoke detectors reduces the property losses, deaths and injuries by 71.3%, 80.4% and 45.9%, respectively. With these reductions, the aver- age fire loss would amount to $0.146 per year per square metre of floor area. This figure compares with $0.087 in Table 9.
The main utility of the decision logic developed by the Delphi group is that it is capable of offering quantitative support for decisions in an area controlled by building regulations, which may often turn into a battleground of conflicting interests. To fine-tune this logic, a substantial amount of statistical data would be needed. Unfortu- nately, data on fire incidents rarely come broken down into items of interest to the building designer and the economist. There is clearly an urgent need for rethinking and reorganizing the data-collection system.
APPENDIX
The Delphi group was organized in 1985 and work on the subject discussed in this report began early in 1986. The first two rounds dealt with formulating the decision model and assembling a list of those factors that were deemed to have significant iduence on the probabilities P, and P , (see Eqns (1) and (3), and the interpretation of the symbols). To keep the problem manageable, some factors of lesser importance had to be disregarded.
Assigning numerical values to the relative probability intrrements,(APp)i/{P,)o and (AP,), /(P,), (see Eqns (6)
and (7)), as functions of the agreed-upon factors started
with the third round in August 1986. In the next three
rounds, conducted in Novemkr 1986, February 1987 and August 1987, these values were gradually refined
using the feedback technique."
Since the task was to assess the probability increments
in relation to rhe reference probabilities the members of
the group were asked to disregard the presence (in certain
occupancies) of all special safety features required by the building codes. They were also asked to take into
con-
sideratibn the fact that the fire department rarely amves at the scene of fire in time to fight preflashover fires.
Some
other aspects of assessing the values of therelative probability increments, developed by interaction
between the chairman and the members of the group, were as follows.
Occupancy
The probability increments reflect primarily on:
(1) The nature of the customary furnishings in the build- ing, and whether they are chosen by people aware of the fire problem;
(2) The presence or absence of considerable quantities of combustible materials other than the furnishings;
(3) Whether smoking is permitted or restricted in th\ building;
(4) The presence or absence of supervision during the
time the compartments are occupied;
(5) The presence or absence of equipment available to
fight incipient fires, and whether some occupants are trained to use the equipment;
(6) The likelihood that a fire will
Ix
discovered at an early stage (e.g. because of high people-concentration).Building height
I
It is difficult to fight fires in tall buildings. On the other hand, the presence of many people in large buildings may make it more likely that a fire will be discovered at an early stage.
Floor area
The larger the floor area of the compartments, the longer it takes for the fire to reach flashover, and therefore intervention by the fire department during the preflash- over period is more likely. On the other hand, large compartments usually have more doors which may facili- tate the intercompartmental spread of fire and smoke.
Furniture arrangement
A crowded furniture arrangement may accelerate the development and spread of fire.
Building pressurization and self-closing doors
These measures are effective during the postflashover period, and may substantially impede the spread of fire and smoke.
The kind of fire department
Full-time fire departments are the best trained and equipped.
The average temperature in January
Air currents during the heating season aid the spread of smoke and fire.
The influence of the other factors on the probabilities
P, and PFN seemed to be obvious.
To save time, the assessment of the relative probability increments ((APP),/(Pp), and (APFN)i/(PFN)O) by the group started simultaneously with the collection of stat- istical data for the evaluation of (P,), and (Pm),. The initial lack of information
on
these two reference prob- abilities presented some problems. It follows from Eqns (4)47) and the fact that in Eqns (6) and (7) there may beA DECISION LOGIC FOR TRADING BETWEEN FIRE SAFETY MEASURES
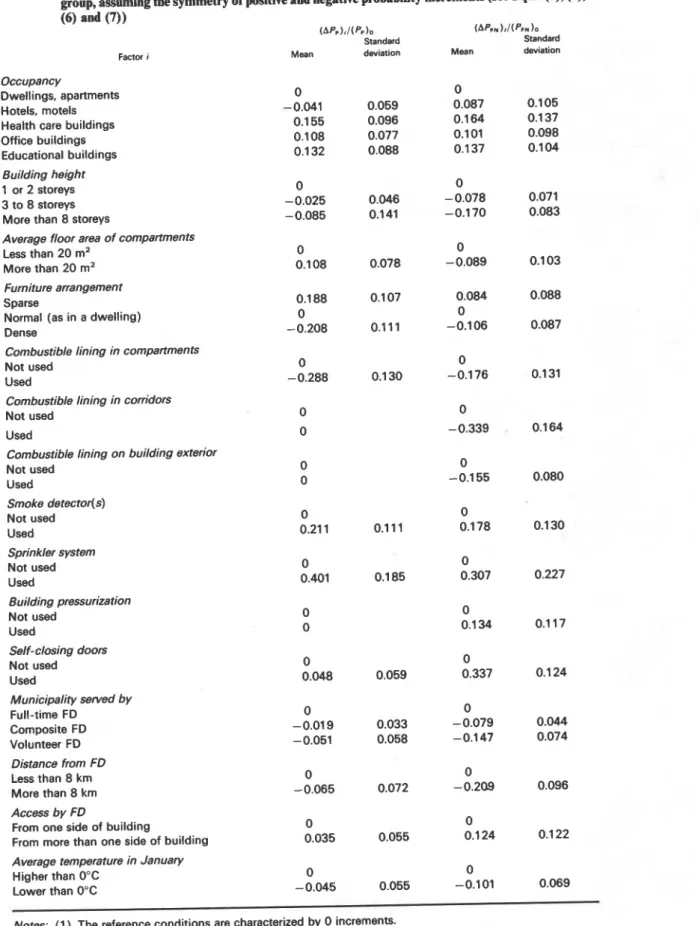
Table Al. Incremental etlect of various factors on probabilities P, and P,,, as developed by the Delphi group, assuming the symmetry of positive and negative probability increments (see Eqm. (I), (3),
(6) and (7))
(APP),I(PP)O (APw ) , / ( P F N ) O
Standard Standard
Factor I Mean deviation Mean deviation
Occupancy
Dwellings, apartments 0 0
Hotels, motels -0.041 0.059 0.087 0.1 05 Health care buildings 0.1 55 0.096 0.1 64 0.1 37 Office buildings 0.108 0.077 0.1 01 0.098 Educational buildings 0.1 32 0.088 0.1 37 0.104 Building height
1 or 2 storeys 0 0
3 to 8 storeys -0.025 0.046 -0.078 0.071 More than 8 storeys - 0.085 0.141 -0.1 70 0.083 Average floor area of compartments
Less than 20 m2 0 0
More than 20 m2 0.1 08 0.078 -0.089 0.1 03 Furniture arrangement
Sparse 0.1 88 0.107 0.084 0.088
Normal (as in a dwelling) 0 0
Dense -0.208 0.1 11 -0.1 06 0.087
Combustible lining in compartments
Not used 0 0
Used -0.288 0.1 30 -0.1 76 0.131
Combustible lining in corridors
Not used 0 0
Used 0 -0.339 0.164
Combustible lining on building exterior
Not used 0 0 Used 0 -0.155 0.080 Smoke detector(s) Not used 0 0 Used 0.21 1 0.111 0.1 78 0.1 30 Sprinkler system Not used 0 0 Used 0.401 0.1 85 0.307 0.227 Building pressurization Not used 0 0 Used 0 0.1 34 0.117 Self-closing doors Not used 0 0 Used 0.048 0.059 0.337 0.1 24 Municipality served by Full-time FD 0 0 Composite FD -0.01 9 0.033 -0.079 0.044 Volunteer FD -0.051 0.058 -0.147 0.074 Distance from FD Less than 8 km 0 0 More than 8 km
-
0.065 0.072 -0.209 0.096 Access by FDFrom one side of building 0 0
From more than one side of building 0.035 0.055 0.1 24 0.1 22 Average temperature in January
Higher than 0°C 0 0
Lower than 0°C -0.045 0.055 -0.101 0.069
Notes: (1) The reference conditions are characterized by 0 increments.
With (P,), = 0.787 and (P,,), = 0.350
T- 2. HARMATHY ET A L
Only if (P,), and (P,,), were both equal to 0.5 would the upper limit of these two ranges be equal to
+
1, and therefore positive and negative relative probability in- crements of equal importance could be expressed by equal (absolute) values.To bypass the problem, the members of the group were asked to assume the symmetry of positive and negative (relative) probability increments: in other words, to as- sume that (P,), and (P,), were both equal to 0.5.
Seventeen members of the Delphi group participated in the last (sixth) round. The results of the final round, in terms of arithmetic means and standard deviations, are presented in Table A l .
To take account of the fact that the ranges of variation\ for (AP,)i/(Pp)o and (AP,),/(P,), are
as
shown in Eqns (A3) and (A4) (rather than from-
1, to+
I), the arithmetic means in Table A1 have been modified using the following empirical equation:where
y = modified value of (APp)i/(Pp)o Or (APFN)i/(PFN)O, x = value of (APp)i /(P,), or (AP,N)i/(AP,,)o, as listed in
Table Al,
a = (P,), or (P,,), (i.e. 0.787 or 0.350).
(By substituting
-
1 and+
1 for x and the appropriate value of a in Eqn (A5), the lower and upper limits shown in Eqns (A3) and (A4) will be obtained.)Table 5 is a listing of the arithmetic means shown in Table A1 modified using Eqn (AS).
REFERENCES
1. R. T. Ruegg end S. K. Fuller, A benefit-cost model of residential
fire sprinkler systems. NBS Techn~cal Note 1203, National
Bureau of Standards. Washington, DC. November 1984.
2. A. Gombetg, B. Buchbinder and F. L. Offensend. Evaluating
alternative strategies for reducing residential fire loss-the fire loss model. NBSlR 82 -2551, 1982.
3. T. Z. Harmathy. On the economics of mandatory sprinklering of dwellings. Fire Technology 24, 245 (1 988).
4. T. 2. Hamathy. A suggested logic for trading between fire- safety measures. Fire and Materials 10, 1 41 (1 986).
5. T. 2. Harmathy and J. R. Mehaffey, Design of buildings for
prescribed levels of structural fire safety. In T. 2. Harmathy (ed.),
Fire Safety: Science and Engineering, ASTM STP 882, American Society for Testing and Materials, Philadelphia, 1985, p. 160. 6. Nonresidential building Energy Consumption Survey; Building
Characteristics, Report No. DOE/EIA-0246, US Department of Energy, Washington, DC, March 1981.
- -
-7. Statistical Abstract of the United States, 1 987, 1 07th edn, US
Government Printing Office, Washington, DC.
8. M. J. Karter, Fire loss in the United States during 1985. Fire Journal, September 1986, p. 26.
9. J. R. Hall, Fire experience in hearth care facilities. From Bulbfin
of the Health Care Facilities, N FPA Publication No. 37. March 1986.
10. Data communicated on 7 Februaw and 2 October 1987, en- closed with letters signed by Philip S. Schaenman, President, TriData.
11. N. C. Dalkey, The Delphi Method: An Experimental Study of
Group Opinion, Report No. RM-5888-PR, The Rand Cor- poration, Santa Monica, CA, 1969.
12. G. Ramachandran. Value of human life. In SFPE Handbook of
This paper is being distributed in reprint form by the Institute for Research in Construction. A list of building practice and research publications available from the Institute may be obtained by writing to the Publications Section, Institute for Research in Construction, National Research Council of Canada, Ottawa, Ontario, KIA 0R6.
Ce document est distribue sous forme de tire-&-part par 1'Institut de recherche en construction. On peut obtenir une liste des publications de 1'Institut portant sur les techniques ou les recherches en mati5re de bitiment en krivant & la Section des publications, Institut de recherche en construction, Conseil national de recherches du Canada, Ottawa (Ontario). KIA 0R6.