Publisher’s version / Version de l'éditeur:
Vous avez des questions? Nous pouvons vous aider. Pour communiquer directement avec un auteur, consultez la
première page de la revue dans laquelle son article a été publié afin de trouver ses coordonnées. Si vous n’arrivez pas à les repérer, communiquez avec nous à PublicationsArchive-ArchivesPublications@nrc-cnrc.gc.ca.
Questions? Contact the NRC Publications Archive team at
PublicationsArchive-ArchivesPublications@nrc-cnrc.gc.ca. If you wish to email the authors directly, please see the first page of the publication for their contact information.
https://publications-cnrc.canada.ca/fra/droits
L’accès à ce site Web et l’utilisation de son contenu sont assujettis aux conditions présentées dans le site LISEZ CES CONDITIONS ATTENTIVEMENT AVANT D’UTILISER CE SITE WEB.
Proceedings: Snowsymp 94, International Symposium on Snow & Related
Manifestations, 26-28 Sep 1994, Manali (H.P.), pp. 114-124, 1996
READ THESE TERMS AND CONDITIONS CAREFULLY BEFORE USING THIS WEBSITE. https://nrc-publications.canada.ca/eng/copyright
NRC Publications Archive Record / Notice des Archives des publications du CNRC :
https://nrc-publications.canada.ca/eng/view/object/?id=94a25364-4bfc-4415-ab55-9498b24768e6 https://publications-cnrc.canada.ca/fra/voir/objet/?id=94a25364-4bfc-4415-ab55-9498b24768e6
NRC Publications Archive
Archives des publications du CNRC
This publication could be one of several versions: author’s original, accepted manuscript or the publisher’s version. / La version de cette publication peut être l’une des suivantes : la version prépublication de l’auteur, la version acceptée du manuscrit ou la version de l’éditeur.
Access and use of this website and the material on it are subject to the Terms and Conditions set forth at
Crystallographic characterization of a core from the Ward Hunt ice
shelf, Canada
I I 111 Nil well
Paul D. BARRETTE' and Nirmal K. SINHA 1' 2
ABSTRACT
A detailed textural analysis was conducted on a core collected on an ice island which originated from
the Ward Hunt ice shelf. Crystal size and morphology were determined at nine sites along the length
of this core, with the use of a statistics software designed to produce this data from digitised images of
thin sections. The orientation of the [00011 axis of the grain assemblages was also determined. These
variables displayed little variation with depth, suggesting a common origin of the ice throughout its
thickness. A vertical single-maxima in lattice orientation is reported. This feature may be accounted
for in two ways: 1) The present Ward Hunt ice shelf represents the base of a previously thicker ice
sheet; 2) the observed lattice orientation was initiated early in the history of deposition leading to the
formation of the shelf ice.
INTRODUCTION
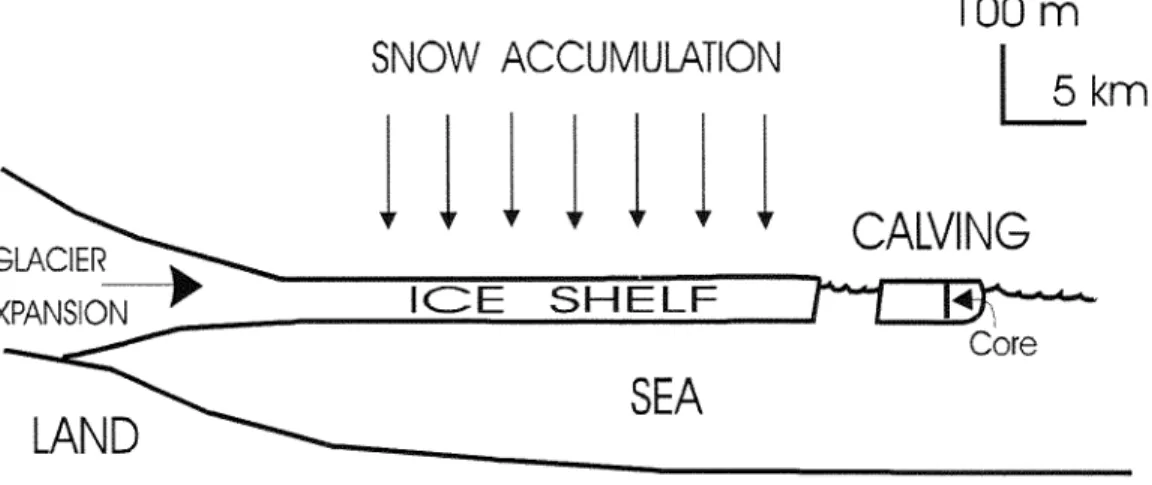
An ice shelf generally forms where one or more land glaciers spread out onto the sea to produce a
laterally widespread, relatively flat floating body of ice [1](Fig. 1). Because it rests on water, it is
subjected to tide motions. Its base is frictionless. Ice shelves occur mostly in Antarctica where they
occupy embayments up to 500 000 sq. kin in surface area (the size of Spain) [1,2]. Others, less
sizeable, are also known from the northern hemisphere, the most renowned of which is the Ward Hunt
ice shelf in the Canadian High Arctic [3,4].
lOOm
GLACIER EXPANSJO , !SNOW ACCUMULATION
5 k
I I I I I I I
CALVING
IGE SHELF___
CoreFigure 1: Schematic representation of an ice shelf. The scale is that of the Ward Hunt ice shelf.
1Dépt. de Genie Civil, Université Laval, Ste-Foy, Quebec Canada G1K 7P4. Present address.' see (2) 2
for Environmental Research and Technology, Building Fl-i 7 National Research Council, Institute
Ottawa, Ontario, Canada KIA 0R6
The Ward Hunt ice shelf lies in the northern part of Ellesmere island, at latitude 83 ° 12' between meridians of longitudes 72 °00' and 78°30'. It covers a triangular area of approximately 440 sq. km in the Arctic Ocean, at the mouth of Disraeli Fjord [3,4]. Reported total thickness of the ice sheet does not exceed 50 metres. Unlike the ice shelves from the south, fed mainly by the seaward expansion of inland ice [5], the Ward Hunt ice shelf resulted from the vertical accumulation of snowpack and its progressive transformation into ice as it underwent an increasing amount of pressure exerted by the overlying snow column [4,51(Fig. 1). This process is similar to that ultimately leading to the development of a glacier, except that it takes place without the influence of a slope gradient
In 1982-83, a group of tabular icebergs broke off from this shelf, a mechanism referred to as 'calving' [6](Fig. 1), and proceeded on drifting south in the Beaufort Sea. These, along with others from previous and following years, constitute a navigational hazard in virtue of their size, relatively high strength and longevities. A research station was established on the largest of these islands in 1986 in an attempt to gain a better knowledge of their internal structure and mechanical properties. The program included, among other assignments, the investigation of two 76 mm diameter cores, about 35 in in length [4,7,8].
iHiJbi
This paper presents the results of a detailed textural analysis that was conducted on one of these cores to determine the depth dependence of crystal size, morphology and lattice orientation. It also addresses the potential of a software designed to produce this data automatically from digitised images of thin sections. The interpretation of the origin of the ice is presented and compared with earlier work carried out on the Ward Hunt shelf.
The core under investigation reached a depth of 33.97 m. Its extraction yielded segments of different lengths which were wrapped in polyethylene bags and cardboard tubes. These were then stored in insulated containers with dry ice for shipment to the laboratory.
The longest segments were used for mechanical testing [7,8]. The others were made available for this analysis. A total of nine sites were sampled at arbitrary intervals along the length of the core (Fig. 2). The orientation of each segment was known only with respect to the core axis. The top direction or the orientation within the horizontal plane was not recorded.
k'ID I;(I siin IM
The following procedures were followed at every site.
1) A 5 mm-thick section was cut either parallel or perpendicular to the core axis (the latter is designated by an asterisk in Fig. 2). This section was then reduced to a thickness of .6 to 1.2 mm with a 'double microtoming' technique, described in Sinha [9]. The foremost advantage of this method is that it restricts the structural damage to a few microns away from the surface of the specimen. This contrasts with the more widely used 'bottom melting' technique which induces thermal stresses across the thickness of the specimen.
2) A black-and-white photograph of the thin section was taken under illumination between crossed polarizers. A view camera, with a 100x125 mum (4x5 in.) format positive/negative Polaroid film, was used. This photograph was digitised on a scanner with a resolution set at 12 dots per mm. Grain
boundaries were outlined manually on an image editing application program, loaded on a desktop AT-compatible computer.
3) The modified image was then processed through MochaTM (from Jandel Scientific), an image analysis statistics software, on the same computer. Only crystals recognised as being fully enclosed in the scanning area were considered. The variables measured were grain Perimeter, Area, Feret Diameter, Shape Factor, Compactness, and Major Axis Length and Slope. These are defined as follows:
- Perimeter: Summation of all pixels forming the boundary of a crystal.
-Area: Summation of all pixels contained within a crystal.
-Feret Diameter: Diameter of a fictitious circular object that has the same area as the crystal being measured. It is equal to [(4xArea)ht]1 /2
- Shape Factor: A measure of how nearly circular a crystal is. It is equal to [471 x AreafPerimeter 2]. A circle and a line have a shape factor of 1.0 and 0.0, respectively. - Compactness: An alternative method for assessing the degree of circularity of a crystal. It is given by [Perimeter 2/Area]. The compactness for a circle is about 12.6 and increases to infinity for a line.
- Major Axis Length: This the length of the line that binds the two pixels that are the farthest apart in the grain boundary.
- Major Axis Slope: Angle between the major axis and an horizontal line on the scanned image. This value is equal to: tan -' ftMajY2 - MajY1 )/(MajX 1 - MajX2
)I
where (MajX 1, MajY1 ) and (MajX2, MajY2) are the co-ordinates of the two end points.4) The c-axis orientation of the crystals in all sections was measured with a universal stage. These were corrected for refraction indices and plotted on a lower hemisphere equal area projection (Schmidt net). Also, the projection of the c-axis of each crystal onto the plane of observation was plotted against the major axis slope of this crystal to inspect for a possible correlation between crystallographic orientation and preferred dimension.
ft1*iU1
Statistics
Over a thousand crystals were examined. The results of the analysis is shown in Fig. 2. One of the most noticeable feature in this figure is the lack of textural variability with depth. A distinctly unimodal distribution predominates, with a general tendency towards a positive skewness. This is exemplified in Fig. 3, in which:
- The mean area = A where A 1 is the area of each crystal and N is the number of crystals. - The median area represents the middle value, that is the score above and below which one-half of the frequencies falls.
The median does not diverge from the mean in excess of 30% the value of the standard deviation. This is the case for all the variables shown in Fig. 2.
In Fig. 4, the variation with depth of the mean Feret Diameter is shown and compared with the observations gathered manually by Jeffries et al. [7]. The digitised data has a similar trend but is less erratic. The variation of the mean perimeter is also displayed.
Crystal morphology is best described with reference to a circle. For a given perimeter, an object that is circular in shape will enclose the largest area. Knowledge of the area and the perimeter, both
—
j 1t•,,
1-Jj
MW
E
I
Perimeter Area
Diameter
(mm)
(sq. mm )
(mm)
MaJor axis
Shape
Oom
slope (x)
Factor pactness vs caxes
orient.
(y)
6
124
96
oivj--
00
M11
F
'411
t 4fr
217
1 2 1 21L
LFig. 2: Textural and orientation data.
independent variables in this study, allows to estimate the morphology of a crystal in terms of 1) the degree of smoothness of its boundai. and 2) its aspect ratio. This is schematised in Fig. 5 where three obiccts are depicted with identical perimeters. It can be seen that the circle in (a) encloses more area than the object with a ragged boundary (b). or the one with a high aspect ratio (c).
The shape factor and the compactness are two closely related variables measuring the extent to which the relationship between the area and the perimeter for a given object departs from that of a circle.
U 10 E 20 0) 0 30 40 0 10 20 30 40 50 60 70 80 2 MM E 1 Mean area (with S.D.)
13 Median area
Figure 3: Variation with depth of the average area (S.D.: standard deviation).
F--- Feret diameter (with S.D.) 0 Diameter (Jeffries et al, 1 990)
F-A-i Perimeter (with S.D.) 0 10 E Cl 20 0) 0 30 40 0 10 20 30 40 Mean (mm)
Figure 4: Variation of diameter and perimeter with depth (S.D.: standard deviation).
(C)
Figure 5: The morphology of a crystal may be expressed with reference to the shape of a circle. Objects a, b and c have the same perimeter. See text for discussion.
1
-'~I'l-,
iff
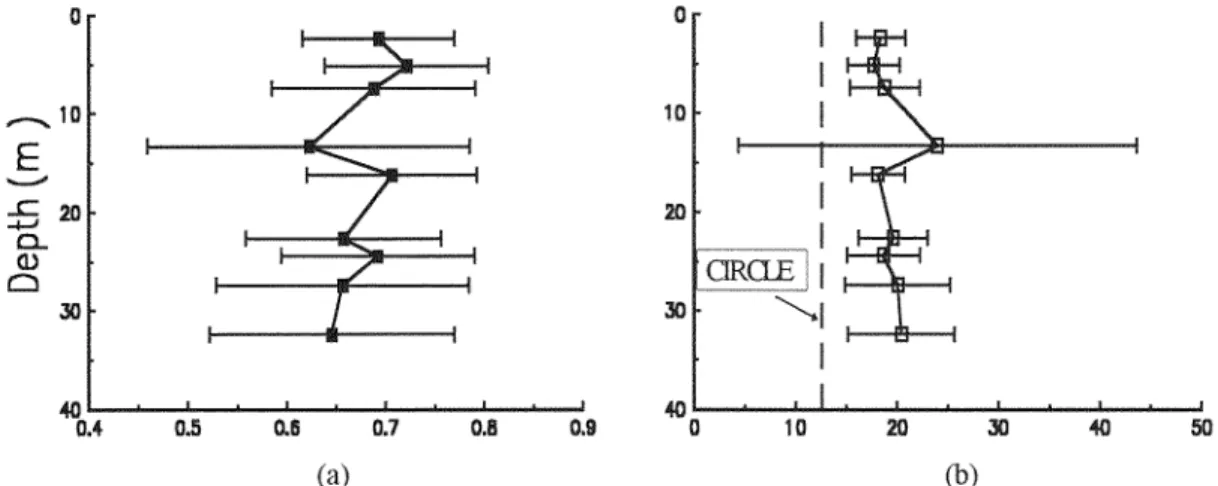
0.5 0.8 0.7 0.8 019 (a) 40 - 0 10 20 30 40 50 (b)Figure 6: (a) Variation of the mean shape factor with depth. A circle has a value of 1. (b) Variation of the mean compactness with depth. The vertical dashed line represents the value for a circle.
The standard deviation is shown for both variables.
The mean value for these variables is plotted with depth in Fig. 6.
In Fig. 5, object (b) could have been drawn to contain the same area as (c), still with the same perimeter. This is noteworthy since it implies that knowledge of the area and perimeter alone will not distinguish between the possibilities depicted in (b) or (c). For that purpose, it is necessary to resort to a third independent variable: the length of the major axis of the object. When divided with the feret diameter, it provides a scale ranging from 1 (a circle) to infinity (a line). This is shown in Fig. 7. Crystals with an irregular contour but with a stubby shape will lie near the minimum ratio. Crystals with an elongated shape and a linear contour will be represented at the other end of the scale.
The size and the shape variables at each site were plotted against each other. They showed no correlation.
A
4N,
I]
I
: ~,~
40
L ---- _LJ_L_J1,0
ii
1.2
1,3
1,4
1,5
1,6
Major axis Iength/Feret Diameter
Figure 7: Variation with depth of the mean length of the major axis divided with the mean Feret Diameter. A circle corresponds to a value of 1.00. An equal-sided hexagon has a value of 1.10.
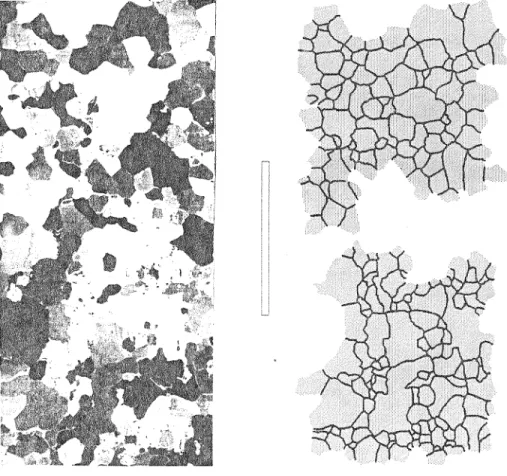
Figure 8: Texture in a vertical section from a depth of 5.1 in The diagram at right shows the configuration of the grain assemblage. The 10001] orientation for
Texture
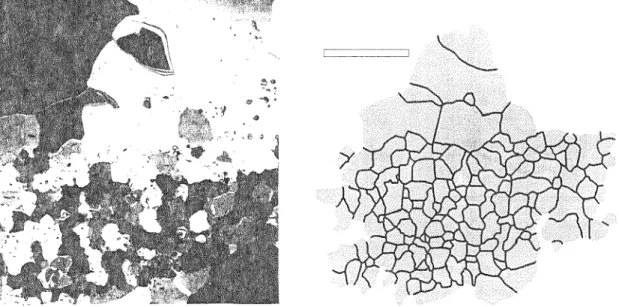
Visual examination of the ice samples in thin section allowed the identification, in both vertical and horizontal sections, of two textural end-members. These are distinguished mainly on the basis of boundary morphology. One consists of an assemblage of crystals with flat boundaries and from 6 to 8 sides (Fig. 8). Triple junctions are common and the grain sizes are uniformly distributed. At the other end of the scale is an amalgamation of irregularly shaped interdigitating grains of all sizes. The larger crystals tend to be separated from each other by smaller ones arranged in belts' (lower part of Fig. 9). These correspond to the second and last site, respectively, from the top of the core. It can be seen in Fig. 6 that the mean shape factor and compactness for these sites are nearly at opposite ends of the range. There appears to be no particular pattern in the occurrence of these textures with depth.
Both textural types grade into each other within a distance of a few centimetres. In Fig. 9. for instance, the upper part of the section is a compromise between the two types of texture mentioned above.
Air bubbles were observed in all sections, both within cnstals and along boundaries. They , do not exceed 5 mm in size, with an average lying below 1 mm. No systematic study of their shape was conducted. They generally have a circular outline in both the vertical and horizontal sections. Locally. however, they are preferably oriented with their long axis parallel to the core axis. The shape of intracrystalline bubbles often line up, indicating some control from the lattice structure as they formed. This subject was not explored in detail. A high bubble density was observed in two layers, of 10 and 30 mm in thickness. The latter is displayed in Fig. 10. These occur in a zone of a significantly smaller grain size. -
-.'
-
P
)
c
r'-
_______
V
Figure 9: Texture in a vertical section from a depth of 32.4 in. The diagram at right shows the configuration of the grain assemblage. Scale is 50 mm.
Figure 10: Texture in a vertical section from a depth of 27.4 m. The diagram at right shows the configuration of the grain assemblage. Scale is 20 mm.
Lattice orientation
The c-axes orientation at all but one site defines a single maxima parallel to the length of the core, with concentrations achieving 7 to 11% per 1% area (Fig. 11). Plots relating the angle of the major axis with respect to an horizontal line on the scanned image (Fig. 2, right-hand column) failed to decipher a correlation between these two variables. Similarly, crystal orientation appears independent of their size (Fig. 12).
VERTICAL AXIS
Figure ii: Contoured stereographic (Schmidt) projection displaying the [0001] orientation of 150 crystals in a vertical thin section, at a depth of 5. 1 m. below the surface. The contour values are in
percent per 1% area. ci
300 250 C4 E 200 E o 150 a) 100 0 10 20 C) (. 30 40 50 60 70 80 90 Angie a in degrees
Figure 12: Plot relating the area of the crystals and the angle a of their [0001] axis with the horizontal, projected on the scanned image, In the left-hand diagram, arrows represent
the trend and plunge of this axis for an arbitrary assemblage of crystals.
IWflIt,X1
The size, shape and [00011 orientation data gathered at nine sites along the length of the core show little variation with depth. Textural observations demonstrate that if a systematic variation exists, it would have to occur at a small scale. A much larger sampling frequency would thus be required for its identification. In any case, this corroborates the results of mechanical tests conducted on this core which provided no indication of a dependency of ice strength with depth, at a constant temperature [8]. It also suggests a common origin of the ice throughout the thickness of the strata that was sampled by the core auger.
The core was extracted from an ice stratum interpreted to be of a depositional-superimposed origin [4]. Melt water produced during the warm season percolated downward through the underlying snow and firn layers and refroze at some depth where the temperature permitted it [10]. A correspondence between the abundance of bubbles and a small grain size favours this hypothesis: both features are expected to occur as a consequence of rapid freezing of water at a given level in the ice stratigraphy (R. Koerner 1994 pers. comm.). Columnar-shaped crystals, however, reported in the past [3,4] as evidence for the occurrence of melt puddles at the surface of the Ward Hunt Shelf, were not observed at any of the sites examined in this study.
The consistent development of a [0001] single maxima throughout the length of the core is intriguing. A similar fabric was repeatedly observed in polycrystalline ice specimen deformed under a uniaxial compressive load or simple shear [11-14]. It was also reported from glaciers and other natural ice, where it was induced by the weight of the overlying ice column and/or an internal shear gradient [11,15-16]. If the single maxima documented in this paper is to be accounted also by a given stress regime, we must envisage the possibility that the present Ward Hunt ice shelf once defined the base of a thicker sheet. Removal of a load-generating cover of undetermined thickness, through a period of negative balance R. Koerner 1994 pers. comm.), would have been responsible for the fabric now occurring near the very top of the sheet.
*
Snow
'T7'
•iT\ SE:.tliiflg*
Depositional
-
surface
-
-
- -
-
---
-
*
*
*
*
*
Snow
*
*
*
Depositional surface-
•
#
..*-
'
:
Incre in_Z
pressure—
-a-
Figure 14: In this model, a preferred lattice orientation also originates early in the formation of the ice shelf. The alignment, in this case, is caused by the weight of the overlying snow column.
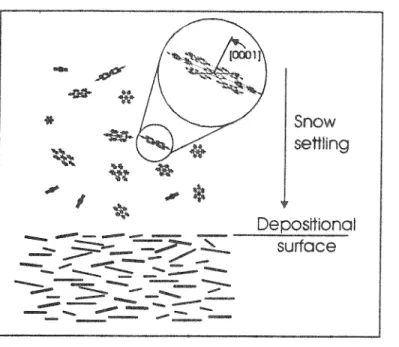
Alternatively, the observed lattice orientation pattern may have been initiated early in the history of deposition. This hypothesis is supported by the work of Koerner [10] who reported the development of a similar fabric 0.8 metres below the upper surface of an ice cap. It could have occurred in either of two ways. One possibility is that snow flakes, which have a two-dimensional shape perpendicular to the
[00011 axis, were 'stacked' as they settled with a slight tendency toward parallelism with the depositional surface (Fig. 13). A rather complex reciystallisation episode may have ensued in the process of percolation and freezing of the melt water, but without significantly modifying the lattice orientation. The snow crystals could, in fact, have acted as orienting agents or 'seeds' during recrvstallisation. The second possibility is similar to the first one with the difference that the preferred alignment was mechanically induced by the overburden pressure, which increased with the thickness of the overlying snow column (Fig. 14). This is reminiscent of the process invoked by Sinha [17] for the production of 'oriented' frazil ice.
This leads to the following questions: Under what conditions and, in the case of the second hypothesis, where in a given snow-ice column should we expect this fabric to form? What are the potential consequences of this preferred lattice orientation on the mechanical properties of a snow-firn-ice transition, particularly when this transition rests on an inclined surface?
ACKNOWLEDGEMENTS
The interpretation of the data benefited from phone conversations with R. Koerner, of the Geological Survey of Canada, and M. Jeffries, of the University of Alaska Fairbanks. The work was partly supported by a grant from the Natural Sciences and Engineering Research Council of Canada.
I1aW1[
[1] Thomas R.H. 1979. J. Glac. 24, 273-286
[2] Wade F.A. 1945. Proc. Am. Phil. Soc. 89, 160-173
[3] Ragle R.H., Blair R.G. and Persson L.E. 1964. J. Glac. 5, 39-59.
[4] Jeffries MO., Serson H.V., Krouse H.R. and Sackinger W.M. 1991. J. Glac. 37, 247-260. [5] Robin G.Q. 1979. J. Glac. 24, 259-272,
[6] ReehN. 1968. J.Glac. 7,215-232.
[7] Jeffries MO., Sinha N.K. and Sackinger W.M. 1990. Proc. 10th IAHR Ice Symposium, Espoo, Finland, 238-251.
[8] Jeffries MO., Sinha N.K. and Sackinger W.M. 1990. Proc. 9th OMAE Conference, Houston, Texas, U.S.A., 4, 223-229.
[9] SinhaN.K. 1977. J. Glac. 18. 315-323. [10] KoernerR.M. 1968. J. Glac. 7,421-430.
[11] Budd W.F. 1972. Zeitschrift Gletsch. Glazialgeol. 8, 65-105. [12] Bouchez J.L. and Duval P. 1982. Textures & Microstr. 5, 171-190. [13] JackaT.H. and Maccagnan M. 1984. Cold Reg. Sci. Tech. 8,269-286. [14] Azuma N. and Higashi A. 1985, Ann. Glaciol. 6, 130-134.
[15] Rigsby G.P. 1960. J. Glaciol. 3, 589-606.
[16] Gow A.J. and Williamson T. 1976. CRREL rep. 76-35, 25pp. [17] Sinha N.K. 1986. J. Materials Science 21, 1533-1546.


![Figure 12: Plot relating the area of the crystals and the angle a of their [0001] axis with the horizontal, projected on the scanned image, In the left-hand diagram, arrows represent](https://thumb-eu.123doks.com/thumbv2/123doknet/14224644.484352/11.909.163.735.119.379/figure-relating-crystals-horizontal-projected-scanned-diagram-represent.webp)