HAL Id: ird-00493450
https://hal.ird.fr/ird-00493450
Submitted on 23 Jul 2010
HAL is a multi-disciplinary open access archive for the deposit and dissemination of sci-entific research documents, whether they are pub-lished or not. The documents may come from teaching and research institutions in France or abroad, or from public or private research centers.
L’archive ouverte pluridisciplinaire HAL, est destinée au dépôt et à la diffusion de documents scientifiques de niveau recherche, publiés ou non, émanant des établissements d’enseignement et de recherche français ou étrangers, des laboratoires publics ou privés.
Population genetics and social organization of the sperm
whale (Physeter macrocephalus) in the Azores inferred
by microsatellite analyses
Ana Pinela, Sophie Quérouil, S. Magalhaes, M. A. Silva, R. Prieto, J. Matos,
R. S. Santos
To cite this version:
Ana Pinela, Sophie Quérouil, S. Magalhaes, M. A. Silva, R. Prieto, et al.. Population genetics and so-cial organization of the sperm whale (Physeter macrocephalus) in the Azores inferred by microsatellite analyses. Can. J. Zool., 2009, 87, pp.802-813. �10.1139/Z09-066�. �ird-00493450�
Population genetics and social organization of the sperm whale
(Physeter macrocephalus) in the Azores inferred by microsatellite
analyses
A. M. PINELA1,A , S. QUÉROUIL1,B, S. MAGALHÃES1, M. A. SILVA1, R. PRIETO1, J. A. MATOS2&R.S.SANTOS1
(1) IMAR (Instituto do Mar) & Department of Oceanography and Fisheries, University of the Azores and ISR-Associated Laboratory, Cais Santa Cruz, 9901-862 Horta, Azores, Portugal.
(2) GBM - Molecular Biology Group/Dept. Biotechnology, INETI, Estrada do Paço do Lumiar 22, 1649-038 Lisboa, Portugal.
A. Present address: Departament de Biología Animal (Vertebrats), Facultat de Biologia, Universidad de Barcelona, Avinguda Diagonal 645, 08071 Barcelona, Spain. Tel: (+34) 93 402 14 53, Fax: (+34) 93 403 44 26, e-mail: anapinela@ub.edu
B. Present address: IRD – GAMET, UR175 CAVIAR, 361 Rue Jean François Breton BP5095, 34196 Montpellier Cedex 5, France.
Abstract (English)
In the Northeast Atlantic Ocean, the archipelago of the Azores is frequented by female-offspring groups of sperm whales (Physeter macrocephalus L., 1758), as well as large males. Little is known on their population and group structure, even though the Azores apparently constitute both a feeding ground and a reproduction site. We analysed 151 sloughed skin and biopsy samples by genetic tagging with 11 microsatellite loci and molecular sexing, in order to: determine the population genetic structure, compare relatedness within and between social groups, estimate kinship and the age of males at dispersal. Results suggest that individuals visiting the archipelago of the Azores belong to a single population. High genetic diversity and absence of inbreeding suggest that the population is recovering from whaling. Individuals sampled in close association are highly related, as well as those observed in the same area on the same day, suggesting that secondary social groups (corresponding to the union of primary social units) are composed of relatives. Probable mother-offspring and full-sibling pairs were identified. We obtained an estimated value of 16.6 years for the age of males at dispersal, which was well above previous estimates for this species.
Abstract (French)
Dans l’Atlantique Nord-Est, l’archipel des Açores est fréquenté par des groupes de cachalots (Physeter macrocephalus L., 1758) femelles avec leurs petits et par des grands mâles. Il semble que les Açores constituent à la fois un site d’alimentation et un site de reproduction, mais la structure des populations et la composition des groupes sociaux sont peu connues pour cette région. Nous avons analysé 151 échantillons de peau de cachalot (peau desquamée et biopsies) par "genetic tagging", en utilisant 11 marqueurs microsatellites, et par sexage moléculaire. Nos objectifs étaient de déterminer la structure génétique des populations, de comparer le degré d’apparentement au sein des groupes et entre groupes, et d’estimer les relations de parenté entre individus. Nous avons aussi estimé l’âge des mâles à la dispersion. La valeur obtenue de 16,6 ans représente un âge très avancé par rapport aux estimations disponibles pour cette espèce. Les résultats suggèrent que les individus fréquentant les Açores appartiennent à une seule et même population. La diversité génétique élevée et l’absence de consanguinité suggèrent que la population est en phase de récupération suite à l’arrêt de la chasse "à la baleine". Les individus échantillonnés ensemble sont fortement apparentés, de même que ceux observés dans une même zone géographique au cours d’une même journée. Les groupes sociaux secondaires regroupant plusieurs unités primaires seraient donc composés d’individus apparentés. Plusieurs paires probables de mères et enfants et de frères et sœurs véritables ont été identifiées. Des preuves indirectes de fidélité au site confortent l’hypothèse que les Açores constituent un site d’alimentation. Par ailleurs, l’observation de mâles adultes étaye l’hypothèse que l’archipel constitue aussi un site de reproduction. La fidélité au site des femelles permettrait des appariements successifs entre une même paire d’individus, ce qui expliquerait la présence de frères et sœurs véritables.
Introduction
Mammalian social structures are highly diversified and can be very complex (Whitehead 1997). Cetaceans are no exception to the rule, with associations ranging from mother-offspring pairs occasionally interacting on feeding/breeding grounds, as in baleen whales (Bannister 2002), to tight associations, sometimes with stable matrilineal groups or with male-male competition to access females hierarchically, as in some toothed whales (Connor et al. 1998).
The sperm whale (Physeter macrocephalus L., 1758) presents a highly complex social structure (Whitehead and Kahn 1992), which includes both stable groups tied with social bonds as well as temporary aggregations of such groups with possibly unrelated individuals (Lettevall et al. 2002). The most common social group is the so-called “primary” social group, which is composed of adult females, sub-adults, and calves of both sexes. These groups are stable and partially matrilineal (Richard et al. 1996a). They are limited to low latitudes and unlikely moving between oceans (Bond 1999; Lyrholm et al. 1999). Additionally, they show evidence of site fidelity (Whitehead et al. 1992), which results in genetic differentiation between populations (Lyrholm and Gyllensten 1998). Several primary social groups can aggregate and form secondary social groups. The fusion of social groups may be an indirect consequence of the aggregation of individuals sharing common migration routes (Christal et al. 1998), or a strategy to enhance feeding success (Whitehead 1989) or to protect juveniles against predators (Whitehead 1996).
As in most mammalian species, sperm whale dispersal is characterized by female philopatry and male dispersal (Greenwood 1980). Off the coast of Ecuador, immature males seem to disperse from their natal group at an average age of six years (Richard et al. 1996a). On the coast of Scotland and Ireland, males would disperse later, at an average age of nine to ten years (Mendes et al. 2007). After dispersal, males live in bachelor groups for a few years, then become solitary (Whitehead 2003). Mature males spend most of their time at high latitudes, occasionally travelling to lower latitudes to mate (Whitehead 2003). During the mating season, large adult males can be observed in association with primary social groups for short periods of time (Whitehead 1993).
The archipelago of the Azores, situated in the North Atlantic, is composed of nine islands distributed in three groups. It is frequented by more than 20 species of cetaceans, including sperm whales (Gonçalves et al. 1996; Magalhães et al. 2002; Silva et al. 2003). The regular occurrence of sperm whales at short distance from the coast has allowed the development of a whaling industry during two centuries, which was replaced by a growing whale-watching industry since 1992 (Magalhães et al. 2002). Population size was estimated to a maximum of 2500 individuals during a photo-identification survey conducted in the central group of islands in 1988-1995, which suggested that the population had not recovered from whaling times (Matthews et al. 2001). The archipelago is frequented both by female-offspring groups and by large males, and it is believed to constitute both a feeding/nursing ground and a mating/reproduction site (Clarke 1956; Matthews et al. 2001). While females and offspring are present in the Azorean waters during summer only, large males can be observed all year long. Females are believed to come from southern latitudes and males from northern latitudes, so that the Azores would be at the intersection between the geographical ranges of both sexes. However, migration patterns are still poorly understood, and little is known of the population and group structure of sperm whales in this area.
Traditionally, social structure was investigated by direct observation. However, this method provides limited information for marine mammals performing long deep dives, such as sperm whales (Lettevall 2003). Alternatively, molecular genetic methods constitute a powerful tool for the study of social structure. They provide information on the genetic relationships, degree of differentiation and amount of gene flow between population units, as well as on the degree of relatedness and kinship between individuals. They can also unravel population subdivisions that may have important implications for the management of populations (Lande 1991). Hyper-variable nuclear markers, such as microsatellites, allow genetic identification of individuals from a set of non-identified samples (Richard et al. 1996a). These markers are particularly valuable to identify paternity, since paternity is usually impossible to ascertain in the wild (Nielsen et al. 2001). Few studies based on microsatellites were dedicated to the sperm whale (Richard et al. 1996a,b, Bond 1999, Lyrholm et al. 1999). The social structure of groups of females and immature individuals has been studied in Sri Lanka (Gordon 1987), off mainland Ecuador (Whitehead and Kahn 1992), in the southeast Caribbean (Gordon et al. 1998) and off the coast of northern Chile (Coakes and Whitehead 2004), but none of these studies used genetics as a tool to analyse relatedness and relationships between individuals and social groups.
We used microsatellite markers to investigate the population genetics and social organization of sperm whales in the Azores. Our objectives were to 1/ investigate the genetic structure of groups of sperm whales sampled around different island groups and in different years; 2/ compare relatedness within and between social groups; 3/ estimate kinships between individuals. Incidentally, we also estimated the age at which males disperse from the primary social groups.
Material and methods Study site
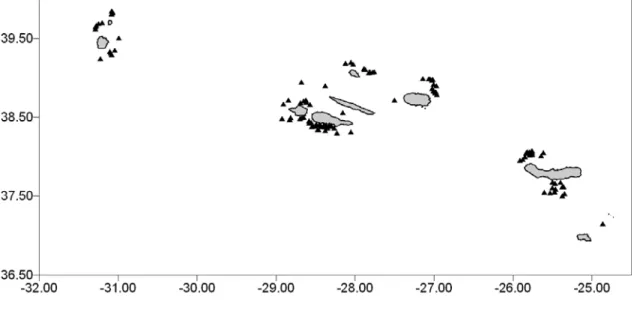
The study was conducted in the archipelago of the Azores (Portugal), which is located in the Northeast Atlantic Ocean, extending more than 480 km along a northwest-southeast axis and crossing the Mid-Atlantic Ridge. The Azores are composed of nine volcanic islands divided into three groups – eastern, central and western - separated by deep waters (ca. 2000 m) associated to deep topographic profiles with scattered seamounts (Santos et al. 1995, Figure 1).
Sampling
One hundred and fifty one skin samples were collected between May 2002 and August 2004 in the three groups of islands (Figure 1). Samples consisted in sloughed skin (n=101), biopsies collected on live animals with a 125-lb Barnett crossbow and arrows and darts specially designed for cetaceans by F. Larsen, Ceta-Dart (n=49) and one biopsy from a stranded individual. Samples were stored either in a 20% dimethyl-sulfoxide (DMSO) solution saturated with salt (n=62), or in 90% ethanol (n=89). The majority of the samples was collected in the central group of islands (n=86), followed by the eastern group (n=46) and the western group (n=19). At each sighting, information was collected on time and location, weather conditions, animal behaviour, and group size and composition. Photographs were also taken for a photo-identification survey.
Molecular methods
Extractions were performed following the protocol of Gemmel and Akiyama (1996). Around 1-2 cm2 of sloughed skin or 1-2 mm3 of biopsy skin were minced and rinsed in dd-water prior to extraction. The proteinase K digestion was extended overnight at 37°C. The LiCl2 precipitation and chloroform extraction were done as
described in the original paper.
In order to determine the sex of individuals, a short fragment of the CSY gene (157 bp) located on the Y chromosome was analyzed following the protocol of Abe et al. (2001). The tetranucleotide microsatellite locus GATA028 (117-129 bp, Palsbøll et al. 1997) was used as a PCR control for positive identification of females.
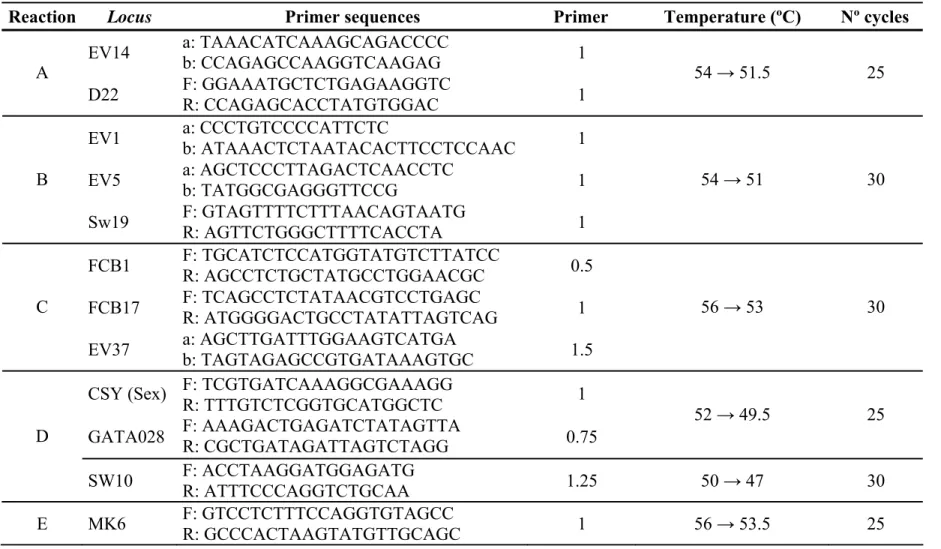
Eleven polymorphic microsatellite loci were analysed: D22 (Shinohara et al. 1997), EV1, EV5, EV14, EV37 (Valsecchi and Amos 1996), FCB1, FCB17 (Buchanan et al. 1996), GATA28 (Palsbøll et al. 1997), MK6 (Krutzën et al. 2001), SW10 and SW19 (Richard et al. 1996b). Up to three loci were amplified simultaneously in multiplex PCR reactions and/or loaded simultaneously on the sequencer (Table 1). Unsuccessful PCR reactions were repeated up to three times. DNA extraction and genotyping were repeated whenever a sample was found not to amplify, to give low PCR yields, or to be homozygous at more than three loci. Samples that could not be re-analysed successfully were removed from the data set.
Samples were analyzed at INETI, Portugal. DNA fragments were scanned on an ABI 310 capillary sequencer using the size marker ROX350 (Applied Biosystems, Foster City, USA). Fragment length was read with the software GenScan 3.1.2. (Applied Biosystems, Foster City, USA).
Data analysis
Detection of replicated samples
All the genotypes were checked for potential errors and replicated samples using Microsatellite Toolkit (Park 2001). This preliminary step was fundamental because of the high probability of collecting and analysing several sloughed skin pieces from the same individual. We considered that two samples potentially came from the same individual when at least 90% of their alleles were identical. Samples meeting this criterion were re-amplified in order to determine whether differences were genuine or due to amplification errors. In all cases, the samples turned out to be from the same individual.
Sex ratio and age of males at dispersal
The population sex ratio was calculated for the whole dataset, as well as for female-offspring groups after removal of the mature male samples (identified in the field owing to their large size and morphological distinctiveness) and of the sample obtained from a stranded individual. The age at which males disperse from their natal group was estimated based on the method proposed by Richard et al. (1996a). This method allows estimating the age at dispersal from the sex ratio of female-offspring groups, assuming an equilibrium population with equal proportions of both sexes at one year of age and a constant mortality rate for each sex. Population parameters used in the model were those estimated by the International Whaling Commission (1982).
Polymorphism control
Polymorphism was estimated as the number of alleles per locus (K), observed heterozygosity (HO), unbiased expected heterozygosity (HE), and polymorphic information content (PIC, Hearne et al. 1992). This last measure is representative of the diversity found at each locus and is based on expected heterozygosity and the number of alleles (Slate et al. 2000). It was calculated using Cervus 2.0 (Marshall et al. 1998). This software was also used to estimate the frequency of null alleles for each locus, under the assumption that all deviation to the Hardy-Weinberg Equilibrium (HWE) was due to null alleles (Summers and Amos 1997). For loci presenting a high estimated level of null alleles, all homozygote samples were re-analysed, but few heterozygotes were unravelled. The HO, HE and the locus-specific heterozygosity index (FIS, Weir and Cockerham 1984) were calculated with Genetix 4.03 (Belkhir et al. 2001). FIS was also calculated for all loci and for the whole population, and its significance estimated by simulations (10000 permutations). Departure from HWE was tested with Arlequin 3.0 (Excoffier et al. 2005) using an analogue of Fisher's exact test. A successive sequential Bonferroni correction was applied to determine the level of significance for deviation to the HWE (Rice 1989).
In order to detect potential past fluctuations in population sizes, we tested for the existence of a significant excess or deficit of heterozygosity using the program Bottleneck 1.2 (Cornuet & Luikart 1996). A significant excess of heterozygosity (or "gene diversity") is expected under a situation of recent bottleneck, while a significant deficiency is expected under population expansion. Significance was evaluated by the Wilcoxon sign-rank test. Simulations were based on the Two Phase Model of evolution of microsatellites (TPM, DiRienzo et al. 1994), with default parameters.
Population structure
First, in order to verify whether there was any geographic population structure in the Azores, the samples were separated according to groups of islands. Second, given that individuals from different populations could frequent the archipelago in different years, the samples were partitioned between years. As genetic relatedness between individuals travelling together may cause inflated statistical significance in geographical comparisons (cf. Lyrholm and Gyllensten 1998), population structure was estimated first using the whole data set, then using a restricted data set with one randomly chosen individual per social group of level 2 (see below for the definition of group levels). This choice was motivated by the results of the relatedness analyses (see Results). Genetic differentiation among putative populations was assessed based on the infinite allele model (IAM; FST, Weir and Cockerham 1984) using Genetix 4.03 (Belkhir et al. 2001), and the stepwise mutation model (SMM; RST, Slatkin 1995) using RstCalc (Goodman 1997). For the latter, data were standardized in order to compensate variance differences between loci. FST and RST significance was estimated by simulations (10000 permutations).
Social structure
Social groups were defined based on observations made at sea rather than on long-term data on individual associations. This strategy was adopted because it was not possible to obtain photographs from all the individuals in a group and because samples of sloughed skin often could not be related to a given individual. Three levels of hierarchically embedded social groups were defined. All individuals sighted together at a given time and location were considered to belong to the same group of level 1. These small units were grouped into groups of level 2, when they were observed in the same
area on the same day. The individuals observed in the same area but on consecutive days were grouped in groups of level 3. Photographs were used to refine the definition of social groups of level 1. They allowed grouping individuals that had been sampled on their own with other individuals they had been observed with on the same day. Following this classification, we defined 98 groups of level 1, 48 groups of level 2 and 38 groups of level 3.
For each group level, the average coefficient of relatedness (r, Queller and Goodnight 1989) and its variance (var, Ritland 2000) were calculated both within and among groups, using SPAGeDi 1.2 (Hardy and Vekemans 2002). The significance of the mean r-value was estimated based on 10000 permutations of individuals among sampling categories (within versus between groups).
To estimate the genetic variance within and among social groups, an analysis of molecular variance (AMOVA) was performed using Arlequin 3.0. The hierarchical population structure was predefined using groups of level 2 and 3. Groups of level 1 were not used since only one individual was genetically identified in most of these groups. Significance was estimated through simulations (10000 permutations).
Kinship analyses
We used Kinship 1.2 (Queller and Goodnight 1989) to assess the genetic relationships between individuals and identify potential parent-offspring, full-sibling and half-sibling pairs. This program performs maximum likelihood tests of pedigree relationships between pairs of individuals in a population, by computing likelihood ratios between a primary hypothesis (H1) and a null hypothesis (H0). Hypothetical relationships are specified by setting the proportion of alleles that related individuals share by maternal (rm) or paternal (rp) transmission. Males and females were treated indistinctively. The significance threshold was determined by simulations (10000 permutations). Because Kinship tends to overestimate the level of confidence (Jones and Ardren 2003), the null hypothesis was never set to “unrelated” (i.e. rm=rp=0) and the significance threshold was set to p<0.01.
Results
Preliminary analyses
From the 151 samples available, 10 sloughed skin samples (6.6%) could not be analysed because DNA failed to amplify due to poor quality or insufficient quantity. Three of these samples were stored in ethanol and seven in DMSO. All samples collected by biopsy darting were successfully analyzed, independently of the preservative. The amplification success was higher for samples stored in ethanol (96.6%) than for samples preserved in DMSO (88.4%).
After checking the results for repeated individuals, 113 individual sperm whales were genetically identified, indicating that 80.1% of the successfully analysed samples were from distinct individuals. There was one occurrence of two biopsy samples belonging to the same individual. All the other replicated samples were sloughed skins. Taking into account both the amplification success and the number of distinct individuals, the efficiency of biopsy darting was 98% and that of skin swabbing was 63.4%.
With respect to the temporal and spatial distribution of repeated individuals, most of them belonged to the same group of level 1 or 2. There was one occurrence of
samples collected from the same individual in the same area on consecutive days (group level 3). There were also two cases where the samples had been collected in the same area with one or two week intervals.
Sex ratio and age of males at dispersal
Molecular sexing indicated that more females than males were sampled around the Azores, with 44 males and 69 females, and a male to female proportion of 1:1.57. After removal of the four mature males and the stranded individual, the male to female proportion increased to 1:1.77. Based on this value, the estimated age of males at dispersal was 16.6 years.
Microsatellite variability
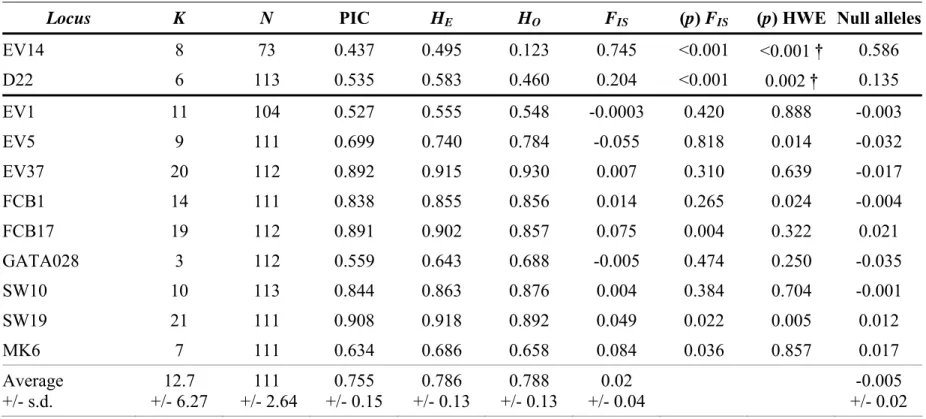
Several locus-specific measures were calculated for each of the 11 loci analyzed (Table 2). The loci EV14 and D22 were not in Hardy–Weinberg equilibrium after application of a sequential Bonferroni correction. Both loci presented a significant heterozygote deficiency (p–FIS<0.05) and a high estimated frequency of null alleles (Table 2). They were excluded from the dataset. The nine remaining loci presented a high level of allelic diversity, with 12.7 alleles per locus on average, despite the low variability of the locus GATA028 (Table 2). Most loci had a high expected heterozygosity and PIC (Table 2). The inbreeding coefficient calculated for all loci was not significant (FIS=0.021), but altogether, the nine loci showed significant heterozygosity excess (p Wilcoxon one-tailed = 0.007).
Population structure
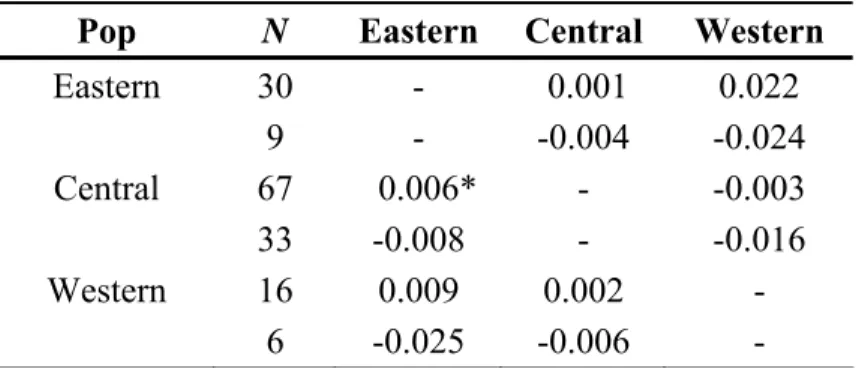
When analyzing all the individuals FST and RST fixation indices revealed no population differentiation within the Azores, apart from a low but significant FST-value (p<0.05) between the central and eastern groups of islands (Table 3). When analyzing only one member of each group of level 2, all indices were negative, indicating higher diversity within than between groups, and thus a complete lack of population differentiation (Table 3).
Significant differentiation between the three sampling years was found based on
FST (all p<0.01), while RST only revealed a significant difference between the animals sampled in 2003 and 2004 (Table 4). Comparisons involving the year 2004 presented the highest levels of differentiation. When analyzing only one member of each group of level 2, none of the FST and RST fixation indices were significantly different from zero (Table 4).
Social structure
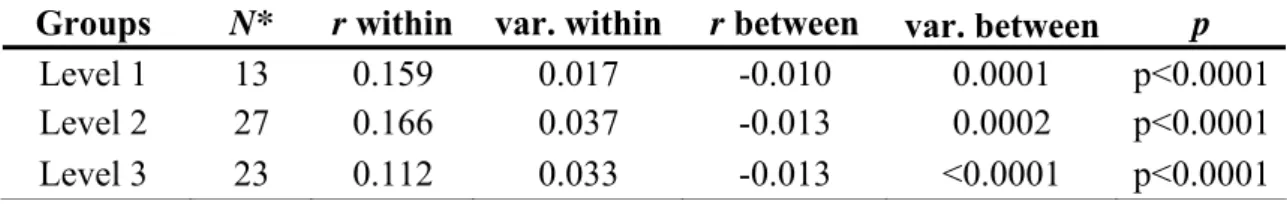
The average coefficient of relatedness (r) between all the individuals was -0.009. The mean r-value was the highest within groups of level 2 (r=0.166), followed by groups of level 1 (r=0.159) and groups of level 3 (r=0.112, Table 5). For each group level, the average degree of relatedness was significantly higher within groups than between groups (p<0.0001, Table 5).
The AMOVA performed on groups of level 2 and 3 showed that the highest amount of genetic variation was found within the groups of level 2 (Vc = 94.18%) and the lowest between the groups of level 3 (Va = 2.67%, Table 6). The percentage of variation between the groups of level 2 within the groups of level 3 was relatively low (Vb = 3.15%). The relative divergence between groups of level 2 was significant (FST=0.058, p<0.0001, Table 6), indicating significant differentiation between groups of individuals seen on the same day and in the same area. The relative divergence between groups of level 2 belonging to the same groups of level 3 (FSC) was also significant (p=0.002, Table 6), meaning that the groups of level 2 were differentiated within the groups of level 3. There was no significant genetic differentiation between groups of level 3 (FCT=0.027, p=0.121; Table 6).
Kinship analyses
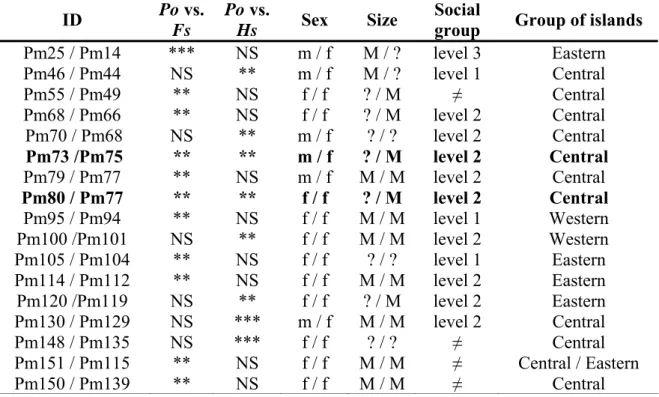
When testing for parent-offspring relationships against the null hypothesis that individuals were full-siblings (true brothers or sisters) or half-siblings (half-brothers or half-sisters), 17 potential parent-offspring pairs were found (Table 7). All the related individuals were sampled in the same area, with one exception (Table 7). Caution in interpreting the results of the tests advises to consider as actual parent-offspring pairs only those pairs that present significant likelihood ratios for both tests. Two pairs of individuals belonging to the same group of level 2 satisfied this criterion (in bold in Table 7). They were probably mothers and offspring, as there was a medium size individual identified as a female in each pair.
When testing for full-sibling relationships against the null hypothesis that individuals were half-siblings or grandparent-grandchild, nine potential full-sibling pairs were found (Table 8). All the related individuals were sampled in the same area with the exception of a pair that was sampled around different groups of islands in different years (Pm18/Pm126). As for parent-offspring, it seems advisable to consider as full-siblings only those individuals that present significant likelihood ratios for both tests. Six pairs of full-siblings could be identified that way (in bold in Table 8). Three of the pairs belonged to the same group of level 2, one pair was from the same group of level 3, another pair was sampled in the same area with a four-week interval, and the last one was sampled in different groups of islands with a two-year interval.
Discussion
All the samples collected by biopsy darting were analyzed successfully and only one replicate was identified. The efficiency of this method was very high (98%). Biopsy darting also has the advantage of allowing individual identification of the animals. Most sloughed skin samples were successfully analysed, confirming that this kind of samples contained enough DNA to perform genetic analyses (cf. Hoelzel and Donovan 1991; Bond 1999). However, the efficiency of this method was relatively low (63.4%). Sloughed skin DNA is often degraded and its quality and quantity are highly variable (Amos et al. 1992). In addition, sloughed skins cannot be related to a given individual, and the number of replicated samples can be high, increasing the time and cost of the genetic analyses. Whatsoever, sloughed skin collection constitutes a good alternative to biopsy darting, especially in areas where whale watching is going on, like in the Azores.
Polymorphism
The microsatellite loci selected for this study presented high levels of allelic diversity when compared to other studies that involved a smaller number of individuals (Richard et al. 1996b; Lyrholm et al. 1999). The significant heterozygozity excess, indicative of a recent bottleneck, likely reflected the historic population decline due to excessive hunting (Whitehead 1998). However, the non significant FIS-value and the
high genetic variability existing within social groups indicated that the population did not suffer from inbreeding. This might be explained by the fact that sperm whales have evolved complex social behaviours, including behavioural mechanisms that minimize inbreeding amongst individuals (Valsecchi et al. 2002; Whitehead 2003). One of these mechanisms is the selective dispersal of males associated to female philopatry (Pusey and Wolf 1996).
Molecular sexing and age of dispersal of male sperm whales
The sex ratio found in this study for the sperm whales frequenting the Azores (1:1.57) was sensibly the same as that reported by Bond (1999, 1:1.56). The observed male to female ratio must be characteristic of the type of groups found in the Azores in summer, which is the season when most samples where obtained in both studies. The age at dispersal for immature males was estimated to 16.6 years in this study. This value is much higher than those obtained by Richard et al. (1996a) and Mendes et al. (2007). The latter results are most likely reflecting the age at dispersal of male sperm whales during whaling times. Discrepancies between studies can also arise from the comparison of populations from different oceans or to the inadequacy of the parameter values used in the present study, as they were inferred during whaling times. It is also possible that, in the Azores, immature males temporarily associate with female-offspring groups during summer.
Population structure
Fixation indices calculated on the complete dataset revealed a significant differentiation between the central and eastern groups of islands (FST but not RST) and between sampling years (FST for all comparisons, and RST for the last two years). The levels of differentiation were very low (below the 0.05 limit defined by Wright 1978) and not biologically meaningful. In addition, differentiation was likely to be due to the sampling of related individuals, as calculations involving a single individual per group of level 2 led to non-significant FST and RST-values both for groups of islands and sampling years. The non significant FIS-value further suggested that all samples were from the same population (no Whalund effect). As a consequence, it seems reasonable to conclude that the individuals who visit the Azores are all part of the same population. It can be assumed that these animals belong to a large population, which is part of the North Atlantic stock.
The lack of clear geographical or annual genetic structure provides indirect evidence of site fidelity to the study area over short periods of time as well as between years, but no fidelity to a specific group of islands. In agreement with these results, photo-identification surveys indicated site fidelity to the central group of islands over periods up to 7 years (Matthews et al. 2001) and use of different groups of islands in different years by some individuals (S. Magalhães, unpublished data). Site fidelity of sperm whales has also been reported based on genetic data in the Galapagos Islands (Whitehead et al. 1992), the archipelago of the Azores (Bond 1999), Gulf of Mexico (Weller et al. 2000) and Balearic Islands (Drouot et al. 2004).
Permanence of individuals in the study area for periods of a few days or weeks, as well as indirect evidence of site fidelity, supports the hypothesis that the Azores represent a feeding/nursing area for female and immature sperm whales during summer. Female site fidelity and association of adult males with primary social groups during summer give credit to the hypothesis that the archipelago of the Azores may also be a reproduction site for this species. Female site fidelity would allow successive breeding between pairs of individuals and explain the occurrence of full siblings in the population.
Social structure
A high degree of relatedness was found within groups of level 1 and 2. The AMOVA indicated that both the groups of animals sighted together (group level 1) and the groups of animals observed in the same area on the same day (group level 2) were genetically differentiated from one another. This means that both the groups of animals sighted together and the groups of level 2 are significantly different from each other. These results imply that the individuals sighted together are highly related, and probably belong to the same social unit or group. The individuals that belong to the same group level 2 probably belong to both different social units and real social units, which reduce the degree of relatedness inside these groups. Nevertheless, the groups are still genetically differentiated from one another revealing that the individuals belonging to these groups are related, despite that some of them may not share kin relationships or social bonds with each other.
The mean degree of relatedness (r=0.166) was that expected for a mix of half and full-siblings (r=0.25 and 0.5, respectively) and less related individuals. It is important to keep in mind that groups were defined based on encounters at sea. The individuals considered to belong to the same group of level 1 or 2 may not actually pertain to the same social unit, as one stable group unit may aggregate with another unit which is not related to it (Christal and Whitehead 2001). Consistently, Richard et al. (1996a) reported that social groups were made of related individuals, but that not all the animals were genetically related within groups. In the Azores, during summer, it is usual to observe a high number of animals concentrated in a small area. These concentrations mainly correspond to feeding aggregations, formed by primary social units and immature males joining to forage. Thus, we can suppose that the mean relatedness between actual group members is higher than the value we obtained.
The degree of relatedness between individuals found in the same area on consecutive days (group level 3) was significantly higher than the mean relatedness of the whole population, but lower than that of individuals observed on the same day. The AMOVA indicated that groups of level 3 were not significantly differentiated from one another. These groups probably correspond to a mixture of social units, characterised by stable long-term social relationships, and unrelated individuals, since these units associate for periods of a few days with other units (Gero et al. 2008). The mechanisms that led to the formation of these aggregations of unrelated individuals have been suggested to be communal defence of the calves from predators and increased vigilance which might be more effective with a set of stable, long-term companions (Gero et al. 2008).
Our results are in agreement with previous studies suggesting that sperm whale primary units off the Azores are mainly composed by members of the same family (Christal and Whitehead 2001), and that individuals travelling together share strong relationships (Whitehead 2003). Individuals observed in the same area on consecutive days may not be travelling together.
Kinship analyses revealed two probable parent-offspring pairs sampled within the same groups of level 2. Owing to the size and sex of the animals, they were likely to be mothers and offspring. Six probable full-sibling pairs were identified, half of which belonged to the same group of level 2. One full-sibling pair was sampled in different groups of islands and in different years. Both individuals could belong to the same social unit that visited different groups of islands in 2002 and 2004, or to different social units, which would imply a dispersal or group fission event. The existence of full-sibling pairs implies successive mating between the same male and female. Mate encounter and re-encounter could occur in the Azores, and be facilitated by female site fidelity. However, site fidelity still has to be demonstrated for males.
Considering the long generation time of sperm whales and the low re-sighting rate in the study area (Matthews et al. 2001; S. Magalhães, unpublished data), our approach helped unravel patterns of relatedness that would have been impossible to infer by direct observation. So far, only a small fraction of the sperm whale population visiting the Azores has been genetically identified. The genetic analysis of a higher number of individuals and a complete sampling of social groups would provide a more detailed picture of sperm whale social organization in the North Atlantic. This should be done in combination with a long-term photo-identification survey, which would also provide information on the dynamics of social groups (cf. Baker et al. 1990; Hoelzel and Donovan 1991). In fact, long term observations are fundamental to confirm whether individuals are integrated permanently or temporarily in a given social group.
Acknowledgements
Authors are grateful to the Portuguese Foundation for Science and Technology (FCT) and the FEDER program for funding the CETAMARH (POCTI/BSE/38991/01) project, M.A.S.’s doctoral grant (SFRH/BD/8609/2002) and S.Q.’s post-doctoral grants (IMAR/FCT-PDOC-006/2001-MoleGen and SFRH/BPD/19680/2004). They also acknowledge FCT and DRCT for pluri-annual funding to Research Unit #531 and to the Associated Laboratory #9 (ISR-Lisboa), and the EU funded program Interreg IIIb/FEDER for funding the MACETUS (MAC/4.2/M10), project and R.P. and S.M.’s grants (IMAR/INTERREGIIIb/MACETUS/MAC1 & 2). Authors acknowledge all the students and staff who contributed to these projects, especially the skippers (P. Martins, V. Rosa, R. Bettencourt and N. Serpa), whose dexterity greatly helped sample collection. Samples were obtained under permits 06/CN/2002, 11/CN/2003 and 3/CN/2004 of the Environment Directorate of the Regional Government of the Azores, in compliance with the current Portuguese law.
References
Abe, H., Goto, M., and Pastene, L.A. 2001. Practical use of multiplex fluorescent PCR for Cetacean sex identification. Mar. Mamm. Sci. 17(3): 657-664.
Amos, B., Whitehead, H., Ferrari, M.J., Glockner-Ferrari, D.A., Payne, R., and Gordon, J. 1992. Restrictable DNA from sloughed cetacean skin: its potential for use in population analysis. Mar. Mamm. Sci. 8: 275-283.
Baker, C.S., Palumbi, S.R., Lambertsen, R.H., Weinrich, M.T., Calambokidis, J., and O'Brien, S.J. 1990. The influence of seasonal migration on the distribution of mitochondrial DNA haplotypes in humpback whales. Nature, 344: 238-240.
Bannister, J.L. 2002. Baleen whales. In Encyclopaedia of marine mammals. Edited by W. F. Perrin, B. Würsig, and J. G. M. Thewissen, Academic Press, San Diego, California, pp. 62–72.
Belkhir, K., Borsa, P., Chikhi, L., Raufaste, N., and Bonhomme, F. 2001. Genetix, a
Windows software for population genetics. Laboratoire Génome, Populations,
Interactions, CNRS UPR 9060, Université de Montpellier II, Montpellier, France.
Bond, J. 1999. Genetic Analysis of the sperm whale (Physeter macrocephalus) using microsatellites. Ph.D. thesis, University of Cambridge, Cambridge, United Kingdom. Buchanan, F., Friesen, M., Littlejohn, R., and Clayton, J. 1996. Microsatellites from the beluga whale (Delphinapterus leucas). Mol. Ecol. 5: 571-575.
Christal, J., and Whitehead, H. 2001. Social affiliations within sperm whale (Physeter
macrocephalus) groups. Ethology, 107: 323-340.
Christal, J., Whitehead, H., and Lettevall, E. 1998. Sperm whale social units: variation and change. Can. J. Zool. 76: 1431-1440.
Clarke, R. 1956. Sperm whales of the Azores. Discovery Rep. 28: 237-98.
Coakes, A.K., and Whitehead, H. 2004. Social structure and mating system of sperm whales off northern Chile. Can. J. Zool. 82: 1360-1369.
Connor, R.C., Mann, J., Tyack, P.L., and Whitehead, H. 1998. Social evolution in toothed whales. Trends Ecol. Evol. 13: 228-232.
Cornuet, J.M., and Luikart, G. 1996. Description and power analysis of two tests for detecting recent population bottlenecks from allele frequency data. Genetics, 144: 2001-2014.
DiRienzo, A., Peterson, A.C., Garza, J.C., Valdes, A.M., Slatkin, M., and Freimer, N.B. 1994. Mutational processes of simple-sequence repeat loci in human populations. Proc. Natl. Acad. Sci. U.S.A. 91: 3166-3170.
Drouot, V., Gannier, A., and Goold, J.C. 2004. Summer social distribution of sperm whales (Physeter macrocephalus) in the Mediterranean Sea. J. Mar. Biol. Assoc. U.K.
84: 675-680.
Excoffier, L., Laval, G., and Schneider, S. 2005. Arlequin ver. 3.0: An integrated software package for population genetics data analysis. Evol. Bioinformatics Online, 1: 47-50.
Gemmel, N.J., and Akiyama, S. 1996. An efficient method for the extraction of DNA from vertebrate tissues. Trends Genet. 12(9): 338-339.
Gonçalves, J.M., Barreiros, J.P., Azevedo, J.N., and Norberto, R. 1996. Cetaceans stranded in the Azores during 1992-96. Arquipelago, 14A: 57-65.
Goodman, S.J. 1997. RST CALC: A collection of computer programs for calculating unbiased estimates of genetic differentiation and determining their significance for microsatellite data. Mol. Ecol. 6: 881-885.
Gordon, J.C.D. 1987. Sperm whale groups and social behaviour observed off Sri Lanka. Rep. Int. Whaling Comm. No. 37.
Gordon, J.C.D., Moscrop, A., Carlson, C., Ingram, S., Leaper, R., Matthews, J., and Young, K. 1998. Distribution, movements and residency of sperm whales off the Commonwealth of Dominica, Eastern Caribbean: implications for the development and regulation of the local whale watching industry. Rep. Int. Whaling Comm. No. 48. Greenwood, P.J. 1980. Mating systems, philopatry and dispersal in birds and mammals. Anim. Behav. 28: 1140-1162.
Hardy, O.J., and Vekemans, X. 2002. SPAGeDi: a versatile computer program to analyse spatial genetic structure at the individual or population levels. Mol. Ecol. Notes.
2: 618-620.
Hearne, C.M., Ghosh, S., and Todd, J.A. 1992. Microsatellites for linkage analysis of genetic traits. Trends Ecol. Evol. 8: 288-94.
Hoelzel, A.R., and Donovan, G.P. 1991. Report of the workshop on the genetic analysis of cetacean populations. In Genetic Ecology of Whales and Dolphins. Edited by A.R. Hoelzel. Rep. Int. Whaling Comm. Spec. Issue No. 13.
International Whaling Commission 1982. Report of the sub-committee on sperm whales. Rep. Int. Whaling Comm. No. 32: 68-86.
Krützen, M., Valsecchi, E., Connor, R.C., and Sherwin, W.B. 2001. Characterization of microsatellite loci in Tursiops aduncus. Mol. Ecol. Notes, 1: 170-172.
Jones, A.G., and Ardren, W.R. 2003. Methods of parentage analysis in natural populations. Mol. Ecol. 12: 2511-2523.
Krützen, M., Valsecchi, E., Connor, R.C., and Sherwin, W.B. 2001. Characterization of microsatellite loci in Tursiops aduncus. Mol. Ecol. Notes, 1: 170-172.
Lande, R. 1991. Applications of genetics to management and conservation of cetaceans.
In Genetic Ecology of Whales and Dolphins. Edited by A.R. Hoelzel. Rep. Int. Whaling
Comm. Spec. Issue No. 13.
Lettevall, E. 2003. Abundance, association and movement within discrete populations of sperm whales Physeter macrocephalus. Ph.D. thesis, Göteborg University. Göteborg, Sweden.
Lettevall, E., Richter, C., Jaquet, N., Slooten, E., Dawson, S., and Whitehead, H. 2002. Social structure and residency in aggregations of male sperm whales. Can. J. Zool. 80: 1189-1196.
Lyrholm, T., and Gyllensten, U. 1998. Global matrilineal population structure in sperm whales as indicated by mitochondrial DNA sequences. Proc. R. Soc. Lond. B Biolo. Sci.
265: 1679-1684.
Lyrholm, T., Leimar, O., Johanneson, B., and Gyllensten, U. 1999. Sex-biased dispersal in sperm whales: contrasting mitochondrial and nuclear genetic structure of global
populations. Proc. R. Soc. Lond. B Biolo. Sci. 266: 347-354.
Magalhães, S., Prieto, R., Silva, M.A., Gonçalves, J., Afonso-Dias, M. and Santos, R.S. 2002. Short-term reactions of sperm whales (Physeter macrocephalus) to whale watching vessels in the Azores. Aquat. Mamm. 28(3): 267-274.
Marshall, T.C., Slate, J., Kruuk, L., and Pemberton, J.M. 1998. Statistical confidence for likelihood-based paternity inference in natural populations. Mol. Ecol. 7(5): 639-655.
Matthews, J.N., Steiner, L., and Gordon, J. 2001. Mark-recapture analysis of sperm whale (Physeter macrocephalus) photo-id data from the Azores (1987-1995). J. Cetacean Res. Manag. 3: 219-226.
Mendes, S., Newton, J., Reid, R.J., Zuur, A. F., Pierce, G.J. 2007. Stable carbon and nitrogen isotope ratio profiling of sperm whale teeth reveals ontogenetic movements and trophic ecology. Oecologia, 151: 605-615.
Nielsen, R., Mattila, D.K., Clapham, P.J., and Palsbøll, P.J. 2001. Statistical approaches to paternity analysis in natural populations and applications to the North Alantic humpback whale. Genetics, 157: 1673-1682.
Palsbøll, P.J., Bérubé, M., Larsen, A.H., and Jorgensen, H. 1997. Primers for the amplification of tri- and tetramer microsatellite loci in baleen whales. Mol. Ecol. 6: 893-895.
Park, S.D.E. 2001. Trypanotolerance in West African cattle and the population genetic
effects of selection. Ph.D. thesis, University of Dublin, Dublin, Ireland.
Pusey, A., and Wolf, M. 1996. Inbreeding avoidance in animals. Trends Ecol. Evol. 11: 201-206.
Queller, D.C., and Goodnight, K.F. 1989. Estimating relatedness using genetic markers. Evolution, 43: 258-275.
Rice, W.R. 1989. Analysing tables of statistical tests. Evolution, 43: 223-225.
Richard, K.R., Dillon, M.C., Whitehead, H., and Wright, J.M. 1996a. Patterns of kinship in groups of free-living sperm whales (Physeter macrocephalus) revealed by multiple molecular genetic analyses. Proc. Natl. Acad. Sci. U.S.A. 93: 8792-8795. Richard, K.R., Whitehead, H., and Wright, J.M. 1996b. Polymorphic microsatellites from sperm whales and their use in the genetic identification of individuals from naturally sloughed pieces of skin. Mol. Ecol. 5: 313- 315.
Ritland, K. 2000. Marker-inferred relatedness as a tool for detecting heritability in nature. Mol. Ecol. 9: 1195-1204.
Santos, R. S., Hawkins, S., Monteiro, L. R., Alves, M., and Isidro, E.J. 1995. Case studies and reviews: Marine research, resources and conservation in the Açores. Aquatic Conserv.: Mar. Freshw. Ecosyst. 5: 311-354.
Shinohara, M., Domingo-Roura, X., and Takenaka, O. 1997. Microsatellites in the bottlenose dolphin Tursiops truncatus. Mol. Ecol. 6: 695-696.
Silva, M. A., Prieto, R., Magalhães, S., Cabecinhas, R., Cruz, A., Gonçalves, J.M., and Santos, R.S. 2003. Occurrence and distribution of cetaceans in the waters around the Azores (Portugal), summer and autumn 1999-2000. Aquat. Mamm. 29(1): 77-83.
Slate, J., Marshall, T.C., and Pemberton, J.M. 2000. A retrospective assessment of the accuracy of the paternity inference program Cervus. Mol. Ecol. 9: 801-808.
Slatkin, M. 1995. A measure of population subdivision based on microsatellite allele frequencies. Genetics, 139: 457-462.
Summers, K., and Amos, W. 1997. Behavioral, ecological and molecular genetic analyses of reproductive strategies in the Amazonian dart-poison frog, Dendrobates ventrimaculatus. Behav. Ecol. 8: 260-267.
Valsecchi, E., and Amos, W. 1996. Microsatellite markers for the study of cetacean populations. Mol. Ecol. 5: 151-156.
Valsecchi, E., Hale, P., Corkeron, P., and Amos, W. 2002. Social structure in migrating humpback whales (Megaptera novaeangliae). Mol. Ecol. 11: 507-518.
Weir, B.S., and Cockerham, C.C. 1984. Estimating F-statistics for the analysis of population structure. Evolution, 38: 1358-1370.
Weller, D.W., Wϋrsig, B., Lynn, S.K., and Schiro, A.J. 2000. Preliminary findings on the occurrence and site fidelity of photoidentified sperm whales (Physeter
macrocephalus) in the northern Gulf of Mexico. Gulf Mex. Sci. 18: 35-39.
Whitehead, H. 1989. Formations of foraging sperm whales, Physeter macrocephalus, off the Galápagos Islands. Can J. Zool. 67(9): 2131-2139.
Whitehead, H. 1993. The behaviour of mature male sperm whales on the Galápagos Islands breeding grounds. Can. J. Zool. 71(4): 689-699.
Whitehead, H. 1996. Babysitting, dive synchrony, and indications of alloparental care in sperm whales. Behav. Ecol. Sociobiol. 38: 237-244.
Whitehead, H. 1997. Analysing animal social structure. Anim. Behav. 53: 1053-1067. Whitehead, H. 1998. Cultural selection and genetic diversity in matrilineal whales. Science (Washington D.C.), 282: 1793-1796.
Whitehead, H. 2003. Sperm Whales, Social Evolution in the Ocean. The University of Chicago Press, Chicago, USA.
Whitehead, H., and Kahn, B. 1992. Temporal and geographical variation in the social structure of female sperm whales. Can. J. Zool. 70: 2145-2149.
Whitehead, H., Waters, S., and Lyrholm, T. 1992. Population structure of female and immature sperm whales (Physeter macrocephalus) off the Galapagos Islands. Can. J. Fish. Aquat. Sci. 49: 78-84.
Wright, S. 1978. Evolution and the genetics of population. Vol 4. Variability among and within natural populations. University of Chicago Press, Chicago, USA.
Figure 1. Map of Physeter macrocephalus sample collection sites around the three
groups of islands (occidental, central and oriental) of the archipelago of the Azores. Plain triangles represent sampling locations.
Table 1. PCR conditions for multiplex analysis of microsatellites for the Physeter macrocephalus: list of loci used for each reaction, primer
sequences and PCR conditions (primer proportions, annealing temperatures with → indicating first and last cycle temperatures for touch-down PCR, and number of cycles used). The loci Sw10 and MK6 were not amplified in multiplex.
Reaction Locus Primer sequences Primer Temperature (ºC) Nº cycles
EV14 a: TAAACATCAAAGCAGACCCC b: CCAGAGCCAAGGTCAAGAG 1
A
D22 F: GGAAATGCTCTGAGAAGGTC R: CCAGAGCACCTATGTGGAC 1
54 → 51.5 25
EV1 a: CCCTGTCCCCATTCTC b: ATAAACTCTAATACACTTCCTCCAAC 1
EV5 a: AGCTCCCTTAGACTCAACCTC b: TATGGCGAGGGTTCCG 1
B Sw19 F: GTAGTTTTCTTTAACAGTAATG R: AGTTCTGGGCTTTTCACCTA 1 54 → 51 30 FCB1 F: TGCATCTCCATGGTATGTCTTATCC R: AGCCTCTGCTATGCCTGGAACGC 0.5 FCB17 F: TCAGCCTCTATAACGTCCTGAGC R: ATGGGGACTGCCTATATTAGTCAG 1 C
EV37 a: AGCTTGATTTGGAAGTCATGA b: TAGTAGAGCCGTGATAAAGTGC 1.5
56 → 53 30
CSY (Sex) F: TCGTGATCAAAGGCGAAAGG
R: TTTGTCTCGGTGCATGGCTC 1
GATA028 F: AAAGACTGAGATCTATAGTTA R: CGCTGATAGATTAGTCTAGG 0.75
52 → 49.5 25
D
SW10 F: ACCTAAGGATGGAGATG R: ATTTCCCAGGTCTGCAA 1.25 50 → 47 30
Table 2. Locus-specific information for the Physeter macrocephalus: allelic diversity (K), number of genotyped individuals (N), expected (HE)
and observed (HO) heterozygosity, polymorphic information content (PIC), inbreeding coefficient (FIS) and its p-value, probability of departure
from Hardy-Weinberg Equilibrium (HWE p-value) and estimated null allele frequency. Mean and standard deviation (s.d.) are based on all loci
except EV14 and D22. †: significant after successive Bonferroni correction.
Locus K N PIC HE HO FIS (p) FIS (p) HWE Null alleles
EV14 8 73 0.437 0.495 0.123 0.745 <0.001 <0.001 † 0.586 D22 6 113 0.535 0.583 0.460 0.204 <0.001 0.002 † 0.135 EV1 11 104 0.527 0.555 0.548 -0.0003 0.420 0.888 -0.003 EV5 9 111 0.699 0.740 0.784 -0.055 0.818 0.014 -0.032 EV37 20 112 0.892 0.915 0.930 0.007 0.310 0.639 -0.017 FCB1 14 111 0.838 0.855 0.856 0.014 0.265 0.024 -0.004 FCB17 19 112 0.891 0.902 0.857 0.075 0.004 0.322 0.021 GATA028 3 112 0.559 0.643 0.688 -0.005 0.474 0.250 -0.035 SW10 10 113 0.844 0.863 0.876 0.004 0.384 0.704 -0.001 SW19 21 111 0.908 0.918 0.892 0.049 0.022 0.005 0.012 MK6 7 111 0.634 0.686 0.658 0.084 0.036 0.857 0.017 Average +/- s.d. 12.7 +/- 6.27 111 +/- 2.64 0.755 +/- 0.15 0.786 +/- 0.13 0.788 +/- 0.13 0.02 +/- 0.04 -0.005 +/- 0.02
Table 3. Pairwise genetic differentiation among spatially-defined putative Physeter
macrocephalus populations (island groups) using microsatellite data. FST values are reported below the diagonal, whereas RST values are reported above the diagonal. For each comparison, the first line corresponds to the whole data set, and the second line to the restricted data set including one randomly chosen individual per group of level 2. N indicates the number of individuals in each group. *: p < 0.05.
Pop N Eastern Central Western
Eastern 30 - 0.001 0.022 9 - -0.004 -0.024 Central 67 0.006* - -0.003 33 -0.008 - -0.016 Western 16 0.009 0.002 - 6 -0.025 -0.006 -
Table 4. Pairwise genetic differentiation among temporally-defined putative Physeter
macrocephalus populations (sampling years) using microsatellite data. FST values are reported below the diagonal, whereas RST values are reported above the diagonal. For each comparison, the first line corresponds to the whole data set, and the second line to the restricted data set including one randomly chosen individual per group of level 2. N indicates the number of individuals in each group. *: p < 0.05 and **: p< 0.01.
Pop N 2002 2003 2004 2002 37 - 0.006 0.005 16 - -0.010 -0.019 2003 57 0.008** - 0.024* 22 0.001 - -0.012 2004 19 0.016** 0.011** - 10 0.007 0.001 -
Table 5. Mean relatedness (r, Queller and Goodnight, 1989) within and between
Physeter macrocephalus groups of levels 1, 2 and 3, and associated variance (var.,
Ritland, 2000). N* refers to the number of groups counting more than one individual.
Groups N* r within var. within r between var. between p
Level 1 13 0.159 0.017 -0.010 0.0001 p<0.0001
Level 2 27 0.166 0.037 -0.013 0.0002 p<0.0001
Level 3 23 0.112 0.033 -0.013 <0.0001 p<0.0001
Table 6. Hierarchical Analysis of Molecular Variance (AMOVA) within and between
Physeter macrocephalus groups of level 2 and 3: degrees of freedom (df), percentage of
variation (% V) and fixation indices with their associated significance values. FCT = relative divergence between groups of level 3; FSC = relative divergence between groups of level 2 that belong to the same group of level 3; FST = relative divergence between groups of level 2. **: p< 0.01 and ***: p< 0.001.
Level df % V Fixation indices p
Between groups of level 37 2.67 (Va) FCT = 0.0267 0.1211 Between groups of level
2 within level 3 10 3.15 (Vb) FSC = 0.0324 0.0023** Within groups of level 2 178 94.18 (Vc) FST = 0.0582 <0.0001***
Table 7. Physeter macrocephalus parent-offspring pairs identified by kinship analyses:
identity (ID) of the parent-offspring pairs (Po; H1: rm=1.0, rp=0.0) and their significance when compared with full-sibling (Fs; H0: rm=0.5, rp=0.5) or half-sibling (Hs; H0: rm=0.5 rp=0.0), sex (f=female and m=male) and size (S=small, M=medium and ?=undetermined) of the individuals, social group to which they belong (level 1, 2, 3 or none (≠)) and group of islands where the samples were collected. **: p<0.01, ***:
p<0.001 and NS: not significant.
ID Po vs. Fs
Po vs.
Hs Sex Size Social
group Group of islands
Pm25 / Pm14 *** NS m / f M / ? level 3 Eastern Pm46 / Pm44 NS ** m / f M / ? level 1 Central Pm55 / Pm49 ** NS f / f ? / M ≠ Central Pm68 / Pm66 ** NS f / f ? / M level 2 Central Pm70 / Pm68 NS ** m / f ? / ? level 2 Central Pm73 /Pm75 ** ** m / f ? / M level 2 Central Pm79 / Pm77 ** NS m / f M / M level 2 Central Pm80 / Pm77 ** ** f / f ? / M level 2 Central Pm95 / Pm94 ** NS f / f M / M level 1 Western Pm100 /Pm101 NS ** f / f M / M level 2 Western Pm105 / Pm104 ** NS f / f ? / ? level 1 Eastern Pm114 / Pm112 ** NS f / f M / M level 2 Eastern Pm120 /Pm119 NS ** f / f ? / M level 2 Eastern Pm130 / Pm129 NS *** m / f M / M level 2 Central Pm148 / Pm135 NS *** f / f ? / ? ≠ Central Pm151 / Pm115 ** NS f / f M / M ≠ Central / Eastern Pm150 / Pm139 ** NS f / f M / M ≠ Central
Table 8. Physeter macrocephalus full-sibling pairs identified by kinship analyses:
identity (ID) of the full-sibling pairs (Fs; H1: rm=0.5, rp=0.5) and their significance when compared with half-sibling (Hs; H0: rm=0.5, rp=0.0) or grandparent-grandchild (G; H0: rm=0.25, rp=0.25), sex (f=female and m=male) and size (S=small, M=medium and ?=undetermined) of the individuals, social group to which they belong (level 1, 2, 3 or none (≠)) and group of islands where the samples were collected. **: p<0.01, ***:
p<0.001 and NS: not significant.
ID Fs vs. Hs
Fs
vs. G Sex Size Social
group Group of islands Pm27 / Pm12 *** *** f / f M / M level 3 Eastern Pm138 / Pm136 *** ** f / f ? / ? level 2 Central Pm150 / Pm147 *** *** f / f ? / ? ≠ Central Pm15 / Pm23 ** NS m / m ? / ? level 2 Eastern Pm101 /Pm100 ** ** f / f M / M level 2 Western Pm120 /Pm119 ** *** f / f ? / M level 2 Eastern Pm18 / Pm126 ** ** m / f ? / M ≠ Eastern / Central Pm123 / Pm131 ** NS m / f S / ? ≠ Central Pm125 / Pm135 ** NS m / f ? / M ≠ Central