HAL Id: cea-00865976
https://hal-cea.archives-ouvertes.fr/cea-00865976
Submitted on 2 Feb 2021HAL is a multi-disciplinary open access archive for the deposit and dissemination of sci-entific research documents, whether they are pub-lished or not. The documents may come from teaching and research institutions in France or abroad, or from public or private research centers.
L’archive ouverte pluridisciplinaire HAL, est destinée au dépôt et à la diffusion de documents scientifiques de niveau recherche, publiés ou non, émanant des établissements d’enseignement et de recherche français ou étrangers, des laboratoires publics ou privés.
Detection of a large-scale structure of intracluster
globular clusters in the Virgo cluster
Myung Gyoon Lee, Hong Soo Park, Ho Seong Hwang
To cite this version:
Myung Gyoon Lee, Hong Soo Park, Ho Seong Hwang. Detection of a large-scale structure of intra-cluster globular intra-clusters in the Virgo intra-cluster. Science, American Association for the Advancement of Science, 2010, 328 (5976), pp.334. �10.1126/science.1186496�. �cea-00865976�
arXiv:1003.2499v1 [astro-ph.CO] 12 Mar 2010
Detection of a Large Scale Structure of Intracluster
Globular Clusters in the Virgo Cluster
Myung Gyoon LEE,
1∗Hong Soo PARK,
1Ho Seong HWANG
1,21
Astronomy Program, Department of Physics and Astronomy, Seoul National University, Seoul 151-742, Korea
2
CEA Saclay/Service d’Astrophysique, F-91191 Gif-sur-Yvette, France
∗To whom correspondence should be addressed; E-mail: mglee@astro.snu.ac.kr.
One-sentence summary: We find a large scale structure of intracluster globular clusters, using the map for the globular clusters in the Virgo cluster of galaxies.
Globular clusters are found usually in galaxies and they are an excellent tracer of dark matter. Long ago it was suggested that there may exist intracluster globular clusters (IGCs) bound to a galaxy cluster rather than to any single galaxy. Here we present a map showing the large scale distribution of globular clusters over the entire Virgo cluster. It shows that IGCs are found out to 5 million light years from the Virgo center, and that they are concentrated in several substructures much larger than galaxies. These objects might have been mostly stripped off from low-mass dwarf galaxies.
Almost six decades ago it was suggested that there may exist stars and interstellar medium between galaxies in clusters of galaxies (1, 2). To date there is accumulating evidence for the existence of diffuse optical stellar light, planetary nebulae, resolved red giant stars, and diffuse
hot X-ray emitting gas between galaxies in nearby galaxy clusters (3, 4, 5, 6, 7). Some of these objects are not bound to any single galaxy, but are gravitationally controlled by the potential of the galaxy cluster itself. These are called intracluster objects.
Later it was suggested that globular clusters should be stripped off from galaxies in a galaxy cluster and that there should be a cluster-wide population of intracluster globular clusters (IGCs) in galaxy clusters (8, 9, 10). However, so far there has been no indication for IGCs in the Coma cluster, and only a small number of IGCs were found in similar studies of other galaxy clusters because of their relatively shallow photometric limits or small area coverage (11, 12, 13, 14). It is not yet known whether this cluster-wide population of IGCs exists in any galaxy cluster or not.
The Virgo cluster is the best target to search for a cluster-wide population of IGCs, because it is the nearest massive galaxy cluster. However, because of its largest angular extent (over ten degrees in the sky) (15) and the faintness of its globular clusters it has been difficult to find and study IGCs over the entire Virgo cluster.
We present the results of a search for the globular clusters over the entire Virgo cluster using data from the Sloan Digital Sky Survey (SDSS) (16, 17). The SDSS data are deep enough to study the bright globular clusters in Virgo and its survey area is wide enough to cover the entire Virgo cluster.
The Virgo cluster is located at a distance of 54 million light years (16.5 mega parsec); one degree in the sky corresponds to 940,000 light years (288 kilo parsec) at this distance. The globular clusters at the distance of Virgo appear as point sources in the SDSS images thus they cannot be distinguished from faint foreground stars in our Galaxy in the images. To overcome this problem and create a map of the globular clusters in Virgo, we used the photometry of the point sources in the SDSS Sixth Data Release (18).
in-cluding the Virgo cluster, using the criteria for color and magnitude (reddening corrected):
0.6 < (g − i)0 < 1.3 and 19.5 < i0 < 21.7 mag, as marked by the box in Fig. 1. This color
range is similar to that used for selecting globular clusters in M87 (19), and corresponds to a metallicity range of −2.0<
∼[Fe/H] <
∼+ 0.4 (20, 21). The lower magnitude limit, i0 < 21.7 mag is
∼1.5 mag brighter than the peak magnitude in the luminosity function of globular clusters (19).
By using globular clusters brighter thani0 = 21.7 mag, we covered ∼ 13 % of the entire
glob-ular cluster population, assuming that their luminosity function is represented by a Gaussian function with peaki0 = 23.17 mag (19).
We created a surface number density map for the globular clusters in Virgo after subtracting the contribution of foreground stars [including the Virgo overdensity (22)] using the color-magnitude diagram method (details are described in the supporting online material) (Fig. 2A). The surface number density map for the globular clusters reveals the existence of a diffuse large scale distribution of globular clusters (in cyan and green colors), extending out to about 6 degrees (5 million light years) from the Virgo center, close to the boundary of the Virgo cluster. It also shows the presence of several strong concentrations of globular clusters. Their locations correspond to the positions of bright elliptical galaxies such as M87, M49, M60, M86/M84, and NGC 4636. However, the sizes of these substructures are much larger than in-dividual galaxies. This population must include not only globular clusters in galaxies but also IGCs.
The large-scale distributions of globular clusters surrounding M87, M49, and M60 are sim-ilar in general to that of large scale X-ray emission seen in the ROSAT X-ray map (Fig. 2B). However, one diffuse component of globular clusters in the west of M87 is not seen in the X-ray map, while one diffuse X-ray component in the north of M87 is not found in the map of globular clusters.
of M87, and bridge-like features between M87 and M86 (also between M87 and M89). These features are similar to the distribution of diffuse stellar light found in the deep optical image of the inner 1.5 deg×1.5 deg region (6).
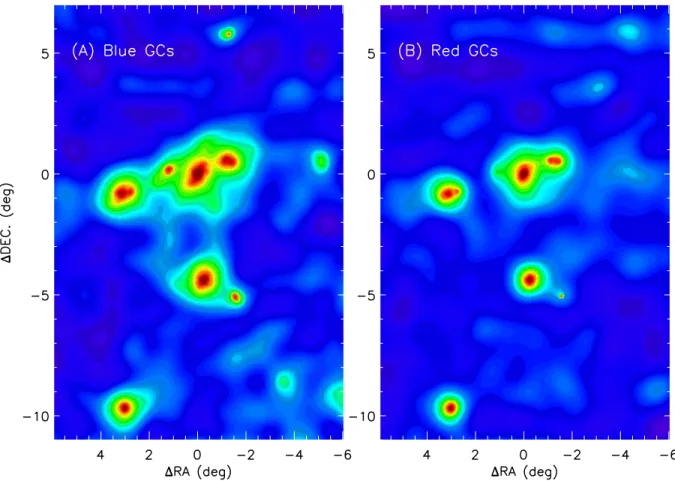
It is known that the color distribution for the globular clusters in giant elliptical galaxies is bimodal, showing that there are two populations: blue and red globular clusters (i.e., metal-poor and metal-rich globular clusters, respectively) (23, 24). The large-scale distribution of the blue globular clusters in the Virgo cluster is much more extended than that of the red globular clusters (Fig. 3); a similar trend is seen around bright galaxies (most dramatically around M49 and M87). Therefore the IGCs are probably dominated by the blue globular clusters.
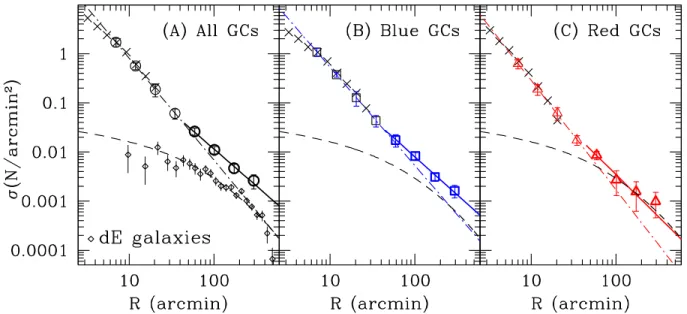
We derived the radial number density profiles for the globular clusters (σ [number per square
arcmin]) as a function of radius from the center of the Virgo cluster (R) (25) (Fig. 4). The radial
number density profiles of the globular clusters show a change in the slope at R ≈ 40 arcmin,
beyond which the slope gets flatter. This break position is consistent with the value for the edge of the stellar halo of M87,R = 34 arcmin, derived from the kinematic study of planetary
nebulae in Virgo (27). Therefore the globular clusters at R < 40 arcmin are considered to
mostly belong to M87, while those at R > 40 arcmin may be mostly IGCs. Double linear fits
for all the globular clusters yield log(σ) = −1.49(±0.09) log R + 1.05(±0.03) for the outer
region (40 arcmin< R < 6 deg), and −2.07(±0.01) log R + 1.99(±0.002) for the inner region
(R < 40 arcmin). The slope for all the globular clusters at the outer region is similar to that
for the dwarf elliptical galaxies, and is consistent with the lower limit predicted from numerical simulations, –1.5 to –2.5 (28). This result suggests that the IGCs may follow the dark matter distribution of the Virgo galaxy cluster. If the globular clusters in the core of Virgo undergo a transition from M87-dominated to Virgo-dominated, it is expected that their velocity dispersion profile forR > 40 arcmin is relatively flat with a value that is a few hundred km s−1higher than
The number density of the blue globular clusters is, on average, about twice as large as that of the red globular clusters for the range 40 arcmin< R < 6 deg (Figs. 4B and 4C), indicating
again that the IGCs may be dominated by the blue globular clusters. For the range 40 arcmin
< R < 6 deg, we measured N = 1, 500 ± 300 IGCs with 19.5 < i0 < 21.7 mag. This
implies the total number of entire IGCs in that region isN(total) ∼ 11, 900, assuming that the
luminosity function for IGCs is similar to that for globular clusters in galaxies.
There are several models to explain the origin of globular clusters in giant elliptical galaxies, but their origin is still controversial (30). Our finding that there is a wide distribution of IGCs and that they are mostly blue (i.e., metal-poor) indicates that the major origin of these IGCs is low-mass dwarf galaxies (31, 32, 33). This supports the mixture scenario for the origin of globular clusters in giant elliptical galaxies (30). According to this scenario, metal-poor glob-ular clusters were formed mostly in low-mass dwarf galaxies and metal-rich globglob-ular clusters were formed later with stars in massive galaxies or in dissipational merging galaxies. Elliptical galaxies grow via dissipational or dissipationless merging of galaxies and via accretion of many dwarf galaxies. The IGCs in Virgo might have been stripped off from low-mass dwarf galaxies and are now being accreted locally to nearby massive galaxies, and globally to the center of Virgo.
References and Notes
1. F. Zwicky, Publ. Astron. Soc. Pacific 63, 61-71 (1951)
2. S. van den Bergh, Publ. Astron. Soc. Pacific 68, 449-450 (1956) 3. H. B¨ohringer et al., Nature 368, 828-831 (1994)
4. P. R. Durrell, R. Ciardullo, J. J. Feldmeier, G. H. Jacoby, S. Sigurdsson, Astrophys. J. 570, 119-131 (2002)
5. J. J. Feldmeier, R. Ciardullo, G. H. Jacoby, P. R. Durrell, Astrophys. J. 615, 196-208 (2004) 6. J. C. Mihos, P. Harding, J. Feldmeier, H. Morrison, Astrophys. J. 631, L41-L44 (2005) 7. N. Castro-Rodrigu´ez, et al., Astro. Astrophys. 507, 621-634 (2009)
8. R. E. White, III. Mon. Not. R. Astron. Soc. 227, 185-195 (1987) 9. J. C. Muzzio, Publ. Astron. Soc. Pacific 99, 245-264 (1987)
10. M. J. West, P. Cˆot´e, C. Jones, W. Forman, R. O. Marzke, Astrophys. J. 453, L77-L80 (1995) 11. A. Jord´an, M. J. West, P. C´ote, R. O. Marzke, Astron. J. 125, 1642-1648 (2003)
12. A. Mar´ın-Franch, A. Aparicio, Astrophys. J. 585, 714-721 (2003) 13. N. Tamura et al., Mon. Not. R. Astron. Soc. 373, 601-612 (2006) 14. B. F. Williams et al., Astrophys. J. 654, 835-843 (2007)
15. B. Binggeli, A. Sandage, G. A. Tammann, Astron. J. 90, 1681-1759 (1985) 16. D. G. York et al., Astron. J. 120, 1579-1587 (2000)
17. The magnitude limits for point sources in the SDSS catalog are 22.2 mag and 21.3 mag in theg and i-bands, respectively, for 95 % completeness.
18. J. K. Adelman-McCarthy et al., Astron. Astrophys. J. Supp. 175, 297-313 (2008) 19. W. Harris, Astrophys. J. 703, 939-950 (2009)
21. We derived a relation between (g − i)0 color and [Fe/H] using the SDSS
photome-try and [Fe/H] in the literature for the bright globular clusters M49, M60, and M87: [Fe/H]= 3.48(g − i)0−4.13.
22. M. Jur´ıc et al., Astrophys. J. 673, 864-914 (2008) 23. M. G. Lee, J. Korean Astron. Soc. 36, 189-212 (2003) 24. E. W. Peng et al., Astrophys. J. 639, 95-119 (2006)
25. We adopted M87 as the center for deriving the radial profiles (26). First we removed glob-ular clusters in galaxies by masking out a circglob-ular region with radius5R25centered on each
galaxy in the Virgo galaxy catalog (all 2095 galaxies except for M87) (15) (R25represents a
radius of a galaxy where the surface brightness isµB = 25 mag arcsec−2). We kept M87 to
see the radial profile for the central region of Virgo. Then we derived the radial profiles for the remaining globular clusters. (i.e., IGC candidates and M87 globular clusters).
26. D. E. McLaughlin, Astrophys. J. 512, L9-L12 (1999) 27. M. Doherty et al., Astro. Astrophys. 502, 771-786 (2009)
28. K. Bekki, H. Yahagi, Mon. Not. R. Astron. Soc. 372, 1019-1033 (2006) 29. P. Cote et al., Astrophys. J. 559, 828-850 (2001)
30. M. G. Lee et al., Astrophys. J. 709, 1083-1099 (2010)
31. B. W. Miller, J. M. Lotz, Astrophys. J. 670, 1074-1089 (2007)
32. K. Bekki, H. Yahagi, M. Nagashima, D. A. Forbes, Mon. Not. R. Astron. Soc. 387, 1131-1148 (2008)
33. V. Coenda, M. Hern´an, C. Donzelli, Astrophys. J. 700, 1382-1390 (2009) 34. J. F. Navarro, C. S. Frenk, S. D. M. White, Astrophys. J. 490, 493-508 (1997)
35. We thank D. Geisler, M. Im and N. Hwang for their careful reading the manuscript and useful comments, to the anonymous referees for their comments that improved the original manuscript significantly. This work was supported by the National Research Foundation of Korea (NRF) grant funded by the Korea Government (MEST) (No. R01-2007-000-20336-0). Funding for the SDSS and SDSS-II has been provided by the Alfred P. Sloan Foundation, the Participating Institutions, the National Science Foundation, the U.S. Department of En-ergy, the National Aeronautics and Space Administration, the Japanese Monbukagakusho, the Max Planck Society, and the Higher Education Funding Council for England. The SDSS Web Site is http://www.sdss.org/. The SDSS is managed by the Astrophysical Research Consortium for the Participating Institutions. The Participating Institutions are the Ameri-can Museum of Natural History, Astrophysical Institute Potsdam, University of Basel, versity of Cambridge, Case Western Reserve University, University of Chicago, Drexel Uni-versity, Fermilab, the Institute for Advanced Study, the Japan Participation Group, Johns Hopkins University, the Joint Institute for Nuclear Astrophysics, the Kavli Institute for Par-ticle Astrophysics and Cosmology, the Korean Scientist Group, the Chinese Academy of Sciences (LAMOST), Los Alamos National Laboratory, the Max-Planck-Institute for As-tronomy (MPIA), the Max-Planck-Institute for Astrophysics (MPA), New Mexico State Uni-versity, Ohio State UniUni-versity, University of Pittsburgh, University of Portsmouth, Princeton University, the United States Naval Observatory, and the University of Washington.
www.sciencemag.org SOM Text (Methods) Figs. S1 and S2 References
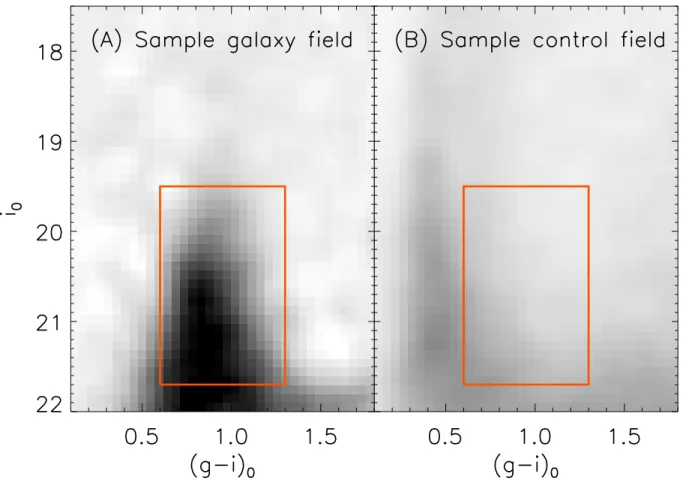
Figure 1: i0−(g − i)0color-magnitude diagrams for the point sources in Virgo. (A) A sample
galaxy field composed of ten circular fields (radius 20 arcmin) centered on the brightest galax-ies. The contribution of the foreground stars was subtracted. Most of the sources are globular clusters. (B) A sample control field located at 6 to 9 deg from the Virgo center, covering the same area as (A). Most of the sources are foreground stars belonging to our Galaxy. Darker colors represent the higher number density. The box represents the region used for selecting the bright globular cluster candidates in Virgo in this study.
Figure 2: Surface number density maps for the globular clusters in comparison with the spatial distribution of galaxies and X-ray emission in the Virgo cluster region. (A) Globular clusters. The levels are 0.012, 0.025, 0.06, and 0.12 per arcmin2
, respectively, for cyan, green, yellow, and red boundaries. The positions of several bright elliptical galaxies are labeled. (B) Galaxies and X-ray emission. The pseudo color map represents a luminosity-weighted surface number density map of the early-type (red color) and late-type galaxies (blue color) that are members of Virgo. The yellow contours represent the contours of X-ray image for the Virgo cluster region in ROSAT all-sky survey (in the hard energy band 0.4-2.4 keV) (3). North is up and east to the left.
Figure 3: Surface number density maps of the blue globular clusters (0.6 < (g − i)0 ≤0.95)(A)
and the red globular clusters (0.95 < (g − i)0 < 1.3)(B). The color for the boundary between
the blue and red clusters,(g − i)0 = 0.95, corresponds to the metallicity [Fe/H] ≈ −0.82. The
Figure 4: Radial number density profiles for the globular clusters in Virgo, obtained after mask-ing out a circular region (radius< 5R25) for each galaxy in the Virgo galaxy catalog except for
M87 to remove globular clusters in galaxies. (A) All the globular clusters (circles). Dot-dashed lines and solid lines represent the linear fits for the inner region atR < 40 arcmin, and the outer
region atR > 40 arcmin, respectively. Diamonds represent the radial number density profile for
the dwarf elliptical (dE) galaxies that are members of Virgo. Curved dashed lines represent a projected NFW profile (34) for the Virgo mass distribution given by McLaughlin (26). (B) The blue globular clusters (squares), and (C) the red globular clusters (triangles). Crosses represent the data including the fainter (i < 23.0) globular clusters at R < 30 arcmin from M87 in given
by Harris (19), arbitrarily shifted to match the data for10 < R < 20 arcmin. Note that they are
SUPPORTING ONLINE MATERIAL: Detection of a Large
Scale Structure of Intracluster Globular Clusters in the Virgo
Cluster
Methods
Here we briefly describe the methods used to derive the surface number density maps for globular clusters in the Virgo cluster, using the SDSS point source catalog. We used the pho-tometry of the point sources in the SDSS Sixth Data Release (S1) to select globular cluster candidates in Virgo.
The SDSS catalog of point sources in the Virgo direction includes not only the Virgo glob-ular clusters but also the objects that do not belong to the Virgo cluster. There are two types of point sources that are not members of Virgo, which are located in the direction of Virgo: 1) foreground stars belonging to our Galaxy, and 2) unresolved background galaxies. Since we are dealing with relatively bright point sources, the contribution due to the latter is negligible (S2). So we consider only foreground stars.
We need to remove foreground stars and keep only Virgo globular clusters for making a sur-face number density map for globular clusters. The foreground stars in Virgo are contributed by two types of objects. One is the disk and halo of our Galaxy, and the other is the Virgo overden-sity discovered recently in the SDSS (S3). The Virgo overdenoverden-sity is a large scale substructure covering over 1000 deg2
of sky toward Virgo, and is estimated to be located at a distance of 6-20 kilo parsec. It may be a tidal stream or a low-surface brightness dwarf galaxy merging with the Milky Way (S3). Because of the existence of the Virgo overdensity overlapping with our field of interest, the conventional method of using the separate control field at the similar galactic latitude does not work well for subtracting the contribution of these foreground stars. Therefore we adopted a method of using the color magnitude diagram (CMD) for foreground
subtraction as follows.
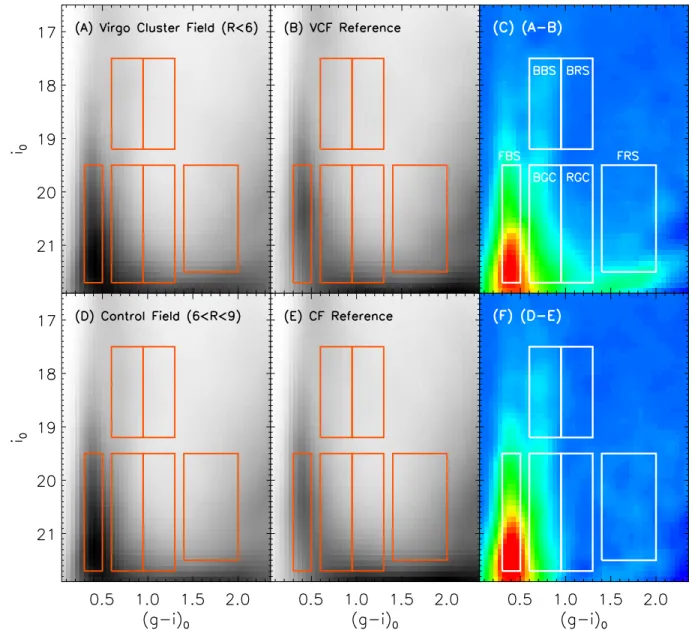
We selected four fields in the sky to choose appropriate regions in the CMDs for selecting foreground stars and globular clusters in our analysis. (a) The Virgo cluster field: a circular region with radius R = 6 deg, centered on M87. This field covers approximately the entire
area of the Virgo cluster. (b) The Control field: an annular region with radius6 < R < 9 deg,
surrounding the Virgo cluster field. This field represents a background field close to the Virgo cluster. It is used for subtracting the contribution of local foreground stars from the Virgo cluster field. (c) Two Reference fields: One circular region (for the Virgo cluster field) and one annular region (for the Control field), both of which are centered at (galactic longitudel = 80.32 deg,
galactic latitudeb = 74.46 deg). They are at the same galactic latitude as the Virgo fields, but ∼ 200 deg distant in galactic longitude from the Virgo fields. They have the same areas as (a)
and (b), respectively. These reference fields are used for checking the contribution of general foreground stars in (a) and (b).
Then we constructed raw i0 −(g − i)0 CMDs for the Virgo cluster field and its reference
field, and the Control field and its reference field, as shown in Fig. S1(A), (B), (D), and (E). We subtracted the CMD for the corresponding reference field from the CMDs for the Virgo cluster field and the Control field, displaying the resulting CMDs in Fig. S1(C) and (F).
We used Fig. S1(C) and (F) for choosing the CMD regions to make foreground star maps. Fig. S1(C) includes the contribution of the foreground stars (the Virgo overdensity stars and the remaining disk and halo stars) and the globular clusters in Virgo, while Fig. S1(F) includes the contribution of the foreground stars only. These figures show that the stars in the Virgo overdensity are mostly bluer than the globular clusters. The Virgo overdensity stars contaminate somewhat the bluer side of the blue globular cluster region, while it affects little the red globular cluster region.
in Fig. S1. We chose a bright blue star region (BBS) with the same color range as the blue globular cluster region, and a faint blue star region (FBS) with the same magnitude range as the globular cluster region as in Fig. S1(C) and (F), and used the stars in these regions for creating a blue foreground map to be used for the blue globular clusters. Then we chose a bright red star region (BRS) with the same color range as the red globular cluster region, and a faint red region (FRS) with the similar magnitude range to that of the globular cluster region, and used the stars in these regions for creating a red foreground map to be used for the red globular clusters.
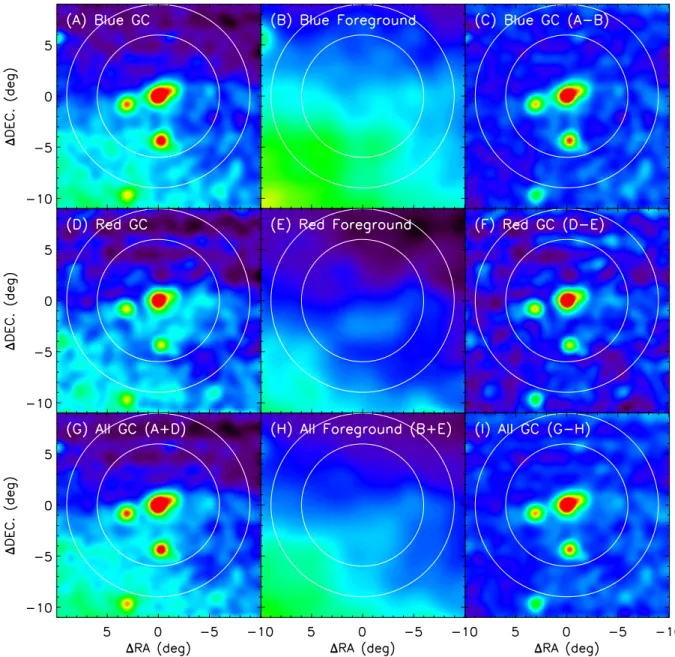
We made the raw surface number density maps for globular cluster candidates (Fig. 2S(A), (D), and (G)) and foreground stars (Fig. 2S(B), (E), and (H)) using the objects inside the above regions in the CMDs. The foreground map was made with a combination of contributions of faint stars and bright stars: σ(foreground stars)=(1 − a)σ(bright stars)+aσ(faint stars), where σ represents the surface number density. The coefficient, a, was determined by minimizing
the fluctuation in the difference map for the Control field. Finally we subtracted each of the foreground maps (Fig. 2S(B) and (E)) from each of the raw maps (Fig. 2S(A) and (D)), after scaling the foreground map so that the mean difference for the Control field is zero. Finally we combined the maps for the blue and red globular clusters to make a map for all the globular clusters. The resulting maps are shown in Fig. S2. The final difference maps (Fig. 2S(C), (F), and (I)) show the spatial distribution of all, blue, and red globular clusters in Virgo, respectively.
Figure S1: i0−(g − i)0 CMDs for (A) the Virgo cluster field (R < 6 deg), (B) the reference
field with the same area as the Virgo cluster field (VCF), and (C) the difference between (A) and (B). (D), (E) and (F): similarly for the Control field (CF) (6 < R < 9 deg). The boxes represent
the boundaries selecting blue globular clusters (BGC), red globular clusters (RGC), bright blue foreground stars (BBS), faint blue foreground stars (FBS), bright red foreground stars (BRS), and faint red foreground stars (FRS). Blue stars in the strong vertical structures in (C) and (F) are mostly Virgo overdensity stars. Darker or redder color represents higher number density.
Figure S2: Surface number density maps for (A) all the point sources with blue globular cluster color, (B) the blue foreground stars, and (C) the difference of these two. (D), (E), and (F): similarly for the red globular clusters. (G), (H), and (I): similarly for all the globular clusters. Large circles represent the boundaries for the Virgo cluster field (R < 6 deg) and the Control
field (6 < R < 9 deg). North is up and east to the left. Redder color represents higher number
References and Notes
S1. J. K. Adelman-McCarthy et al., Astron. Astrophys. J. Supp. 175, 297-313 (2008) S2. Z. Ivezic et al., Astrophys. J. 124, 2364-2400 (2002)