HAL Id: inserm-00660290
https://www.hal.inserm.fr/inserm-00660290
Submitted on 16 Jan 2012
HAL is a multi-disciplinary open access
archive for the deposit and dissemination of
sci-entific research documents, whether they are
pub-lished or not. The documents may come from
teaching and research institutions in France or
abroad, or from public or private research centers.
L’archive ouverte pluridisciplinaire HAL, est
destinée au dépôt et à la diffusion de documents
scientifiques de niveau recherche, publiés ou non,
émanant des établissements d’enseignement et de
recherche français ou étrangers, des laboratoires
publics ou privés.
Accuracy and precision of end expiratory lung volume
measurements by automated nitrogen washout/washin
technique in patients with acute respiratory distress
syndrome.
Jean Dellamonica, Nicolas Lerolle, Cyril Sargentini, Gaetan Beduneau,
Fabiano Di Marco, Alain Mercat, Jean-Christophe Richard, Jean-Luc Diehl,
Jordi Mancebo, Jean-Jacques Rouby, et al.
To cite this version:
Jean Dellamonica, Nicolas Lerolle, Cyril Sargentini, Gaetan Beduneau, Fabiano Di Marco, et
al.. Accuracy and precision of end expiratory lung volume measurements by automated nitrogen
washout/washin technique in patients with acute respiratory distress syndrome..
Critical Care,
R E S E A R C H
Open Access
Accuracy and precision of end-expiratory
lung-volume measurements by automated nitrogen
washout/washin technique in patients with acute
respiratory distress syndrome
Jean Dellamonica
1,2,9*, Nicolas Lerolle
3,4, Cyril Sargentini
4, Gaetan Beduneau
5, Fabiano Di Marco
6, Alain Mercat
4,
Jean-Christophe M Richard
5, Jean-Luc Diehl
3, Jordi Mancebo
7, Jean-Jacques Rouby
8, Qin Lu
8, Gilles Bernardin
2and
Laurent Brochard
1,9,10Abstract
Introduction: End-expiratory lung volume (EELV) is decreased in acute respiratory distress syndrome (ARDS), and bedside EELV measurement may help to set positive end-expiratory pressure (PEEP). Nitrogen washout/washin for EELV measurement is available at the bedside, but assessments of accuracy and precision in real-life conditions are scant. Our purpose was to (a) assess EELV measurement precision in ARDS patients at two PEEP levels (three pairs of measurements), and (b) compare the changes (∆) induced by PEEP for total EELV with the PEEP-induced changes in lung volume above functional residual capacity measured with passive spirometry (∆PEEP-volume). The minimal predicted increase in lung volume was calculated from compliance at low PEEP and ∆PEEP to ensure the validity of lung-volume changes.
Methods: Thirty-four patients with ARDS were prospectively included in five university-hospital intensive care units. ∆EELV and ∆PEEP volumes were compared between 6 and 15 cm H2O of PEEP.
Results: After exclusion of three patients, variability of the nitrogen technique was less than 4%, and the largest difference between measurements was 81 ± 64 ml. ∆EELV and ∆PEEP-volume were only weakly correlated (r2= 0.47); 95% confidence interval limits, -414 to 608 ml). In four patients with the highest PEEP (≥ 16 cm H2O), ∆EELV
was lower than the minimal predicted increase in lung volume, suggesting flawed measurements, possibly due to leaks. Excluding those from the analysis markedly strengthened the correlation between ∆EELV and ∆PEEP volume (r2= 0.80).
Conclusions: In most patients, the EELV technique has good reproducibility and accuracy, even at high PEEP. At high pressures, its accuracy may be limited in case of leaks. The minimal predicted increase in lung volume may help to check for accuracy.
Introduction
In acute lung injury (ALI) and acute respiratory distress syndrome (ARDS), functional residual capacity (FRC) is markedly decreased as a result of numerous factors, including alveolar collapse, pulmonary edema with alveolar flooding, supine position, sedation-induced
diaphragm inactivity, and cardiac enlargement [1-5]. Measuring FRC (or end-expiratory lung volume [EELV] when PEEP is applied) might help to measure the aera-ted lung available for ventilation and to better monitor the effects of ventilation strategies. Reproducible mea-surement techniques that can be used at the bedside are needed to minimize overdistention and to determine which patients may benefit from recruitment strategies. Repeated CT scans and gas-dilution techniques are two validated methods of lung-volume measurement but are
* Correspondence: jean.dellamonica@inserm.fr
1
Réanimation Médicale, AP-HP, Centre Hospitalier Albert Chenevier, Henri Mondor, avenue Marechal de Lattre de Tassigny, Créteil, 94000, France Full list of author information is available at the end of the article
© 2011 Dellamonica et al.; licensee BioMed Central Ltd. This is an open access article distributed under the terms of the Creative Commons Attribution License (http://creativecommons.org/licenses/by/2.0), which permits unrestricted use, distribution, and reproduction in any medium, provided the original work is properly cited.
so complex that their use has been confined to research settings. Recently, washout/washin techniques using oxygen [6,7] or nitrogen [8,9] have been made available in ICU ventilators, allowing bedside EELV measurement. A comparison of the nitrogen washout/washin EELV measurement with helium dilution or CT scan had shown good correlations in stable patients ventilated with low-PEEP levels [8]. The limitations of the nitrogen washout/washin technique for EELV measurement under other conditions, such as high FiO2or high PEEP,
have not been fully investigated [10].
PEEP-induced changes in lung volume (referred to as PEEP-volume) can also be assessed simply at the bed-side by using passive spirometry. This accurate method requires a long expiration to zero end-expiratory pres-sure (ZEEP), where FRC is assumed to be reached. When considering the changes induced by two different levels of PEEP in a given patient, the difference in EELV (that is, ∆EELV = EELVhigh PEEP- EELVlow PEEP) should
theoretically be similar to the difference in ∆PEEP-volume (PEEP-∆PEEP-volumehigh PEEP- PEEP-volumelow PEEP),
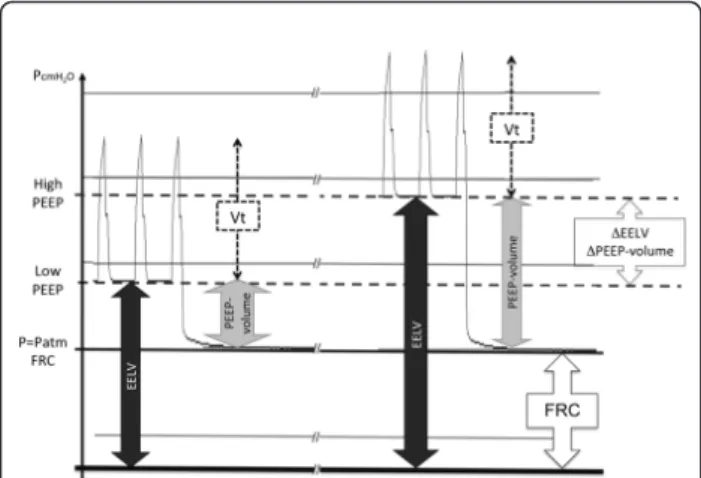
assuming that the FRC has not been modified by the PEEP changes (see Figure 1).
We designed a multicenter study with the primary objective of investigating the precision (reproducibility) of the nitrogen washout/washin technique for EELV measurement in patients with ALI/ARDS at two PEEP levels, including a high level, with a small variation in oxygen concentration (10%). Our secondary objective was to evaluate the accuracy of the technique by
comparing PEEP-induced changes (∆) in lung volume with the nitrogen technique or the PEEP-volume above the FRC measured with passive spirometry. As PEEP-volume is relatively easy to measure accurately with a calibrated pneumotachograph, it may therefore be con-sidered a “gold standard.” Because we expected possible discrepancies between the two techniques, we also com-pared the measured changes in lung volume (∆EELV and ∆PEEP-volume) with the minimal predicted increase in lung volume, computed from static compli-ance (Cstat) at low PEEP and ∆PEEP. The minimal
pre-dicted increase in lung volume was considered the smallest-volume increase that can occur. We have also used this method to evaluate alveolar recruitment, as described elsewhere [11].
Material and methods
This was a multicenter study performed in five French medical intensive care units at the Henri Mondor Uni-versity Hospital in Créteil, European Georges Pompidou University Hospital in Paris, Angers University Hospital in Angers, l’Archet 1 University Hospital in Nice, and Charles Nicolle University Hospital in Rouen. In compli-ance with French legislation, the institutional review board of the Henri Mondor University Hospital approved the protocol for all centers and waived the need for informed consent, as PEEP optimization was considered part of standard care. The patients or next of kin received information about the study.
Patients
Patients were enrolled if they met the standard criteria for acute lung injury (ALI) [12]: partial pressure of arterial oxygen over fraction of inspired oxygen (PaO2/
FiO2) less than 300 mm Hg, bilateral pulmonary
infil-trates on the chest radiograph, and no clinical evidence of left atrial hypertension. Most patients had ARDS, defined as PaO2/FiO2 less than 200 mm Hg. Exclusion
criteria were age younger than 18 years, pregnancy, his-tory of chronic obstructive pulmonary disease and/or lung surgery, and hemodynamic instability, defined as an increase in vasoactive drug (epinephrine, norepi-nephrine) dosages in the last 6 hours. All bedside ante-rior-posterior chest radiographs were reviewed by two independent observers (JJR and QL) according to CT Scan ARDS Study Group criteria to determine the pat-tern of aeration loss: lobar radiologic hyperattenuation predominating in the lower lobes (focal disease), diffuse radiologic hyperattenuation evenly distributed through-out the upper and lower lobes (white lungs), or patchy radiologic hyperattenuation involving the upper and lower lobes with persistent aeration of part of the upper lobes [13]. Patients with diffuse or patchy aeration loss were classified as having nonfocal disease [14].
Figure 1 Schematic representation of the pressure-time diagram at the end of each epoch in a single patient. Data at both PEEP levels studied are presented. Patm, atmospheric pressure;
EELV, end-expiratory lung volume measured by using the nitrogen technique; PEEP-volume, volume trapped by PEEP above the functional residual capacity, measured by using a long exhalation to atmospheric pressure (zero end-expiratory pressure); Vt, tidal volume;
∆EELV, EELVhigh PEEP- EELVlow PEEP; ∆PEEP-volume, PEEP-volumehigh PEEP- PEEP-volumelow PEEP.
Dellamonica et al. Critical Care 2011, 15:R294 http://ccforum.com/content/15/6/R294
Ventilation strategies
All patients received volume-assist control ventilation by using an Engström ICU ventilator (Version V4 and V5) with a CVOX module sensor (V4.5) General Electric, Madison (WI). This ventilator provides bedside EELV measurements by using the multibreath nitrogen-wash-out technique (MBNW) [8,15-18]. The oxygenation goal was achieved by adjusting FiO2, which was maintained
constant during the study. Tidal volume was set at 6 ml/kg of predicted body weight. All patients received two PEEP levels, each for 45 minutes, in random order. PEEP levels were set as in the EXPRESS study [19]. In the minimal-distention strategy, PEEP and inspiratory Pplatwere kept as low as possible while keeping arterial
oxygen saturation at 88% to 92% or more. External PEEP was set to maintain total PEEP (the sum of exter-nal and intrinsic PEEP) between 5 and 9 cm H2O. In
the optimized recruitment strategy, PEEP was adjusted based on Pplatand was kept as high as possible without
increasing the inspiratory Pplatabove 28 to 30 cm H2O.
All patients were sedated. Neuromuscular blocking agents were administered only if deemed necessary by the clinician in charge.
Measurements
Lung volume and precision of measurements
At the end of each 45-minute period, blood was drawn for arterial blood gas measurement, and EELV was mea-sured 3 times by using the MBNW technique to assess precision. This technique has been described elsewhere [9,16]. In brief, continuous measurement of end-tidal O2
and CO2during a change in FiO2(here, 10%) allows the
calculation of nitrogen washout and washin and subse-quently of the aerated lung volume. Two assumptions are made: heterogeneity in alveolar gas distribution is considered constant during the measurement procedure, and cellular metabolism and gas exchange between lung capillaries and alveoli are considered stable during the MBNW procedure. The mean of the washout and washin data is computed automatically if the difference between the two is less than 20% (cut-off determined by the manufacturer). Because FRC is a volume measured without PEEP (that is, at atmospheric pressure), we used the term end-expiratory lung volume (EELV) for the volume measured in our study. Three EELV measure-ments were performed at each PEEP level.
PEEP-volume (above FRC) by using passive spirometry
Prolonged exhalation (15 seconds) to the elastic equili-brium volume at ZEEP was performed, at the end of a 45-minute period, to standardize lung-volume history. Pressure and flow were recorded by using a dedicated computer linked to the ventilator (sample every 0.04 seconds), pressure, and flow curves were drawn off-line by using the software (Acknowledge 3.7.3) Goleta Ca.
Volumes were measured by flow integration. PEEP-volume above FRC was obtained by subtracting the insufflated tidal volume from the flow-signal integration of this long exhalation. PEEP-volume was measured at the end of each of the two PEEP periods.
Measurement of compliance
Cstatof the respiratory system was computed by dividing
tidal volume by Pplat(measured during an
end-inspira-tory pause (1 second)) minus total PEEP. Total PEEP was measured by using an expiratory pause (1 second).
A pressure-volume curve was obtained during low-flow inflation from the low PEEP level to 30 cm H2O to
check that compliance (Clin) was linear or not
decreas-ing within this range.
Minimal predicted increase in lung volume
The minimal predicted increase in lung volume [20] is the smallest possible lung-volume increase that can be induced by PEEP. It was computed from Cstatat low
PEEP, as follows:
Minimal predicted increase in lung volume (milliliters)
= CstatlowPEEP ·∆PEEP
where ∆PEEP is the difference between high and low PEEP.
This minimal increase should be equal to (if no recruitment occurs) or smaller than (if alveolar recruit-ment occurs) ∆EELV and ∆PEEP-volume. We evaluated the slope of the pressure-volume curve during tidal inflation to check that compliance did not decrease over tidal inflation and, therefore, that the computed minimal increase was indeed the lowest possible increase that could occur.
Statistical analysis
All variables are described as median (interquartile range). Precision of the nitrogen technique results was assessed by calculating the coefficient of variation for the three pairs of washout/washin measurements. The coefficient of variation was calculated as the SD of the differences divided by the mean of all measurements. The Bland and Altman method [21] was used to evalu-ate reproducibility of the nitrogen technique and to evaluate agreement between ∆EELV and ∆PEEP-volume. The largest difference between the three EELV measure-ments at each PEEP level was plotted against the mean. Accuracy of the technique was assessed by comparing the changes in lung volume induced by the PEEP increase. ∆EELV was plotted against ∆PEEP-volume. Correlations were evaluated by using linear regression (r2). Paired values were compared by using the Wil-coxon test. The Fisher t test and Mann-Whitney U test were used when appropriate. Values of p smaller than 0.05 were considered significant.
Results
We studied 37 patients, of whom three were excluded from the analysis because of poor signal quality (two patients had unstable signals during PEEP-volume recording (spontaneous breathing), and one had greater than 20% differences between washout and washin values). Table 1 reports the main characteristics of the 34 patients included in the analysis, 32 with ARDS and two with ALI. Table 2 reports data on ventilation mechanics, ventilator settings, measured volumes, and calculated volumes at each PEEP level. Both PEEP stra-tegies were well tolerated by all patients. No patients experienced any significant desaturation during the study measurements (EELV or PEEP-volume).
Precision of the nitrogen technique
The 34 patients had three pairs of EELV measurements at each PEEP level (that is, 204) (Figure 2). Of these measurements, six (2.9%), in six different patients (two
at low PEEP and four at high PEEP) showed greater than 20% differences between washout and washin values and were therefore excluded. The coefficient of variability for the remaining measurements was 3.0% at low PEEP and 3.9% at high PEEP (p < 0.0001).
The largest mean difference between the three pairs of EELV measurements was 81 ± 64 ml. The difference was larger at higher PEEP levels (53 ± 43 ml versus 108 ± 69 ml; p = 0.004) but was similar when expressed as a percentage of EELV (Figure 2). Mean FiO2 was 67 ±
17%; the highest FiO2 levels were not associated with
greater EELV variability.
Comparison with PEEP-induced changes in lung volume and accuracy of the method
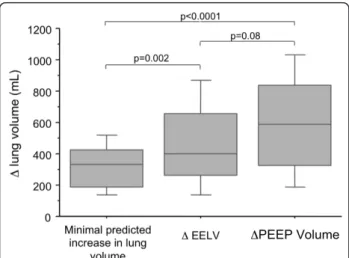
Minimal predicted increase in lung volume, ∆EELV, and ∆PEEP-volume are shown in Figure 3.
∆EELV and ∆PEEP-volume were only modestly corre-lated with each other (Figure 4a) (∆EELV = 62.4 + [0.73 ∆PEEP-volume]; r2 = 0.47). Bias between these two measuring methods was 97 ± 255 ml, with a 95% confi-dence interval for limits of agreement of -414 to 608 ml (Figure 5).
The relation between the minimal predicted increase in lung volume and ∆EELV was dispersed (Figure 4b). In particular, four patients had ∆EELV values that were substantially lower than the minimal predicted increase in lung volume (red dots; Figure 4b), suggesting under-estimation of the volume change by EELV measurement. All four patients received PEEP levels ≥ 16 cm H2O,
compared with only five of the 30 remaining patients (p = 0.003), and three had focal aeration loss compared with only three (10%) of the 30 remaining patients (p = 0.01). FiO2 was high (80% ± 16%) in these patients but
was not significantly higher than that in the other patients (p = 0.1). The cause of ARDS (pulmonary or extrapulmonary) was not associated with measurement discrepancies. The high PEEP values suggested possible occurrence of leaks that could invalidate the measure-ments. When we excluded these four patients whose ∆EELV values were lower than the predicted minimal increase in lung volume, the correlation between ∆EELV and ∆PEEP-volume became substantially stronger (r2 = 0.80; Figure 4c).
Discussion
The main results of this physiological study can be sum-marized as follows: (a) the MBNW technique at two PEEP levels provided reproducible EELV measurements with acceptable precision; and (b) compared with ∆PEEP-volume and the minimal predicted increase in lung volume due to PEEP, ∆EELV measured by using the nitrogen technique seemed accurate for measuring lung-volume variations induced by PEEP. In a few
Table 1 Patient characteristics
N = 34 Age, years 61.0 (45; 72) Males/Females (n) 28/6 SAPS 2 55.5 (35; 65) Vasoactive agents (n of patients/total patients) 20/34 Pulmonary/extrapulmonary cause of ALI/ARDS (number of patients)
26/8 Diffuse/Focal aeration loss (number of patients) 28/6 Ventilation days, median (IQR) 13 (11; 21) Alive at ICU discharge, number of patients/total patients 22/4
SAPS II, Simplified Acute Physiology Score [32].
Table 2 Arterial blood gas values and ventilation during the minimal-distention (low PEEP) and high-recruitment (high PEEP) periods
Low PEEP High PEEP p value pH 7.37 (7.32; 7.44) 7.36 (7.30; 7.41) 0.014 PaO2/FiO2 135 (106; 175) 174 (122; 220) < 0.0001 SaO2(%) 95 (93; 97) 97 (95; 99) 0.0001 PaCO2(mm Hg) 41 (36; 46) 42 (36; 48) 0.1 PEEPtot(cm H2O) 6 (5; 6) 15 (13; 17) < 0.0001 Pplat(cm H2O) 18 (16; 22) 29 (29; 31) < 0.0001 Cstat(ml/cm H2O) 33.3 (25.0; 39.9) 28.6 (23.9; 33.8) 0.003 Clin(ml/cm H2O) 36.0 (26.0; 42.7) 30.0 (24.8; 34.5) < 0.0001 EELV (ml) 908 (693; 1,180) 1573 (1,025; 1,905) < 0.0001 PEEP-volume (ml) 186 (120; 261) 815 (473; 1,122) < 0.0001
Cstat, static compliance computed as tidal volume/(Pplatat low PEEP-low PEEP);
Clin, linear compliance measured on the linear part of the pressure-volume
curve; values of p for the comparison were calculated for low PEEP versus high PEEP; values are expressed as median (interquartile range).
Dellamonica et al. Critical Care 2011, 15:R294 http://ccforum.com/content/15/6/R294
patients, however, the method could give erroneous results, especially in case of high pressures. Comparing with the minimal predicted increase in lung volume may help to detect these errors.
Nitrogen technique variability
The MBNW technique described by Olegard et al. [9] allows bedside EELV measurement by using small and safe FiO2 increases and decreases (± 10%). Precision was
greater with larger FiO2 changes [8,16], because nitrogen
changes were greater. The small (10%) FiO2change used
in our study may have contributed to the test-retest variability but was deemed safer for our hypoxemic patients. All measurements were performed at the steady state 45 minutes after a change in PEEP, and no other interventions likely to affect cardiac output were performed, the patients being considered stable. Fewer than 3% of the EELV measurements failed (greater than 20% difference between washout and washin). Because the technique used to measure EELV involves comput-ing the mean of washin and washout values [9], we assessed test-retest variability without comparing wash-out with washin. The variability we found in patients with ALI or ARDS at each PEEP level was comparable to that reported by Olegard et al. [9], who studied chiefly postoperative patients. As with the helium-dilu-tion technique, absolute variability of the nitrogen tech-nique in our study increased with higher PEEP and higher EELV. However, variability relative to absolute lung volume did not differ for higher EELV values (Fig-ure 2). The lower precision reported by the manufac-turer for FiO2 > 70% was not replicated here, but the
flawed measurements seemed to occur at higher FiO2
values.
PEEP-induced changes in lung volume
EELV values at low PEEP in our study were very low (less than 1,000 ml at low PEEP) and similar to values
Figure 2 Largest difference (absolute values) between the three EELV values obtained in each patient, as a function of EELV. The difference between the measured values was larger at high PEEP (p = 0.004). When expressed as a percentage of EELV, no difference was observed according to PEEP level. Gray diamonds, low PEEP; solid circles, high PEEP; red diamond, mean value at low PEEP; blue circle, mean value at high PEEP; vertical and horizontal bars, the standard deviation.
Figure 3 Median and interquartile range of minimal predicted increase in lung volume, ∆EELV, and ∆PEEP-volume. Minimal predicted increase in lung volume, 330 (190 to 421) ml. ∆EELV, 402 (263 to 654) ml. ∆PEEP-volume, 585 (325 to 822) ml.
obtained previously by using CT scan [2,22] or helium dilution [23] in ARDS patients. PEEP-volume and EELV represent different volumes obtained with two totally independent methods. We thus compared lung-volume changes induced by PEEP. ∆EELV and ∆PEEP-volume; both evaluated the PEEP-induced lung volume increase. The correlation was good in some patients but poor in others (Figure 5). The variability of EELV values may have contributed to a poor correlation. We sought to detect obviously flawed data by using a third method. Katz et al. [20] demonstrated that the lung-volume increase induced by PEEP changes was larger than expected from the airway-pressure change and compli-ance at low PEEP, indicating progressive lung recruit-ment [11]. We therefore calculated the minimal predicted increase in lung volume induced by PEEP, which is easily derived from Cstatat low PEEP [20]. In
addition, by tracing a pressure-volume curve over the tidal-volume range at low PEEP, we checked that com-pliance did not decrease significantly within this volume
range, to ensure that no volume increase smaller than the calculated minimal increase could occur. This method might prove useful at the bedside to assess the lower ∆EELV limit. Any difference between ∆EELV and this minimal predicted increase in lung volume may be considered an estimate of alveolar recruitment [11]. ∆PEEP-volume may slightly underestimate the lung-volume change, because of the assumption that FRC is unchanged after exhalation from high or low PEEP (Fig-ure 3). Yet recent data [24] suggest that FRC may increase after high PEEP compared with low-PEEP ven-tilation. We used a 15-second expiration to ZEEP to minimize this problem. Our analysis, made at two PEEP levels, shown elsewhere, suggested that FRC was stable for our measurements [11].
Obvious discrepancies occurred in four patients. All four patients had the highest set PEEP levels (> 16 cm H2O). Although not proven, it is very possible that
microleaks due to high set PEEP may explain discrepan-cies by decreasing the EELVhigh PEEP measurement and
Figure 4 ∆EELV and ∆PEEP-volume correlation. (a) Correlation between ∆EELV and ∆PEEP-volume in all patients (r2= 0.47). Straight line is correlation: ∆EELV = 62.4 + 0.7 ∆PEEP-volume. (b) Relation between the minimal predicted increase in lung volume and ∆EELV. Red dots: patients in whom measurement errors were detected; dashed line, identity. (c) Correlation between ∆EELV and ∆PEEP-volume after exclusion of the four patients with obvious ∆EELV measurement errors (r2= 0.80). Straight line is correlation: ∆EELV = -42.1 + 1.0 ∆PEEP-volume.
Figure 5 Comparison according to Bland and Altman [21]of measurements of ∆PEEP-volume and ∆EELV. Bias between the two methods was 97 ± 255 ml with a 95% confidence interval for the limits of agreement (dashed lines) of -414 to 608 ml.
Dellamonica et al. Critical Care 2011, 15:R294 http://ccforum.com/content/15/6/R294
therefore ∆EELV. The higher set FiO2 values in these
four patients may have adversely affected measurement precision, although further studies are needed to evalu-ate this possibility. Patients with focal aeration loss are at higher risk of hyperinflation versus recruitment [25], and the lung-volume distribution due to PEEP depends closely on disparities in regional lung compliance [26]. Another hypothesis could be that EELV discrepancies in patients with higher PEEP and focal aeration loss may be related to differences in regional gas distribution. MBNW equilibration may be impaired by regional time-constant inequalities [27], and a higher dead space due to higher PEEP [28] and hyperinflation [29-31]. In clini-cal practice, we suggest comparing the increase in EELV with PEEP to the minimal predicted increase in lung volume to detect erroneous measurements.
Conclusions
The MBNW technique exhibits acceptable accuracy and precision for lung-volume measurement at different PEEP levels in patients with ARDS. Substantial underes-timation of lung-volume changes may occur, at least in some patients, presumably in case of leaks due to high pressures, and additional measurements may be required to check this accuracy.
Key messages
• Nitrogen washin/washout technique exhibits acceptable accuracy and precision for lung-volume measurement at different PEEP levels and high FiO2
in patients with ARDS.
• Underestimation of lung-volume changes may occur in some patients presumably in case of leaks due to high pressures.
Abbreviations
ALI: acute lung injury: ARDS: acute respiratory distress syndrome; Clin: linear
compliance; Cstat: static compliance; EELV: end-expiratory lung volume; FRC:
functional residual capacity; MBNW: multibreath nitrogen washout; PEEP: positive end-expiratory pressure; PEEP-volume: trapped lung volume due to PEEP; Pplat: plateau pressure; Vt: tidal volume.
Acknowledgements
General Electric provided the Engström ventilators for the study and a research grant, but had no access to the data, analysis, or interpretation. Author details
1Réanimation Médicale, AP-HP, Centre Hospitalier Albert Chenevier, Henri
Mondor, avenue Marechal de Lattre de Tassigny, Créteil, 94000, France.
2
Réanimation Médicale, CHU de Nice, Hôpital L’Archet, Université de Nice Sophia Antipolis, Route de St Antoine de Ginestière, Nice 06200, France.
3Réanimation Médicale, AP-HP, Hôpital Européen Georges Pompidou, rue
Leblanc, Paris 75015, France.4Réanimation Médicale, CHU Angers, rue Larrey,
Angers 49100, France.5Réanimation Médicale & UPRES EA 3830, CHU Charles
Nicolle, rue Germont, Rouen 76031, France.6Pneumologia Ospedale San
Paolo, Universita degli Studi di Milano, via A. di Rudini 8, Milano 20142, Italy.
7Servei de Medicina Intensiva, Hospital de Sant Pau, C. Sant Quinti 89,
Barcelona, 08041, Spain.8Réanimation Polyvalente, AP-HP, Hôpital Pitié Salpêtrière, UPMC, Université Paris 6, Boulevard de l’Hôpital, Paris 75014,
France.9INSERM U-955, Université Paris EST, avenue Marechal de Lattre de
Tassigny, Créteil 94000, France.10Intensive Care Department, University
Hospital and University of Geneva, rue Gabrielle Perret-Gentil, Geneva 1211, Switzerland.
Authors’ contributions
JD designed the study, and participated in data acquisition, statistical analysis, interpretation, and wrote the manuscript. NL participated in study design, data acquisition, statistical analysis, and manuscript editing. CS participated in data acquisition. GB participated in data acquisition. FDM participated in study design. AM, JCMR, JLD, and GB participated in study design and manuscript editing. JM participated in manuscript editing. JJR and QL participated in data analysis and manuscript editing. LB participated in study design, data analysis and interpretation, and manuscript writing. All authors read and approved the final manuscript.
Competing interests
JD, LB, JCMR, AM, and their institution are involved in a patent with General Electric describing a method used to estimate alveolar recruitment. A grant was also received from General Electric for the conduct of the study. General Electric had no access to the data or to the content of the manuscript. All authors kept full control of the analysis of the data and the writing of the manuscript. JM and his team are currently doing research regarding FRC measurements, which is sponsored by a GE grant. NL, CS, GB, JLD, FDM, JJR, QL, and GB declare that they have no competing interests. Received: 29 July 2011 Revised: 4 December 2011
Accepted: 7 December 2011 Published: 7 December 2011 References
1. Amato MB, Barbas CS, Medeiros DM, Magaldi RB, Schettino GP, Lorenzi-Filho G, Kairalla RA, Deheinzelin D, Munoz C, Oliveira R, Takagaki TY, Carvalho CR: Effect of a protective-ventilation strategy on mortality in the acute respiratory distress syndrome. N Engl J Med 1998, 338:347-54. 2. Gattinoni L, Caironi P, Cressoni M, Chiumello D, Ranieri VM, Quintel M,
Russo S, Patroniti N, Cornejo R, Bugedo G: Lung recruitment in patients with the acute respiratory distress syndrome. N Engl J Med 2006, 354:1775-86.
3. Ranieri VM, Suter PM, Tortorella C, De Tullio R, Dayer JM, Brienza A, Bruno F, Slutsky AS: Effect of mechanical ventilation on inflammatory mediators in patients with acute respiratory distress syndrome: a randomized controlled trial. JAMA 1999, 282:54-61.
4. Rouby JJ, Constantin JM, Roberto De A, Girardi C, Zhang M, Lu Q: Mechanical ventilation in patients with acute respiratory distress syndrome. Anesthesiology 2004, 101:228-34.
5. Terragni PP, Rosboch G, Tealdi A, Corno E, Menaldo E, Davini O, Gandini G, Herrmann P, Mascia L, Quintel M, Slutsky AS, Gattinoni L, Ranieri VM: Tidal hyperinflation during low tidal volume ventilation in acute respiratory distress syndrome. Am J Respir Crit Care Med 2007, 175:160-6. 6. Patroniti N, Saini M, Zanella A, Weismann D, Isgro S, Bellani G, Foti G,
Pesenti A: Measurement of end-expiratory lung volume by oxygen washin-washout in controlled and assisted mechanically ventilated patients. Intensive Care Med 2008, 34:2235-40.
7. Maisch S, Boehm SH, Weismann D, Reissmann H, Beckmann M, Fuellekrug B, Meyer A, Schulte Am Esch J: Determination of functional residual capacity by oxygen washin-washout: a validation study. Intensive Care Med2007, 33:912-16.
8. Chiumello D, Cressoni M, Chierichetti M, Tallarini F, Botticelli M, Berto V, Mietto C, Gattinoni L: Nitrogen washout/washin, helium dilution and computed tomography in the assessment of end expiratory lung volume. Crit Care 2008, 12:R150.
9. Olegard C, Sondergaard S, Houltz E, Lundin S, Stenqvist O: Estimation of functional residual capacity at the bedside using standard monitoring equipment: a modified nitrogen washout/washin technique requiring a small change of the inspired oxygen fraction. Anesth Analg 2005, 101:206-12, table of contents.
10. Brewer LM, Orr JA, Sherman MR, Fulcher EH, Markewitz BA: Measurement of functional residual capacity by modified multiple breath nitrogen washout for spontaneously breathing and mechanically ventilated patients. Br J Anaesth 2011, 107:796-805.
11. Dellamonica J, Lerolle N, Sargentini C, Beduneau G, Di Marco F, Mercat A, Richard JC, Diehl JL, Mancebo J, Rouby JJ, Lu Q, Bernardin G, Brochard L: PEEP-induced changes in lung volume in acute respiratory distress syndrome: two methods to estimate alveolar recruitment. Intensive Care Med2011, 37:1595-1604.
12. Artigas A, Bernard GR, Carlet J, Dreyfuss D, Gattinoni L, Hudson L, Lamy M, Marini JJ, Matthay MA, Pinsky MR, Spragg R, Suter PM: The American-European Consensus Conference on ARDS, part 2. Ventilatory, pharmacologic, supportive therapy, study design strategies and issues related to recovery and remodeling. Intensive Care Med 1998, 24:378-98. 13. Malbouisson LM, Busch CJ, Puybasset L, Lu Q, Cluzel P, Rouby JJ: Role of the heart in the loss of aeration characterizing lower lobes in acute respiratory distress syndrome; CT Scan ARDS Study Group. Am J Respir Crit Care Med2000, 161:2005-12.
14. Rouby JJ, Puybasset L, Nieszkowska A, Lu Q: Acute respiratory distress syndrome: lessons from computed tomography of the whole lung. Crit Care Med2003, 31:S285-95.
15. Heinze H, Eichler W: Measurements of functional residual capacity during intensive care treatment: the technical aspects and its possible clinical applications. Acta Anaesthesiol Scand 2009, 53:1121-30.
16. Bikker IG, Scohy TV, Ad JJCB, Bakker J, Gommers D: Measurement of end-expiratory lung volume in intubated children without interruption of mechanical ventilation. Intensive Care Med 2009, 35:1749-53. 17. Bikker IG, van Bommel J, Reis Miranda D, Bakker J, Gommers D:
End-expiratory lung volume during mechanical ventilation: a comparison with reference values and the effect of positive end-expiratory pressure in intensive care unit patients with different lung conditions. Crit Care 2008, 12:R145.
18. Scohy TV, Bikker IG, Hofland J, de Jong PL, Bogers AJ, Gommers D: Alveolar recruitment strategy and PEEP improve oxygenation, dynamic compliance of respiratory system and end-expiratory lung volume in pediatric patients undergoing cardiac surgery for congenital heart disease. Paediatr Anaesth 2009, 19:1207-12.
19. Mercat A, Richard JC, Vielle B, Jaber S, Osman D, Diehl JL, Lefrant JY, Prat G, Richecoeur J, Nieszkowska A, Gervais C, Baudot J, Bouadma L, Brochard L, Expiratory Pressure (Express) Study Group: Positive end-expiratory pressure setting in adults with acute lung injury and acute respiratory distress syndrome: a randomized controlled trial. JAMA 2008, 299:646-55. 20. Katz JA, Ozanne GM, Zinn SE, Fairley HB: Time course and mechanisms of
lung-volume increase with PEEP in acute pulmonary failure. Anesthesiology1981, 54:9-16.
21. Bland JM, Altman DG: Statistical methods for assessing agreement between two methods of clinical measurement. Lancet 1986, 1:307-10. 22. Malbouisson LM, Muller JC, Constantin JM, Lu Q, Puybasset L, Rouby JJ:
Computed tomography assessment of positive end-expiratory pressure-induced alveolar recruitment in patients with acute respiratory distress syndrome. Am J Respir Crit Care Med 2001, 163:1444-50.
23. Chiumello D, Carlesso E, Cadringher P, Caironi P, Valenza F, Polli F, Tallarini F, Cozzi P, Cressoni M, Colombo A, Marini JJ, Gattinoni L: Lung stress and strain during mechanical ventilation for acute respiratory distress syndrome. Am J Respir Crit Care Med 2008, 178:346-55. 24. Patroniti N, Bellani G, Cortinovis B, Foti G, Maggioni E, Manfio A, Pesenti A:
Role of absolute lung volume to assess alveolar recruitment in acute respiratory distress syndrome patients. Crit Care Med 2010, 38:1300-1307. 25. Vieira SR, Puybasset L, Lu Q, Richecoeur J, Cluzel P, Coriat P, Rouby JJ: A
scanographic assessment of pulmonary morphology in acute lung injury: significance of the lower inflection point detected on the lung pressure-volume curve. Am J Respir Crit Care Med 1999, 159:1612-23. 26. Puybasset L, Gusman P, Muller JC, Cluzel P, Coriat P, Rouby JJ: Regional
distribution of gas and tissue in acute respiratory distress syndrome; III. Consequences for the effects of positive end-expiratory pressure; CT Scan ARDS Study Group, Adult Respiratory Distress Syndrome. Intensive Care Med2000, 26:1215-27.
27. Pelosi P, Cereda M, Foti G, Giacomini M, Pesenti A: Alterations of lung and chest wall mechanics in patients with acute lung injury: effects of positive end-expiratory pressure. Am J Respir Crit Care Med 1995, 152:531-7.
28. Mekontso Dessap A, Charron C, Devaquet J, Aboab J, Jardin F, Brochard L, Vieillard-Baron A: Impact of acute hypercapnia and augmented positive end-expiratory pressure on right ventricle function in severe acute respiratory distress syndrome. Intensive Care Med 2009, 35:1850-8.
29. Ventilation with lower tidal volumes as compared with traditional tidal volumes for acute lung injury and the acute respiratory distress syndrome; The Acute Respiratory Distress Syndrome Network. N Engl J Med2000, 342:1301-8.
30. Grasso S, Fanelli V, Cafarelli A, Anaclerio R, Amabile M, Ancona G, Fiore T: Effects of high versus low positive end-expiratory pressures in acute respiratory distress syndrome. Am J Respir Crit Care Med 2005, 171:1002-8. 31. Vieira SR, Puybasset L, Richecoeur J, Lu Q, Cluzel P, Gusman PB, Coriat P,
Rouby JJ: A lung computed tomographic assessment of positive end-expiratory pressure-induced lung overdistension. Am J Respir Crit Care Med1998, 158:1571-7.
32. Le Gall JR, Lemeshow S, Saulnier F: A new Simplified Acute Physiology Score (SAPS II) based on a European/North American multicenter study. JAMA1993, 270:2957-63.
doi:10.1186/cc10587
Cite this article as: Dellamonica et al.: Accuracy and precision of end-expiratory lung-volume measurements by automated nitrogen washout/washin technique in patients with acute respiratory distress syndrome. Critical Care 2011 15:R294.
Submit your next manuscript to BioMed Central and take full advantage of:
• Convenient online submission
• Thorough peer review
• No space constraints or color figure charges
• Immediate publication on acceptance
• Inclusion in PubMed, CAS, Scopus and Google Scholar
• Research which is freely available for redistribution
Submit your manuscript at www.biomedcentral.com/submit
Dellamonica et al. Critical Care 2011, 15:R294 http://ccforum.com/content/15/6/R294