Publisher’s version / Version de l'éditeur:
Vous avez des questions? Nous pouvons vous aider. Pour communiquer directement avec un auteur, consultez la première page de la revue dans laquelle son article a été publié afin de trouver ses coordonnées. Si vous n’arrivez pas à les repérer, communiquez avec nous à [email protected]. Questions? Contact the NRC Publications Archive team at
[email protected]. If you wish to email the authors directly, please see the first page of the publication for their contact information.
https://publications-cnrc.canada.ca/fra/droits
L’accès à ce site Web et l’utilisation de son contenu sont assujettis aux conditions présentées dans le site LISEZ CES CONDITIONS ATTENTIVEMENT AVANT D’UTILISER CE SITE WEB.
Report (National Research Council of Canada. Automotive and Surface
Transportation); no. ST-R-TR-0058, 2015-03-19
READ THESE TERMS AND CONDITIONS CAREFULLY BEFORE USING THIS WEBSITE. https://nrc-publications.canada.ca/eng/copyright
NRC Publications Archive Record / Notice des Archives des publications du CNRC :
https://nrc-publications.canada.ca/eng/view/object/?id=8cc206d0-5dbd-42ed-9b4e-35fd9f8b8efb https://publications-cnrc.canada.ca/fra/voir/objet/?id=8cc206d0-5dbd-42ed-9b4e-35fd9f8b8efb
For the publisher’s version, please access the DOI link below./ Pour consulter la version de l’éditeur, utilisez le lien DOI ci-dessous.
https://doi.org/10.4224/40001831
Access and use of this website and the material on it are subject to the Terms and Conditions set forth at
In-train force limit study
Council Canada de Recherches Canada
Automotive and Surface Transportation Automobile et Transports de surface
In-Train Force Limit Study
Prepared for:
Mr. Pierre Rasoldier Transport Canada TTIC 330 Sparks St.
Ottawa ON
Prepared by:
Wei Huang, Elton Toma and Yan Liu
Project A1-004451
ST-R-TR-0058 19 March 2015
distribution: UNLIMITED classification: UNCLASSIFIED
Copyright 2015. This document contains confidential information that is proprietary to NRC-Surface Transportation. No part of its contents may be used, copied, disclosed or conveyed to any party in any manner, in whole or in part, whatsoever without prior written permission from NRC-Surface Transportation.
March 2015 National Research Council of Canada Automotive and Surface Transportation
REVISION DATE DESCRIPTION
A B 2014-11-30 2015-03-31 Draft Final REPORT PREPARED BY: REVIEWED BY:
Eric Magel, M.A.Sc, P.Eng.
Principal Engineer
Date
APPROVED BY:
_______________________
Blaine Peterson, P.Eng., P.E.
Director, Rail
_______________________
Date
______ _________________
Wei Huang, Ph.D., P.Eng.
Senior Engineer
_______________________
Date
__________ _____________
Elton Toma, Ph.D., P.Eng.
Senior Engineer
_______________________
Date
_______________________
Yan Liu, Ph.D.
Manager Vehicle Simulation
_______________________
March 2015 National Research Council of Canada Automotive and Surface Transportation
This report reflects the views of the authors and not necessarily the official views or policies of the Transportation Development Centre of Transport Canada or the co-sponsoring organizations.
The Transportation Development Centre and the co-sponsoring agencies do not endorse products or manufacturers. Trade or manufacturers’ names appear in this report only because they are essential to its objectives.
Since some of the accepted measures in the industry are imperial, metric measures are not always used in this report. Prices are given in Canadian dollars unless otherwise noted, and may have been converted from foreign currencies at the time of writing.
March 2015 National Research Council of Canada Automotive and Surface Transportation
4. Title and Subtitle 5. Publication Date
In-Train Force Limit Study
6. Performing Organization Document No.7. Author(s) 8. Transport Canada File No.
Wei Huang, Elton Toma and Yan Liu
9. Performing Organization Name and Address 10. PWGSC File No.
Automotive and Surface Transportation National Research Council
2320 Lester Road, Ottawa ON K1A 0R6
11. PWGSC or Transport Canada Contract No.
12. Sponsoring Agency Name and Address 13. Type of Publication and Period Covered
Transport Canada TTIC 330 Sparks St.
Ottawa ON
14. Project Officer
15. Supplementary Notes (Funding programs, titles of related publications, etc.)
16. Abstract
The push for increased efficiency is driving railways towards the use of longer and longer trains. While the advantages of long trains are considerable, in-train forces may be of higher concern for longer trains. In severe cases, large in-train forces can be a primary or secondary contributor to derailments.
Steady-state in-train force limit based on wheel/rail derailments was studied in this report. The coupler lateral force limit based on static-state analysis was first studied and its limitations were discussed. To take into consideration of the effects of wheel/rail profiles, vehicle types, track geometry and speed, dynamics simulations were conducted to study coupler lateral limit based on four safety-related criteria: wheel L/V, truck side L/V, wheel unloading and gauge widening. Based on dynamics simulation results, ratios of coupler lateral force over car weight for buff and draft conditions were recommended. Approaches for determining trailing tonnage based on recommended coupler lateral force limits were discussed and applied to some mixed trains marshalled by railroads for revenue operations. The suggested in-train force limits were applied in three cases of TEDS simulations which were built based actual field train operation data. The main safety concerns in each case were identified by comparing the in-train force results with the suggested force.
17. Key Words 18. Distribution Statement
Limited number of print copies available from the Transportation Development Centre. 19. Security Classification
(of this publication)
20. Security Classification (of this page)
21. Declassification (date) 22. No. of Pages 23. Price
March 2015 National Research Council of Canada Automotive and Surface Transportation
FORMULE DE DONNÉES POUR PUBLICATION
1. No de la publication de Transports Canada 2. No de l'étude 3. No de catalogue du destinataire
4. Titre et sous-titre 5. Date de la publication
6. No
de document de l'organisme exécutant
7. Auteur(s) 8. No
de dossier - Transports Canada
9. Nom et adresses de l'organisme parrain 10. No de dossier – TPSGC
Automobile et Transports de surface
Conseil national de recherches Canada (CNRC) 2320 chemin Lester, Ottawa (Ontario) K1A 0R6
11. No de contrat - TPSGC ou Transports Canada
12. Nom et adresse de l'organisme parrain 13. Genre de publication et période visée
14. Agent de projet
15. Remarque additionnelles (programmes de financement, titres de publications connexes, etc.)
16. Résumé
17. Mots clés 18. Diffusion
Le Centre de développement des transports dispose d’un nombre limité d’exemplaires. 19. Classification de
sécurité (de cette publication)
20. Classification de sécurité (de cette page)
21. Déclassification (date)
22. Nombre de pages 23. Prix
March 2015 National Research Council of Canada Automotive and Surface Transportation
The authors are grateful to the following individuals for their contributions to the project: Abe Aronian, CP Stan Bell, CP Robert Leblanc, CN Sean Robitaille, CN Daoxing Chen, TSB Deborah deGrasse, TC-TDC Pierre Rasoldier, TC-TDC Bryan Dreika, TC-Rail Safety Nicholas Hoffmann, TC-Rail Safety Kerry Campbell, TC
Eric Magel, NRC Luke Steiginga, NRC
March 2015 National Research Council of Canada Automotive and Surface Transportation
E
XECUTIVE
S
UMMARY
The push for increased efficiency is driving railways towards the use of longer trains. The benefits of long trains include reduced fuel consumption, capital maintenance and labour savings. While these advantages of long trains are considerable, they are not without added cost and risk. When long trains include distributed power, the improved air pressure in the braking lines reduces drag braking, while better distribution of in-train forces reduces curving resistance, both further improving fuel economy. With high trailing tonnage, the modern long trains generate much higher in-train draft and buff force. The risk to “jackknife” or “stringline” an empty car off the track is much higher for trains nowadays than 30 years ago. Since the
publication of the Train Makeup Manual by the Association of America Railroads (AAR) in 1990s, the industry has developed many new rules to guide safe operation of longer trains. A successful example is the TrAM (Train Area Marshaling) system developed by Canadian Pacific Railway. However, the in-train force limit behind these rules has remained to be static or quasi-static similar to what is used in the AAR’s Train Makeup Manual, without including effects of curvature, speed, track perturbation and car types etc.
Given the industry trend to operate longer trains, Transport Canada has been committed to developing a new guideline for safe operation of long trains along the Canadian rail networks. National Research Council (NRC) has been contracted by Transport Canada to conduct a study aiming to develop a guideline for safe operation of long train in Canada. As part of the study, this report summarizes the NRC’s work and findings on the in-train force limits. In order to avoid the development of fully prescriptive guidelines that might constrain flexibility and productivity, the objective of this study is to establish safer and robust in-train force limits. From these force limits, the best and most suitable practices for the marshalling and operation of long trains over a specific section of track can be developed.
By dynamic simulations using validated vehicle models for 9 typical freight cars with measured wheel profiles running on measured shallow and sharp curves under both Stringlining and Jackknifing conditions, the ratios of lateral in-train force limit over car weight (RLWs) have been developed (as shown in Table E1). Compared with the static values used in the Train-Makeup manual, it was found that
(1) The limits under dynamic conditions are considerably lower than the static limits; (2) Due to different derailment mechanisms, draft and buff limits are different. Buff (or
Jackknifing) cases have lower limits than draft (or Stringlining) cases. Table E1 Ratio of lateral in-train force limit over car weight
Method
In-train force
direction
Minimum
Maximum
Fitted Value
Static
Draft
0.389
0.389
0.389
Buff
0.389
0.389
0.389
Dynamic
Draft
0.24
0.33
0.29
Buff
0.17
0.25
0.22
The study also found that the differences between static and dynamic limits are due to effects of creepage, curve, conicity, wheel unloading ratio, track geometry, car configurations and the share of wheel load changes which are not taken into account in the static analysis.
March 2015 National Research Council of Canada Automotive and Surface Transportation
car is a constant determined by car weight and the RLW ratio, the longitudinal in-train force limit will change based on factors that impact the coupler angle, such as car geometries and track curvature. This means we can increase the longitudinal in-train force limit by properly
marshalling the train to reduce the coupler angles of each car when it steers curves.
The dynamic results shown in Table E1 are based on the assumption that lateral forces of the same value are placed on both ends of a long car. In reality, the likelihood of one long car being placed between two identical short cars is relatively low. Therefore, the lateral forces on two ends of a long car are usually different. Considering the safety margin introduced by assuming the same in-train forces are applied to both ends of car, we recommend that the fitted values for RLWs, instead of the lower bound or minimum values, be used in generating rules for the safe operation of long trains (calculation of trailing tonnage limit as an example. The recommended RLWs for Stringlining and Jackknifing are 0.29 and 0.22, respectively.
Two approaches for checking trailing tonnage were discussed. The first approach involved the use of trailing tonnage and coupler angle formulas. The procedure for applying these was presented. The second approach considered the use of trailing tonnage tables. Tables of trailing tonnage over car weight were created for coupler angles from 2 deg to 15 deg, grades from 0.5% to 2.5% and curvature from 5 deg to 12 deg. Both draft and buff versions were given, resulting in a total of 18 tables.
It is recommended that the formula-based approach be used in determining trailing tonnage. It is more concise, fast, accurate and flexible than the table-based approach.
Based on the recommended RLWs, the trailing tonnage limits of five train consists provided by a railroad were evaluated for both ascending and descending cases in five operation areas
defined by TrAM. Two cars in two trains violated trailing tonnage requirements in two areas. If the static RLW value of 0.389, as used in AAR Train Make-Up Manual, is applied for both ascending and descending cases, there will be no car violating the trailing tonnage requirement..
The suggested in-train force limits have been applied in three cases of TEDS simulations which were built based on actual field train operation data. The main safety concerns in each case can be identified by comparing the in-train force results obtained from simulation with the suggested force limits. The three case studies show that train marshalling, train handling and vehicle and track conditions are important in determining in-train force safety margins. Case 1
demonstrated how train marshalling can be used to improve the in-train force safety margins on ascending grades with many curves. Case 2 demonstrated how handling practices can improve safety margins on undulating terrain. Case 3 demonstrated how vehicle and track wear
March 2015 National Research Council of Canada Automotive and Surface Transportation
G
LOSSARY
Wheel L/V: lateral-to-vertical force ratio on an individual wheel. Truck Side L/V: lateral-to-vertical force ratio on one side of a truck.
Draft Force: pulling coupler force (tension) that occurs under a stretched condition. Buff Force: compressive coupler force that occurs under a bunched condition.
Stringlining: stringlining occurs when a train is under high draft force condition on a curve and the train straighten out like a string due to high in-train force.
Jackknifing: jackknifing occurs when a train is under excessive buff force condition and cars pushing against each other folding like a folding pocket knife.
Lateral Center Plate/ Track Play: lateral displacement of truck center plate with respect to track. RLW: ratio of coupler lateral force over car weight.
IWS: Instrumented wheelset.
TEDS: Train Energy and Dynamics Simulator computer program for performing longitudinal train dynamics simulations.
March 2015 National Research Council of Canada Automotive and Surface Transportation
1 Introduction ... 1
2 In-Train Force and Its Components ... 3
2.1 Coupler Lateral and Longitudinal Force ... 3
2.2 Stringlining ... 5
2.3 Jackknifing ... 6
3 Coupler lateral Force Limit ... 7
3.1 Static Analysis of Coupler Lateral Force Limit ... 7
3.2 Safety-Related Criteria under Dynamic Condition ... 9
3.3 Dynamic Simulation Model ... 11
3.4 Curvature Impact on Lateral Force Limit ... 13
3.5 RLW for Stringlining ... 23
3.5.1 Simulation Conditions ...23
3.5.2 RLW for Stringlining under Ideal and Measured Conditions ...29
3.5.3 Effects of Various Conditions on RLW ...31
3.5.4 RLW for Stringlining under Measured Conditions ...34
3.6 RLW for Jackknifing ... 36
3.6.1 RLW for Jackknifing under Ideal and Measured Conditions ...36
3.6.2 RLW for Jackknifing under Measured Conditions ...37
3.7 AAR Test of Wheel Unloading Due to Coupler Lateral Force ... 38
3.8 Recommended RLWs for Stringlining and Jackknifing ... 39
4 Trailing Tonnage ... 40
4.1 Calculation of Trailing Tonnage Limit ... 40
4.2 Estimation of Coupler Angle ... 42
4.3 Methods of Applying Trailing Tonnage Limits for Revenue Train ... 45
4.3.1 Route-Based and Area-Based Approaches ...45
4.3.2 Lateral Bolster/Track Play ...45
4.3.3 Option 1 for Determining Trailing Tonnage: Formulas ...46
4.3.4 Option 2 for Determining Trailing Tonnage: Tables ...46
4.4 Checking Trailing Tonnage of Five Revenue Trains in Five Areas ... 49
4.5 Comparing TEDS Simulated In-Train Forces with In-Train Force Limits ... 56
4.5.1 Case 1 – Ascending a Steep Grade ...56
4.5.2 Case 2 – Undulating Track...65
4.5.3 Case 3 – Descending a Steep Grade ...69
5 Conclusions ... 74
March 2015 National Research Council of Canada Automotive and Surface Transportation
L
IST OF
F
IGURES
Figure 2-1: Stringlining ... 5
Figure 2-2: Jackknifing ... 6
Figure 3-1: Static roll-over ... 7
Figure 3-2: Measured and simulated wheel/rail forces, case 2 ...12
Figure 3-3: Measured and simulated wheel/rail forces, case 10 ...12
Figure 3-4: Curvature histogram (positive indicates right-hand curve) ...13
Figure 3-5: Superelevation histogram ...14
Figure 3-6: Train speed histogram ...14
Figure 3-7: Maximum wheel L/V on low rail for empty lumber car without in-train force. ...15
Figure 3-8: Maximum truck side L/V on low rail for empty lumber car without in-train force ...16
Figure 3-9: Maximum wheel L/V on low rail for empty lumber car with 10000 lb coupler lateral force ...17
Figure 3-10: Maximum wheel L/V on low rail for empty lumber car with 10000 lb coupler lateral force ...17
Figure 3-11: Maximum wheel L/V below its safety limit on low rail for empty lumber car with 20000lb coupler lateral force ...18
Figure 3-12: Maximum truck side L/V below safety limit on low rail for empty lumber car with 20000lb coupler lateral force ...18
Figure 3-13: Ratio of runs exceeding wheel L/V safety limit over total runs ...19
Figure 3-14: Ratio of runs exceeding truck side L/V safety limit over total runs ...20
Figure 3-15: Maximum wheel unloading on high rail for empty lumber car without in-train force21 Figure 3-16: Maximum wheel unloading on high rail for empty lumber car with 10000 lb coupler lateral force ...21
Figure 3-17: Maximum wheel unloading below safety limit on high rail for empty lumber car with 20000 lb coupler lateral force ...22
Figure 3-18: Ratio of runs exceeding wheel unloading safety limit over total runs ...22
Figure 3-19: Track geometry for the measured sharp curve ...24
Figure 3-20: Track geometry for the measured shallow curve ...24
Figure 3-21: Speed history on the measured sharp curve ...25
Figure 3-22: Speed history on the measured shallow curve ...26
Figure 3-23 High rail profile for sharp curve ...27
Figure 3-24 High rail profile for mild curve ...27
Figure 3-25 Low rail profile ...28
Figure 3-26 Tangent rail profile ...28
Figure 3-27: Maximum wheel unloading vs. coupler lateral force on high rail for empty lumber car with measured speeds on measured tracks under Stringlining condition ...30
Figure 3-28: Lateral force limit vs car weight for Stringlining under various conditions ...31
Figure 3-29: Ratio of lateral force limit over weight from static condition to dynamic condition ..32
Figure 3-30: Ratio of lateral force limit over weight from static condition to dynamic condition ..33
Figure 3-31: Lateral force limit vs car weight for Stringlining cars with measured wheels on measured tracks ...35
March 2015 National Research Council of Canada Automotive and Surface Transportation
Figure 4-2: Weight distribution for train #2 ...50
Figure 4-3: Weight distribution for train #3 ...51
Figure 4-4: Weight distribution for train #4 ...51
Figure 4-5: Weight distribution for train #5 ...52
Figure 4-6: Weight distribution for train #3 (two platforms violating trailing tonnage requirement) ...54
Figure 4-7: Weight distribution for train #5 (two platforms violating trailing tonnage requirement) ...54
Figure 4-8: Trailing tonnage vs. lateral center plate/track play, leading platform of the 5-pack car ...55
Figure 4-9: Coupler angle vs. lateral center plate / track play, leading platform of the 5-pack car ...55
Figure 4-10: Elevation and curvature vs position for Case 1 track ...56
Figure 4-11: Weight distribution for original train make-up, Case 1 ...57
Figure 4-12: Car length distribution for original train make-up, Case 1 ...57
Figure 4-13: Weight distribution for new train make-up, Case 1 ...58
Figure 4-14: Car Length distribution for new train make-up, Case 1 ...58
Figure 4-15: Maximum draft force vs. vehicle position for Case 1 original make-up train ...59
Figure 4-16: Draft force vs. vehicle position for Case 1 original make-up train ...59
Figure 4-17: Minimum safety margin vs. vehicle position for Case 1 original make-up train ...61
Figure 4-18: Draft force vs. position for vehicle #10 in Case 1 original make-up train ...62
Figure 4-19: Draft force vs. position for Case 1 new make-up train ...62
Figure 4-20: Safety margin vs. position for vehicle #10, Case 1 ...63
Figure 4-21: Draft force vs. curvature for vehicle #10 in Case 1 original make-up train ...63
Figure 4-22: Draft force vs. curvature for Case 1 new make-up train ...64
Figure 4-23: Safety margin vs. curvature for vehicle #10, Case 1 ...64
Figure 4-24: Elevation and curvature vs. position for Case 2 track ...65
Figure 4-25: Weight distribution for Case 2 train ...66
Figure 4-26: Car length distribution for Case 2 train ...66
Figure 4-27: Maximum draft force for Case 2 train ...67
Figure 4-28: Minimum safety margin for Case 2 train ...67
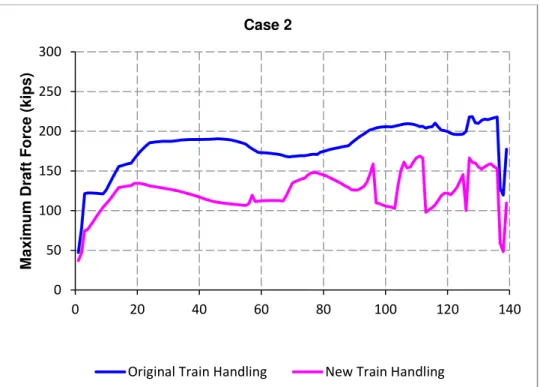
Figure 4-29: Original and new locomotive notch settings and elevation for Case 2 ...68
Figure 4-30: Maximum draft forces for original and new locomotive notch settings for Case 2 ..69
Figure 4-31: Minimum safety margins for original and new locomotive notch settings for Case 2 ...69
Figure 4-32: Elevation and curvature vs. position for Case 3 track ...70
Figure 4-33: Weight distribution for Case 3 train ...71
Figure 4-34: Car length distribution for Case 3 train ...71
Figure 4-35: Maximum buff force vs. vehicle position in Case 3 ...72
March 2015 National Research Council of Canada Automotive and Surface Transportation
L
IST OF
T
ABLES
Table 3-1 Safety-related criteria ...10
Table 3-2 List of nine cars ...23
Table 3-3 Simulation conditions for Stringlining ...29
Table 3-4 Simulation conditions for cars with measured wheels on measured tracks ...34
Table 3-5 Simulation conditions for Jackknifing ...36
Table 3-6 Ratio of lateral force over weight ...39
Table 4-1 Swing angles for standard coupler types ...44
Table 4-2 Trailing tonnage over ton of long car weight on 1.0% grade under draft condition ...47
Table 4-3 Trailing tonnage over ton of long car weight on 1.0% grade under buff condition ...48
Table 4-4 Maximum grades and curvatures ...53
Table 4-5 List of cars violating trailing tonnage requirement ...53
March 2015 National Research Council of Canada Automotive and Surface Transportation
1
I
NTRODUCTION
The push for increased efficiency is driving railways towards the use of longer trains. The benefits of long trains include reduced fuel consumption, capital maintenance and labour savings. While these advantages are considerable, they are not without added risk. Experience in Canada suggests that failure to manage in-train forces in long trains has contributed to derailments. With high trailing tonnage, the modern long trains generate much higher in-train draft and buff force. Therefore the risk to “Jackknife” or “Stringline” an empty car off the track is much higher for trains nowadays than 30 years ago. On the other hand, when long trains include distributed power, the better distribution of in-train forces will result in a safer operation. Given the industry’s trend towards operating longer trains, Transport Canada has committed to developing new guidelines for safe operation of long trains on the Canadian rail network. In 2011, Transport Canada (TC) engaged in a project to increase the level of safety on rail
networks via improvements in train marshalling practices, based on modeling of in-train forces. Several reports summarize the modeling results [1] [2], however the project was terminated before the contractor was able to generate guidelines for managing forces associated with long trains in curved territories. At Transport Canada’s request, National Research Council Canada has worked on the development of the guideline. The approach is to build the guidelines based on the review of the previous work, the industry best practices and in-train force limits that govern the risk level.
Factors that contribute to large in-train forces include the number, weights, dimensions, positions and types of locomotives and cars, type of coupler, grade, curvature, and train handling. In-train forces are of greatest concern in tracks with numerous curves and where there are rapid changes of grade. These characteristics apply to much of the mountain territories in Canada’s western provinces and several other areas within Canada.
Industry-generated best practices are based on train length and tonnage. Operating practices for distributed power, train make-up rules and optimized train handling procedures all have a central role to reduce the in-train forces. However, there exist no industry-wide practices and no science-based limit(s) to guide the development of safe operating practices for long trains. Given the vast number of permutations of car types, train lengths, types of locomotives and track profiles, it is simply not practical to devise best practices to adequately address all the possibilities.
In order to avoid the development of prescriptive guidelines that might constrain flexibility and productivity, the objective of this study is to develop performance based limits for in-train forces. Limits for the allowable in-train buff (compression) and draft (tension) forces can be determined based on two primary failure mechanisms, wheel/rail derailments and knuckle failures. From these force limits, it would then be possible to generate the best and most suitable practices for the marshalling and operation of long trains over a specific section of track.
Since the publication of the Train Makeup Manual [3] by the Association of America Railroads (AAR) in 1990s, the operational environment including typical train length and tonnage have changed considerably. Accordingly, the industry has developed various rules to guide safe operation of longer trains. A successful example of their implementation is the Train Area Marshalling (TrAM) system developed by Canadian Pacific Railway [4]. However, the static or quasi-static in-train force limit, similar to what used in the AAR’s Train Makeup Manual, is still
March 2015 National Research Council of Canada Automotive and Surface Transportation
The in-train force limit based on knuckle failures is discussed in a separate engineering report [5]. Review of industry best practice and the in-train force limits from some derailment
investigations are also covered in the same report.
In-train force limits leading to derailments are studied in this report. The study focuses on the effect of the lateral component of in-train force (or coupler lateral force) on the wheel/rail derailment. The coupler lateral force limit based on static-state analysis is first studied and its limitations are discussed. To take into consideration the effects of wheel and rail profiles, vehicle types, track geometry and speed, dynamics simulations are conducted to study coupler lateral limit based on four safety-related criteria; wheel L/V, truck side L/V, wheel unloading and gauge widening. Based on dynamics simulation results, ratios of coupler lateral force over car weight for buff and draft conditions are recommended. Approaches for determining trailing tonnage based on recommended coupler lateral force limits are discussed and applied to some mixed trains marshalled by railroads for revenue operations. The suggested in-train force limits are applied in three cases of TEDS simulations which are built based on actual field train operation data. The main safety concerns in each case can be identified by comparing the in-train force results with recommended force limits.
March 2015 National Research Council of Canada Automotive and Surface Transportation
2
I
N
-
T
RAIN
F
ORCE AND
I
TS
C
OMPONENTS
2.1 Coupler Lateral and Longitudinal Force
The in-train force is normally considered to be in the “longitudinal” direction of a train. For a single car in a train, the longitudinal direction is in line with the car center line. When a train negotiates a curve, the in-train force is roughly in the tangential direction of the curve and not in line with the longitudinal direction of the car. Therefore there are two components of the in-train force for a single car, the lateral and the longitudinal ones. In this report, we define the lateral component of the in-train force on a car as “coupler lateral force”, and the longitudinal
component as “coupler longitudinal force”.
A train can be in draft mode, where cars are subjected to tensile forces, or in buff mode, where cars are subjected to compressive forces. Under certain circumstances, one part of a train may be in draft mode while another part is in buff mode.
Excessive in-train forces may have both steady-state and transient components. Steady-state in-train forces last for many seconds and sometimes many minutes while transient forces are a fraction of a second in duration. High in-train forces can result in train separation or wheel/rail derailment.
Train separation usually occurs when the coupler longitudinal force exceeds the physical strength of the knuckle, which is designed as the weak link in the coupler system. In-train force limit based on knuckle failures is discussed in a separate engineering report [5].
Limits for the steady-state in-train force are studied in this report, using derailment risk as the limiting criteria. The lateral component of the steady-state in-train force is considered to be solely responsible for the derailing forces – the wheel lift effect of the longitudinal component is considered by decreasing the threshold value of wheel limit in the following analysis.
Rail vehicles are connected through couplers and draft gears and/or cushioning devices. When a train is running on curved track, each coupler takes an angle, resulting in a fraction of the coupler force being applied laterally – i.e. perpendicular to carbody centreline. The combination of high in-train forces and large coupler angle may produce a high coupler lateral force causing wheel/rail derailment.
Coupler lateral force can be expressed as
𝐹𝑦= 𝐹 × sin ∅ (2-1)
where:
𝐹 = In-train force or coupler force 𝐹𝑦= Coupler lateral force
March 2015 National Research Council of Canada Automotive and Surface Transportation
March 2015 National Research Council of Canada Automotive and Surface Transportation
2.2 Stringlining
Stringlining occurs when a train is under high draft condition on a curve and the train straightens out like a string due to high in-train forces (Figure 2-1).
(a)
(b)
Figure 2-1: Stringlining
As shown in Figure 2-1(b), under Stringlining condition, coupler lateral forces on two ends of a car pull the car towards the low rail, increasing wheel L/V and truck side L/V on the low rail and the unloading of the high rail wheel.
March 2015 National Research Council of Canada Automotive and Surface Transportation
Jackknifing occurs when a train is under excessive buff condition and cars pushing against each other fold like a folding pocket knife (Figure 2-2). Under a Jackknifing condition, the vehicle usually does not roll over but instead a wheel is induced to climb the rail or one rail will rollover. Wheel L/V or truck side L/V is usually the safe-related criteria violated first under Jackknifing condition. (a) (b) Figure 2-2: Jackknifing
F
yF
ϕ
F
yF
ϕ
March 2015 National Research Council of Canada Automotive and Surface Transportation
3
C
OUPLER LATERAL
F
ORCE
L
IMIT
3.1 Static Analysis of Coupler Lateral Force Limit
In the case of Stringlining, it is very easy to anticipate that, when the rolling moment generated by the coupler lateral force is high enough the vehicle will be tipping to one side and eventually rollover. This can be and has been elucidated by a simple static force analysis. The coupler lateral force that causes a car roll over under static conditions can be derived from the analysis. Let’s assume that a car sits still on the track and coupler lateral forces are applied equally on two ends of the car. If the coupler lateral forces are large enough, wheels on one side will be fully unloaded and the car is at the edge of roll over, as shown in Figure 3-1.
Figure 3-1: Static roll-over Summing moments about point B yields
2L*H = D/2*W (3-2) where L is coupler lateral force limit that makes the car tipping, W is car weight, H is coupler height and D/2 is the distance between car center to the wheel flange contact point.
March 2015 National Research Council of Canada Automotive and Surface Transportation
weight when main dimensions of car are given. From Eq. (3-3) we can express the coupler lateral force limit in terms of the ratio of L over W. From Eq. (3-3) we have
L/W = 0.41 (3-4) where L/W is ratio of coupler lateral force limit over car weight (hereinafter referred to as
“RLW”).
In Section 10.0 of AAR’s Train Make-Up Manual [3], RLW used in the calculations of allowable drawbar force and trailing tonnage is 0.389 which is obtained based on track gauge of 59 inches, coupler height of 34 inches, L/V of 0.82 where L and V are lateral and vertical wheel loads, assuming vertical wheel loads are distributed equally among all wheels and coupler lateral force is equal to lateral wheel load on one side of truck. If track gauge of 56.5 inches and coupler height of 34.5 inches were used in [3], RLW would have been 0.41, i.e. identical to Equation (2-3).
Under dynamic conditions, forces are not distributed equally among wheelsets, so RLW will be lower than that under the static condition. Besides the car weight W, factors that can affect the coupler lateral force limit include
Draft and buff forces - which affect car yaw angle and wheel /rail forces. Rolling radius difference between outer wheel and inner wheel, resulting in
longitudinal creep forces and yaw moments and changes of force distribution on wheels.
Vehicle configurations. For example, a car with constant contact side bearing could have a higher coupler lateral force limit than a car with a roller type side bearing under dynamic conditions.
Track irregularities - which can produce dynamic forces and reduce the lateral force limit.
Cant deficiency - which is a function of curvature, speed and superelevation. Cant deficiency will affect unbalanced lateral force on the car and thus the coupler lateral force limit.
Car weight was already addressed in the above static analysis. It is expected that the car weight will remain the dominant factor for the coupler lateral force limit in the dynamic case. However, the remaining factors could have important impacts on the RLW ratio.
In the field test with a car running dynamically at revenue speed, it is very difficult to apply and keep the in-train force to a level close to derailment. One such test was performed by the American Association of Railroads (AAR) in 1993 [6]. This test will be discussed later in Section 3.7.
On the other hand, the dynamics simulation using a validated model provides a perfect way to examine the effects of the above factors while gradually increasing coupler lateral force to freight cars. In the following sections, RLW ratio will be studied by dynamic simulations.
March 2015 National Research Council of Canada Automotive and Surface Transportation
3.2 Safety-Related Criteria under Dynamic Condition
In addition to vehicle rollover as described in the static analysis, there are other important mechanisms that could contribute to the derailment a car subjected to in-train forces. In the dynamic simulations, the following safety-related performance criteria are used to identify coupler lateral force limits:
Wheel L/V: This is the wheel climbing criterion, defined as the lateral wheel/rail force divided by the vertical wheel/rail force on a single wheel. Based on AAR’s Field Manual [7], 1.05 was used as the limit for wheel L/V.
Truck side L/V: This is the rail rollover criterion, defined as ratio of the sum of the lateral forces on both wheels of one side of a bogie divided by the sum of the vertical forces on the same wheels. Based AAR’s Train Makeup Manual [8], 0.82 was used as the limit for truck side L/V. This can be considered as a less conservative rail rollover limit.
Wheel unloading ratio: This is the wheel lift criterion, defined as the maximum
percentage of wheel unloading divided by the static load of a single wheel. Based on AAR Chapter 11 [9] for a newly built freight car and consideration of potential wheel lift effect due to coupler longitudinal force, 90% was used for the limit for Wheel Unloading Ratio.
Dynamic gauge widening: This is the wheel drop criterion, defined as the maximum increase of track gauge due to wheel – rail force. This dynamic widening portion will be added to the existing static gauge widening to increase the risk of wheel drop. When the loaded gauge exceeds the critical gauge limit of 59 inches defined by the physical dimension of a standard worn freight car wheel set, wheel drop will occur [10]. It should be noted that, for a freight car wheel with a standard width of 5.7188 inches, the critical gauge limit could be a little bit higher than 59 inches. Based on Transport Canada’s Track Safety Rules [11], maximum track gauges for Class 1 to Class 5 tracks are
between 57.5 inches and 58 inches. Therefore, 1.0 inch, which is the difference between critical gauge of 59 inches and maximum static track of 58 inches, was used as the limit for dynamic gauge widening. Based on the study in this report, dynamic gauge widening was found not to be a controlling factor that determines coupler lateral force limit.
March 2015 National Research Council of Canada Automotive and Surface Transportation
Wheel Climbing Wheel L/V 1.05 AAR Field Manual Rail Rollover Truck Side L/V 0.82 AAR Chapter 2
Wheel Lift Wheel Unloading 90% AAP Chapter 11 Gauge Widening Deflection (in) 1.0 Track Safety Rules
March 2015 National Research Council of Canada Automotive and Surface Transportation
3.3 Dynamic Simulation Model
A dynamic simulation model developed and validated in a previous study [12] will be used to study coupler lateral force limits under dynamics condition.
The National Research Council Canada (NRC) worked with Transport Canada (TC), the Federal Railroad Administration (FRA), Canadian Pacific Railway (CP), and Canadian National Railway (CN)’s between 2009 and 2011 to study the impact of curvature on track geometry safety standards based on field tests and computer simulations. Testing was conducted on more than 523 miles of track with 1,340 curves on four subdivisions of CN and CP main track between Vancouver and Kamloops, British Columbia. A loaded lumber (centre beam) car (SOO601242) and an empty tank car (IC400031) with gross rail loads (GRL) of approximately 220,000 lb and 59,800 lb, respectively, were equipped with instrumentation to measure their performance during field testing. These two car types were chosen because of their known poor performance characteristics. Tank cars like the one tested are torsionally rigid and perform poorly on spirals, generally exhibiting high wheel climbing risk, with the empty car being more prone to climb than a loaded car. Loaded lumber cars like the one used in that test have a high centre of gravity, which can lead to a high lateral moment that promotes rail rollover. The cars were each equipped with two instrumented wheelsets (IWSs) to measure vertical, lateral and longitudinal wheel-rail interaction forces during testing, along with accelerometers, gyroscopic pitch and roll transducers, and displacement transducers.
Computer simulation models of the dynamic behaviour of the loaded lumber car and the empty tank car (i.e. the cars used in the field tests) were developed using VAMPIRE [13], a
commercial software package that is widely applied to rail vehicle dynamics simulation. Vehicle parameters for simulating the two car configurations tested in the field (the empty tank car with a GRL of 59,800 lb and the loaded lumber car with a GRL of 220,000 lb) were obtained through a combination of measurement, review of published specifications, and estimation. Each vehicle model in the simulation incorporates a rigid car body mass, bolster masses, and side frame and axle masses. These are accompanied by models for the centre plate, constant contact side bearings, secondary truck suspension with springs and friction wedges, bearing adapter pads, axles and wheels. Each vehicle model also includes eight separate wheel profiles that were measured on the car under test.
Representative track segments were selected to calibrate and validate the VAMPIRE models. The VAMPIRE models were used to generate time-history data (wheel forces and distance vs. time) as the rail cars travelled along simulated track with the same geometry as that track covered in the field tests.
The comparison of measured and simulated time histories of wheel forces showed that the vehicle and track models developed in this study can simulate car performance in curves with a high degree of fidelity. Good agreement between simulation and field test results was achieved for dynamic wheel-rail forces on different curves. It was shown that the computer models can accurately reproduce the responses of both cars to track geometry variations on curved track. The models can also accurately predict the car responses over a given track geometry when operational speed and wheel-rail surface conditions are changed.
The simulated lateral and vertical wheel forces on the left and right wheels of axle 1 are compared with field test results in Figure 3-2 and Figure 3-3. The computer models duplicate
March 2015 National Research Council of Canada Automotive and Surface Transportation
Figure 3-2: Measured and simulated wheel/rail forces, case 2
Figure 3-3: Measured and simulated wheel/rail forces, case 10 -20000 -10000 0 10000 20000 30000 40000 50000 600 700 800 900 1000 1100 F o rce Distance
simu lat force,lft whl,ax1 simu lat force,rgt whl,ax1 simu vert force,lft whl,ax1 simu vert force,rgt whl,ax1 test lat force,lft whl,ax1 test lat force,rgt whl,ax1 test vert force,lft whl,ax1 test vert force,rgt whl,ax1
-20000 -10000 0 10000 20000 30000 40000 50000 0 100 200 300 400 500 600 F o rce Distance
simu lat force,lft whl,ax1 simu lat force,rgt whl,ax1 simu vert force,lft whl,ax1 simu vert force,rgt whl,ax1 test lat force,lft whl,ax1 test lat force,rgt whl,ax1 test vert force,lft whl,ax1 test vert force,rgt whl,ax1
March 2015 National Research Council of Canada Automotive and Surface Transportation
3.4 Curvature Impact on Lateral Force Limit
The review conducted in a separate engineering report [5] showed that most derailments under Stringlining or Jackknifing conditions occurred on long empty cars. Therefore, an empty lumber car was used in the dynamic simulations to evaluate the impact of curvature on coupler lateral force. The Gross Rail Load (GRL) of the car is 61,070 lbs. The car length is 75 ft. 1 in. Eight measured wheel profiles from instrumented lumber car SOO601242 were used in the
simulations.
About 1,000 curves with measured track geometry data and train speed profiles were used in the simulations. Histograms of curvature, superelevation and vehicle speed used in this modelling are shown Figure 3-4 through Figure 3-6.
Figure 3-4: Curvature histogram (positive indicates right-hand curve)
0 2 4 6 8 10 -12 -10 -8 -6 -4 -2 0 2 4 6 8 10 12 % /d eg Curvature (deg)
March 2015 National Research Council of Canada Automotive and Surface Transportation
Figure 3-5: Superelevation histogram
Figure 3-6: Train speed histogram
0 2 4 6 8 10 12 14 16 -6 -4 -2 0 2 4 6 % /i n Super-elevation (in) 0 2 4 6 8 10 0 5 10 15 20 25 30 35 40 45 50 % /m p h Speed (mph)
March 2015 National Research Council of Canada Automotive and Surface Transportation
Simulation results for the Stringlining cases are reviewed below. Simulation results for the Jackknifing cases are included in Appendix A.
Under a Stringlining condition, coupler lateral forces on two ends of a car pull the car towards low rail, increasing wheel L/V and truck side L/V on the low rail and wheel unloading on the high rail. The impact of coupler lateral force on these safety-related ratios will be assessed.
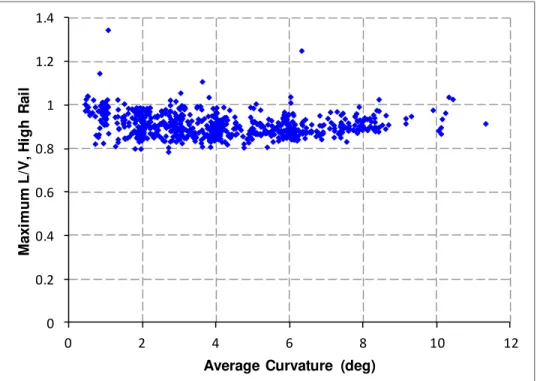
Maximum wheel L/V and truck side L/V on the low rail for an empty lumber car without coupler lateral force are shown in Figure 3-7 and Figure 3-8. When there is no coupler lateral force, curvature has strong effects on wheel L/V and truck side L/V, with both increasing with curvature.
March 2015 National Research Council of Canada Automotive and Surface Transportation
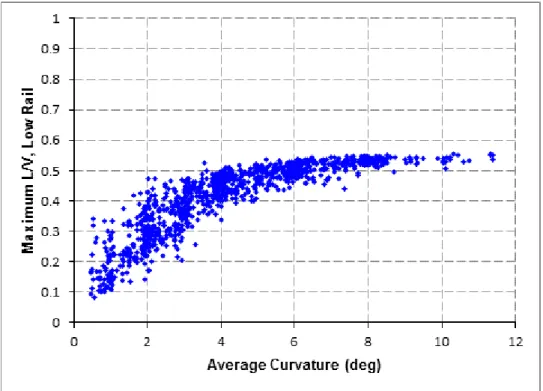
Figure 3-8: Maximum truck side L/V on low rail for empty lumber car without in-train force Figure 3-9 and Figure 3-10 show maximum wheel and truck side L/V on the low rail for an empty lumber car with 10000 lb coupler lateral force on each end of the car. The addition of coupler lateral forces increases the L/V levels more on shallow curves than on sharp curves. Wheel L/V and track side L/V are spread more evenly across the length of sharper curves. Thus the influence of curvature on L/V decreases as coupler lateral force increases.
0 0.1 0.2 0.3 0.4 0.5 0.6 0.7 0.8 0 2 4 6 8 10 12 M ax imu m T ru ck S ide L /V , L o w Rail
March 2015 National Research Council of Canada Automotive and Surface Transportation
Figure 3-9: Maximum wheel L/V on low rail for empty lumber car with 10000 lb coupler lateral force
Figure 3-10: Maximum wheel L/V on low rail for empty lumber car with 10000 lb coupler lateral force
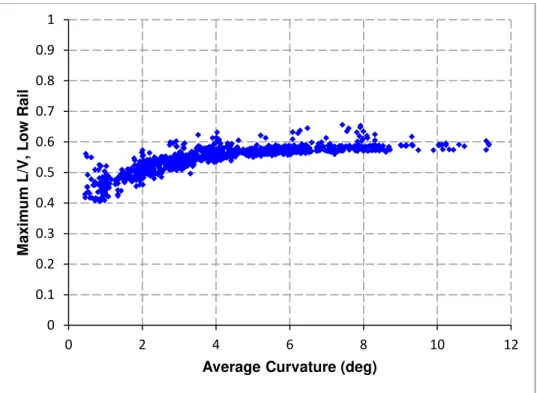
Figure 3-11 and Figure 3-12 show maximum wheel L/V below its safety limit of 1.05 and truck side L/V below its safety limit of 0.82 on low rail for empty lumber car with 20000 lb lateral couple force on both ends of the car.
0 0.1 0.2 0.3 0.4 0.5 0.6 0.7 0.8 0.9 1 0 2 4 6 8 10 12 M ax imu m L /V , L o w Rail
Average Curvature (deg)
0 0.1 0.2 0.3 0.4 0.5 0.6 0.7 0.8 0.9 1 0 2 4 6 8 10 12 M ax imu m T ru ck S ide L /V , L o w Rail
March 2015 National Research Council of Canada Automotive and Surface Transportation
Figure 3-11: Maximum wheel L/V below its safety limit on low rail for empty lumber car with 20000lb coupler lateral force
Figure 3-12: Maximum truck side L/V below safety limit on low rail for empty lumber car with 20000lb coupler lateral force
0 0.2 0.4 0.6 0.8 1 0 2 4 6 8 10 12 M ax imu m L /V , L o w Rail
Average Curvature (deg)
0 0.1 0.2 0.3 0.4 0.5 0.6 0.7 0.8 0.9 1 0 2 4 6 8 10 12 M ax imu m T ru ck S ide L /V , L o w Rail
March 2015 National Research Council of Canada Automotive and Surface Transportation
The percentages of runs exceeding the wheel L/V safety limit over total runs are shown in Figure 3-15. For example, for runs where curvatures are between 4 and 8 deg, 60% of the runs exceeding wheel L/V safety limit.
The percentages of runs exceeding truck side L/V safety limit over total runs are shown in Figure 3-14.
It can be seen from Figure 3-11 to Figure 3-14 that exceedances of safety limits occur on both shallow and sharp curves, with the influence of curvature essentially vanishing when high coupler loads are present.
Figure 3-13: Ratio of runs exceeding wheel L/V safety limit over total runs
0% 10% 20% 30% 40% 50% 60% 70% 80% 90% 100% 0-2 2-4 4-6 6-8 8-10 10-12
P
er
cen
tag
e
Curvature (deg)
March 2015 National Research Council of Canada Automotive and Surface Transportation
Figure 3-14: Ratio of runs exceeding truck side L/V safety limit over total runs Next we consider the effect of coupler lateral force on the wheel unloading ratio. Under a Stringlining condition, the car is pulled towards the low rail decreasing wheel load on the high rail (see Figure 3-1, where the low rail would be on the right side).
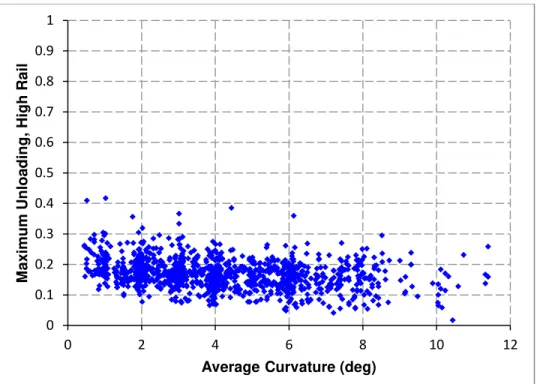
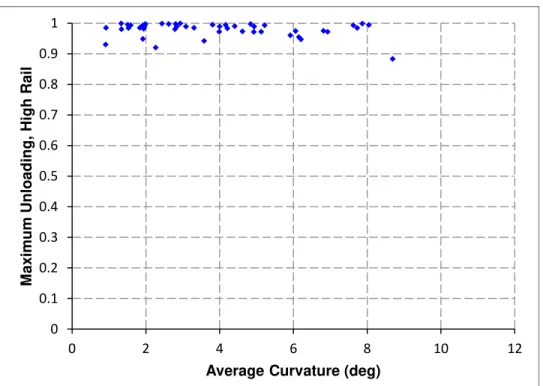
Wheel unloading ratios on the high rail for an empty lumber car with 0, 10000 and 20000 lb coupler lateral forces on both ends of the car are shown in Figure 3-15, Figure 3-16 and Figure 3-17, respectively. The percentages of runs exceeding the wheel unloading safety limit over total runs are shown in Figure 3-18. Curvature is not found to have a strong impact on wheel unloading. 0% 10% 20% 30% 40% 50% 60% 70% 80% 90% 0-2 2-4 4-6 6-8 8-10 10-12
P
er
cen
tag
e
Curvature (deg)
March 2015 National Research Council of Canada Automotive and Surface Transportation
Figure 3-15: Maximum wheel unloading on high rail for empty lumber car without in-train force
Figure 3-16: Maximum wheel unloading on high rail for empty lumber car with 10000 lb coupler lateral force 0 0.1 0.2 0.3 0.4 0.5 0.6 0.7 0.8 0.9 1 0 2 4 6 8 10 12 M ax imu m Un load ing , Hig h Rail
Average Curvature (deg)
0 0.1 0.2 0.3 0.4 0.5 0.6 0.7 0.8 0.9 1 0 2 4 6 8 10 12 M ax imu m Un load ing , Hig h Rail
March 2015 National Research Council of Canada Automotive and Surface Transportation
Figure 3-17: Maximum wheel unloading below safety limit on high rail for empty lumber car with 20000 lb coupler lateral force
Figure 3-18: Ratio of runs exceeding wheel unloading safety limit over total runs
As curvature does not have a strong impact on the coupler lateral force limit, in the remainder of this study we will consider only one shallow and one sharp curve to study RLW for various types of cars under Stringlining and Jackknifing conditions.
0 0.1 0.2 0.3 0.4 0.5 0.6 0.7 0.8 0 2 4 6 8 10 12 M ax imu m Un load ing , Hig h Rail
Average Curvature (deg)
0% 10% 20% 30% 40% 50% 60% 70% 80% 90% 100% 0-2 2-4 4-6 6-8 8-10 10-12
P
er
cen
tag
e
Curvature (deg)
March 2015 National Research Council of Canada Automotive and Surface Transportation
3.5 RLW for Stringlining
3.5.1 Simulation Conditions
3.5.1.1 Car Types/Loading Conditions
Nine different car types/loading conditions (referred to as “nine cars” hereafter) listed in Table 3-2 were used in the dynamic simulations to cover a wide range of weight, dimension and truck components (center plate, side bearing, wedge, adapter, spring, etc.).
Table 3-2 List of nine cars Car GRL (lb) Car Length
(in)
Truck Base (in)
Coupler Height (in)
Empty coal car 50,000 637 486 34.5
Empty lumber car 61,000 901 720 34.5
Empty tank car 63,000 713 455 34.5
Empty standard hopper car 70,000 637 486 34.5 Empty long hopper car 85,000 839.5 668 34.5
Empty auto rack 104,000 1126 792 34.5
Loaded well car 141,000 879 695 33.5
Loaded lumber car 217,000 901 720 33.5
Loaded tank car 263,000 713 455 33.5
3.5.1.2 Track Geometry
The following five track segments were used in the simulations:
Measured sharp curve Seg057468 (hereinafter referred to as “the measured sharp curve”). The super-elevation, curvature, alignment, profile and gauge on the measured sharp curve are shown in Figure 3-19. The curvature at the curve body is about 11.4 deg and the superelevation is about 3 in.
Measured shallow curve Seg239648 (hereinafter referred to as “the measured shallow curve”). The super-elevation, curvature, alignment, profile and gauge on the measured shallow curve are shown in Figure 3-20. The curvature at the curve body is about 0.75 deg and the superelevation is about 1.2 in.
Smooth sharp curve with 11.4 deg curvature and 3 in superelevation (hereinafter referred to as “the smooth sharp curve”).
Smooth shallow curve with 0.75 deg curvature and 1.2 in superelevation (hereinafter referred to as “the smooth shallow curve”)
Smooth tangent track
The two smooth curves have the same curvatures and superelevations as the corresponding measured curves. The effect of track irregularities can be evaluated by comparing the results on measured curves with these on smooth curves. The tangent smooth track was used to
March 2015 National Research Council of Canada Automotive and Surface Transportation
Figure 3-19: Track geometry for the measured sharp curve
Figure 3-20: Track geometry for the measured shallow curve
-2 0 2 4 6 8 100 200 300 400 500 600 700
Tr
a
ck
G
e
o
m
e
tr
y
Distance (feet)
Superelevation Curvature Aligment Profile Gauge
-0.2 0 0.2 0.4 0.6 0.8 1 1.2 1.4 100 300 500 700 900 1100
Tr
a
ck
G
e
o
m
e
tr
y
Distance (feet)
March 2015 National Research Council of Canada Automotive and Surface Transportation
3.5.1.3 Speed
The following speeds were used in the simulations:
Measured speed on the measured sharp curve as shown in Figure 3-21. The average speed is about 24.65 mph. The cant deficiency on the curve body is about 1.85 in. Measured speed on the measured shallow curve as shown in Figure 3-22. The average
speed is about 45.41 mph. The cant deficiency on the curve body is about -0.3 in. Speed of 19.4 mph to evaluate coupler lateral force limit on the measured and smooth
sharp curves under a balanced speed condition.
Speed of 47.8 mph to evaluate coupler lateral force limit on the measured and smooth sharp curves under a balanced speed condition.
10, 15, 20 and 25 mph on the measured sharp curve to evaluate the effect of speed/cant deficiency.
2 and 5 mph to assess the maximum coupler lateral force limit on tangent smooth track.
Figure 3-21: Speed history on the measured sharp curve
24 24.2 24.4 24.6 24.8 25 25.2 25.4 25.6 25.8 26 100 200 300 400 500 600 700
S
p
e
e
d
(
m
p
h
)
Distance (feet)
March 2015 National Research Council of Canada Automotive and Surface Transportation
Figure 3-22: Speed history on the measured shallow curve
3.5.1.4 Wheel Profiles
6 pairs of measured wheels and one pair of wheels with cylindrical tread and AAR narrow flange (hereinafter referred to as “cylindrical wheel”) were used in the simulations. The cylindrical wheel was used only to understand the effect of wheel tread conicity on the maximum lateral force limit.
3.5.1.5 Rail Profiles
The rail grinding templates for tangent, mild and sharp curves were used to create the rail profiles used in the simulations. The high rail profile for sharp curve, high rail profile for mild curve, low rail profile and tangent rail profile are shown in Figure 3-23– Figure 3-26.
45 45.1 45.2 45.3 45.4 45.5 45.6 45.7 45.8 100 200 300 400 500 600 700
S
p
e
e
d
(
m
p
h
)
Distance (feet)
March 2015 National Research Council of Canada Automotive and Surface Transportation
Figure 3-23 High rail profile for sharp curve
March 2015 National Research Council of Canada Automotive and Surface Transportation
Figure 3-25 Low rail profile
March 2015 National Research Council of Canada Automotive and Surface Transportation
3.5.2 RLW for Stringlining under Ideal and Measured Conditions
The various simulation conditions described in Section 3.5.1 are summarized in Table 3-3, including both ideal and measured conditions. Smooth track, cylindrical wheel and wheel unloading ratios of 100% were used to compare RLW under the dynamic condition with that under the static condition of Section 3.1. The recommended RLW will be based on measured track, measured wheel profiles and a wheel unloading ratio of 90% as one of the safety-related criteria.
Table 3-3 Simulation conditions for Stringlining
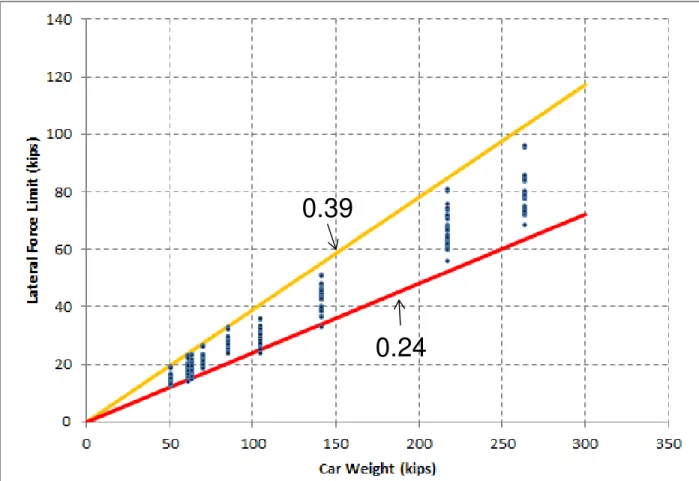
More than 10, 000 simulations were conducted to generate a coupler lateral force limit for the nine cars under a Stringlining condition. Gradually increasing lateral forces were applied equally to the coupler at each end of the car. The coupler lateral force limit is reached when one of the safety-related criteria shown in Table 3-1 is violated.
An example of the simulation results is shown in Figure 3-27 for maximum wheel unloading on the high rail vs. coupler lateral force for the empty lumber car with measured speeds on
measured tracks. The wheel unloading ratio reaches 90% at a lateral force limit of 17.2 kips on the 11.4 deg curve and 18.2 kips on the 0.75 deg curve. The weight of the empty lumber car is 61 kips. Therefore, RLW is 0.28 on the 11.4 deg curve and 0.30 on the 0.75 deg curve for the empty lumber car with measured speeds on measured tracks.
Car Nine car types/loading conditions 11.4 deg
0.75 deg tangent
Measured track Smooth Track
6 measured wheel profiles
Wheel Profile with cylindrical tread and AAR narraw flange
Measured speed Balanced speed 10, 15, 20, 25 mph
2 and 5 mph on tangent track 90% 100% Curvature Track Geometry Wheel Profiles Speed
March 2015 National Research Council of Canada Automotive and Surface Transportation
Figure 3-27: Maximum wheel unloading vs. coupler lateral force on high rail for empty lumber car with measured speeds on measured tracks under Stringlining condition
The coupler lateral force limits for the nine cars under all of the conditions listed in Table 3-3 were plotted against car weight in Figure 3-28, with detailed simulation results included in Appendix B. The red and yellow lines are the lower and upper bounds respectively, of the ratio of coupler lateral force limit over car weight, i.e., RLW. The results showed that the minimum and maximum RLW are 0.24 and 0.39, respectively.
March 2015 National Research Council of Canada Automotive and Surface Transportation
Figure 3-28: Lateral force limit vs car weight for Stringlining under various conditions
3.5.3 Effects of Various Conditions on RLW
In Figure 3-29, conditions were changed step-by-step from the leftmost column to the rightmost column to gradually include the effects of creepage, curvature, conicity, wheel unloading ratio, track geometry and car configurations.
0.39
March 2015 National Research Council of Canada Automotive and Surface Transportation
Figure 3-29: Ratio of lateral force limit over weight from static condition to dynamic condition In the first step, RLW is 0.41 for car rollover under a static condition, as discussed in Section 3.1. Under static conditions, the car is assumed to rest stationary on track with the lateral and vertical wheel/rail forces distributed evenly among all wheelsets. This is the maximum RLW under the most ideal condition, but it is not applicable to a moving car.
In the second step, RLW reduces to 0.39 for the empty hopper car with cylindrical wheels running on smooth tangent track and 100% wheel unloading. When a car is moving, creep forces alter the wheel/rail forces that were evenly distributed under the static condition. Coupler lateral force causes wheelsets to move toward one side of track resulting in flange contacts on that side. The rolling radius difference between a wheel with flange contact and the opposite wheel on the same wheelset generates different longitudinal creep forces on the two wheels and thus a yaw moment on the wheelset. As a result, the wheel/rail forces are no longer evenly distributed among different wheelsets, so RLW is lower than that under the static condition. In the third step, RLW declines to 0.34 when smooth tangent track is changed to a smooth 11.4 degree curve and cylindrical wheels are changed to measured wheels. As rolling radius
difference between two wheels on a wheelset is higher for measured wheels on sharp curves than for cylindrical wheels on tangent track, the distribution of wheel/rail forces becomes more uneven, further reducing RLW.
In the fourth step, RLW reduces from 0.34 to 0.31 when the wheel unloading limit is changed from 100% to 90%. Wheel unloading of 100% represents a complete wheel lift situation. Based on AAR Chapter 11, 90% wheel unloading was used in the dynamics simulations to represent a high risk situation of wheel lift.
In the fifth step, RLW drops from 0.31 to 0.28 when measured track perturbations are included. Our field test results have shown that track perturbations even within geometry limits can cause quite a significant change of vertical wheel/rail forces.
0.34 0.31 0.28 0.24 0.00 0.05 0.10 0.15 0.20 0.25 0.30 0.35
Static whole car rollover
Tangent Smooth Track Cylindrical wheel
100% unloading Empty Hopper car
Curve 11.4 deg Smooth Track Measured Wheel
100% unloading Empty Hopper car
Curve 11.4 deg Smooth Track Measured Wheel
90% unloading Empty Hopper car
Curve 11.4 deg Track Geomtry Measured Wheel
90% unloading Empty Hopper car
Curve 11.4 deg Track Geomtry Measured Wheel
90% unloading Empty well car
La ter al F or ce Limit / C ar w ei
March 2015 National Research Council of Canada Automotive and Surface Transportation
In the sixth step, RLW declines further to 0.24 when the car changes from an empty hopper car to an empty well car. Differences in weight, dimensions, side bearing, center plate, suspension and other components lead different cars to have quite different dynamics performance under the same running, track and in-train force condition. Therefore, RLW also changes with car type. The coupler lateral force limit is highest for the empty hopper car and lowest for the empty well car on the measured sharp curve under a Stringlining condition.
A similar analysis is shown in Figure 3-30 for the shallow curve of 0.75 deg. The gradual decrease of RLW under the effect of creepage, curve, conicity, wheel unloading ratio, track geometry and car configurations persists.
Figure 3-30: Ratio of lateral force limit over weight from static condition to dynamic condition
0.41 0.39 0.38 0.35 0.33 0.26 0.00 0.05 0.10 0.15 0.20 0.25 0.30 0.35 0.40 0.45 Maximum Tangent Smooth Track Cylindrical wheel 100% unloading Empty Hopper car
Curve 0.75 deg Smooth Track Measured Wheel
100% unloading Empty Hopper car
Curve 0.75 deg Smooth Track Measured Wheel
90% unloading Empty Hopper car
Curve 0.75 deg Track Geomtry Measured Wheel
90% unloading Empty Hopper car
Curve 0.75 deg Track Geomtry Measured Wheel
90% unloading Empty well car
La ter al F or ce Limit / C ar w ei g h t
March 2015 National Research Council of Canada Automotive and Surface Transportation
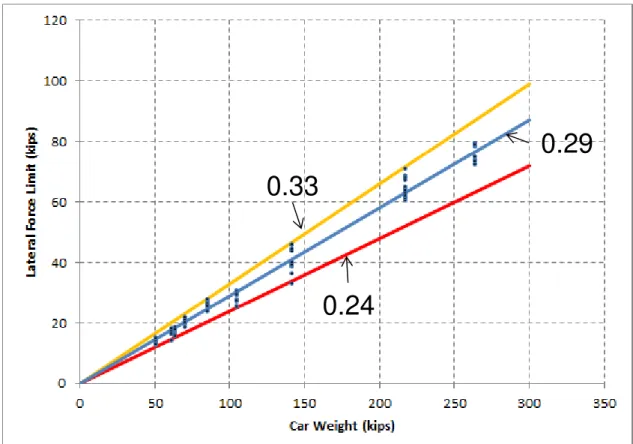
wheel, zero curvature, smooth track and 100% unloading ratio. These ideal conditions were used to illustrate the gap between RLW under static conditions and RLW under fully dynamic conditions. The RLW used for future trailing tonnage calculations should be based on more realistic field conditions. Removing those ideal cases from Figure 3-25 yields the plot of Figure 3-31, where the minimum and maximum RLWs for Stringlining are 0.24 and 0.33, respectively. A trendline with a fitted value of 0.29 is shown in Figure 3-31. Simulation conditions are listed in Table 3-4.
Table 3-4 Simulation conditions for cars with measured wheels on measured tracks Car Nine car types/loading conditions
Curvature 11.4 deg
0.75 deg Track Geometry Measured track
Wheel Profiles 6 measured wheel profiles
Speed Measured speed
Balanced speed Wheel Unloading Ratio 90%
March 2015 National Research Council of Canada Automotive and Surface Transportation
Figure 3-31: Lateral force limit vs car weight for Stringlining cars with measured wheels on measured tracks
0.33
0.24
March 2015 National Research Council of Canada Automotive and Surface Transportation
3.6.1 RLW for Jackknifing under Ideal and Measured Conditions
Various simulation conditions for Jackknifing are listed in Table 3-5. The simulation results of ratios of lateral force limit over car weight under these conditions are summarized in Figure 3-32. Detailed simulation results are included in Appendix C. The minimum and maximum ratios of lateral force limit over car weight are 0.17 and 0.26, respectively.
Table 3-5 Simulation conditions for Jackknifing Car Nine car types/loading conditions
Curvature 11.4 deg
0.75 deg Track Geometry Measured track
Smooth track Wheel Profiles
6 measured wheel profiles
Wheel profile with cylindrical tread and AAR narrow flange
Speed Measured speed
Balanced speed Wheel Unloading Ratio 90%
Figure 3-32: Lateral force limit vs car weight for Jackknifing under various conditions
0.26
March 2015 National Research Council of Canada Automotive and Surface Transportation
3.6.2 RLW for Jackknifing under Measured Conditions
The simulation conditions for the results shown in Figure 3-32 include both ideal and measured conditions. Similar to the Stringlining case, the recommended RLW used for trailing tonnage calculation under Jackknifing condition would be based on measured conditions shown in Table 3-4.
As shown in Figure 3-33, minimum and maximum RLWs for Jackknifing based on measured conditions are 0.17 and 0.25, respectively. A fitted trendline with a fitted value of 0.22 is shown in Figure 3-33.
Figure 3-33: Lateral force limit vs car weight for Jackknifing, measured tracks and measured profiles