Beyond the Lens:
Communicating Context
throughSensing,
Video, andVisualization
Gershon Dublon B.S., Yale University (2008)
Submitted to the Program in Media Arts and Sciences, School of Architecture and Planning,
in partial fulfillment of the requirements of the degree of Master of Science in Media Arts and Sciences
at the
MASSACHUSETTS INSTITUTE OF TECHNOLOGY
MASSACHUSETTS INSTITUTE OF TECHNO0LOGY DC 0 3 201 LIBRARIES
ARCHIVES
September 2011@ 2011 Massachusetts Institute of Technology. All rights reserved.
Signature of Author
Program in Media Arts and Sciences August 5, 2010
Certified by
Joseph A. Paradiso Associate Professor of Media Arts and Sciences MIT Media Laboratory Thesis Supervisor
Signature of Author
LEGO Papert Professor of Learning ResearchMitchel Resnick Academic Head Program in Media Arts and Sciences
Beyond the Lens:
Communicating Context through Sensing, Video, and Visualization
by
Gershon Dublon
Submitted to the Program in Media Arts and Sciences on August 5, 2011, in partial fulfillment of the
requirements for the degree of Master of Science
Abstract
Responding to rapid growth in sensor network deployments that outpaces research efforts to understand or relate the new data streams, this thesis presents a collection of interfaces to sensor network data that encourage open-ended browsing while emphasizing saliency of representation. These interfaces interpret, visualize, and communicate context from sensors, through control panels and virtual environments that synthesize multimodal sensor data into interactive visualizations. This work extends previous efforts in cross-reality to incorporate augmented video as well as complex interactive animations, making use of sensor fusion to saliently represent contextual information to users in a variety of application domains, from building information management to real-time risk assessment to personal privacy. Three applications were developed as part of this work and are discussed here: DoppelLab, an immersive, cross-reality browsing environment for sensor network data; Flurry, an installation that composites video from multiple sources throughout a building in real time, to create an interactive and incorporative view of activity; and Tracking Risk with Ubiquitous Smart Sensing (TRUSS), an ongoing research effort aimed at applying real-time sensing, sensor fusion, and interactive visual analytic interfaces to construction site safety and decision support. Another project in active development, called the Disappearing Act, allows users to remove themselves from a set of live video streams using wearable sensor tags. Though these examples may seem disconnected, they share underlying technologies and research developments, as well as a common set of design principles, which are elucidated in this thesis. Building on developments in sensor networks, computer vision, and graphics, this work aims to create interfaces and visualizations that fuse perspectives, broaden contextual understanding, and encourage exploration of real-time sensor network data.
Thesis Supervisor: Joseph A. Paradiso
Beyond the Lens:
Communicating Context through Sensing, Video, and Visualization
by
Gershon Dublon
The following people served as readers for this thesis:
- I
Thesis Reader I
-Hiroshi Ishii Jerome B. Wiesner Professor of Media Arts and Sciences Program in Media Arts and Sciences
Thesis Reader
Fr6do Durand Associate Professor of Electrical Engineering and Computer Science Department of Electrical Engineering and Computer Science
Acknowledgements
To my advisor Joseph A. Paradiso, for supporting the group with all his energy, for his continuing trust, and for sharing his passion for music.
To my readers Hiroshi Ishii and Fr~do Durand, for their constructive critique and support in this work.
To the Responsive Environments Group: Nan-Wei Gong, for being my ukulele soul-mate, and for being ever-critical and always constructive; Laurel Pardue, for being the best friend and ally I could hope for; Nan Zhao, for parachuting in from Germany, and being a star; Bo Morgan, for being love-struck, with everything and everyone; Matt Aldrich, for his refreshing sanity and clear thinking; Michael Lapinski, for fighting with
me sometimes but always making up in the end; Brian Mayton, for being the most capable, patient, and friendly group-mate to everyone; Mat Laibowitz, for being my on again, off again west coast pen pal; Nicholas Joliat, for being so creative, supportive, and witty; Noah Swartz, for walking in one day, ready to learn, build, and teach others;
Mark Feldmeier, for all his creative uses for junk; Sebastian Palacios, for being there
to help and learn in any way he can; and Amna Carreiro, for being there for everyone, through thick and thin.
Thanks twice, to my close collaborators Brian Mayton and Laurel Pardue.
To our collaborators across campus: Stephen Miles, Hiroshi Ishii, and the Future
ENEL Team.
To my collaborators: Nathalie van Bockstaele, Clovis Thielhaber, and Jackie
(Chia-Hsun) Lee, for always challenging me to look deeper, and to Wendy Jacob for
forming the collaboration, shaping my thinking, and supporting our work.
To Greg Tucker, Linda Peterson and Aaron Solle, for making everything happen.
To UROPs Anisha Jethwani, Patrick Hurst, Jeffrey Prouty, Turner Bohlen, and
Tanya Liu, for their energy and creativity.
To Peter J. Kindlmann for his support and guidance, and to Andreas Savvides, for so generously including me in his group, and for launching me onwards.
To Liz Carlin, Edwina Portocarrero, Pol Pla i Conesa, Alex Charrow, Tina
Zavitsanos, Aliza Shvarts, and Michael Geraci; and to my family: Dina, Giora, and Amalle.
Contents
A b stra ct... . 3
Acknowledgements ... 7
1 | Introd uction ... 11
1.1 From Data to Knowledge, and Back ... 11
1.3 Thesis G oals and O utline ... 15
2 1 R elated W ork ... 19
2.1 Human-sensing and Sensor Fusion ... 19
2 .1.1 S enso r Fusion ... . . 2 1 2 .2 C ro ss-reality ... . . 24
2.3 Interactive Information Visualization... 25
2.3.1 Information Visualization using Game-engines... 26
2.4 A ugm ented V ideo ... 27
2.5 Sensor Network User Interfaces ... 28
3
I
Sensor-driven Augmented Video ... 313.2 Towards Concurrent, Multi-view Salient Video... 34
3.3 Sensing and Video for Construction Site Safety ... 37
3.3.1 TRUSS System Architecture ... 40
3.3.2 Tracking and Sensor Fusion... 45
3.3.3 Interface to Safety Context Through Augmented Video... 49
3.4 Video Interfaces to Sensor Network Data ... 53
4 | Exploring Dense Sensor Networks ... 55
4.1 Introduction and M otivation ... 55
4.1.1 Sensor Data in Three Dimensions ... 58
4.2 DoppelLab ... 59
4.2.1 Towards Visual Analytics in a 3-d Virtual Environment ... 61
4.2.2 Visualizations in DoppelLab... 63
4.2.3 Client Implementation ... 67
4.2.4 Server and Database Architecture... 70
4 .3 A p p licatio ns ... . 74
4.3.1 Applying Data Visualization in DoppelLab... 74
4 .3 .2 G a m ing ... . . 7 5 4.3.3 Building Facilities and Information Management ... 76
5 | Interfaces to Sensor-driven Context...79
6 User Testing and Observation ... 83
6.1 TRUSS for Safety ... 84
6 .2 D o p p elLa b ... . . 8 6 6 .2 .1 W o rksho ps ... . . 86
6.2.2 Building Facilities and Information Management ... 87
6.2.3 DoppelLab Game... 88
7 1 Ongoing and Future W ork... 89
7.1 TRUSS for Safety ... 89
7 .2 D o p p elL a b ... . . 9 1 7.3 The Disappearing Act ... 93
7.4 Fusing Perspectives... 96
8 1 Looking Ahead ... 99
References ... 101
1
||ntroduction
With instant speed the causes of things began to emerge to awareness again, as they had not done with things in sequence (in the mechanical age).
Marshall McLuhan, "Understanding Media," 1964 [1]
1.1 From Data to Knowledge, and Back
Our environments have been filled with sensor networks designed to provide specific data and solve pre-determined problems, but information from embedded sensors remains, for the most part, siloed in closed-loop control systems and out of
reach of the majority of users. In a technology-driven rush to collect new and ever more streams of information, sensor networks have been deployed so quickly and broadly that users, be they consumers monitoring their personal energy usage or corporations tracking their global supply chains, can barely manage the data influx, much less know how to interpret the data. Moreover, rapid developments in sensor networks research are enabling real-time, mobile and distributed sensing, bringing these technologies into new domains, from homes and offices to construction sites. In many cases, workflows do not easily adapt to the changes and users face challenges integrating real-time information into existing practice.
At the same time, there is a prevailing emphasis within the sensor networks research community on a one-way "from-data-to-knowledge" paradigm, where information from multiple sensing modalities are fused together in a hidden layer to produce high-level inferences. While this approach can be extremely useful, the underlying statistical models require a posteriori knowledge, which in many cases is lacking or non-existent for new deployments. When such models are available, this approach tends to reduce data to single dimensions of interpretation- "a user is
consuming too much energy," for example. In addition, this knowledge is often separated from other data streams that may provide valuable context, or even produce differing results if examined together.
What if we could create user interfaces to the hidden world of densely distributed, networked sensors? Relatively little attention has been paid to facilitating open-ended and convergent exploration of these sensor networks, though many new and compelling results may stem from correspondences that span across networks, times, and spaces. Recent efforts to approach this problem theorized cross-reality environments, where ubiquitous sensor networks would interact with pervasively shared virtual worlds. These efforts focused on the point of exchange between physical and virtual environments, and hinged on the concept of massively multiplayer virtual worlds, like Second Life and Sun Microsystem's Project Wonderland. Many of the challenges faced by this research were particular to that concept of pervasive sharing in virtual worlds, chief among them the vacancy problem, which resulted from a combination of asynchronous usage and typically low levels of user interest. In addition, the research was limited by the technological and graphical shortcomings of the specific proprietary platforms to which it was tied.
This thesis focuses on encouraging and enriching individual users' experience of sensor network data. Motivated by growing numbers of sensor deployments and increasing access to previously siloed networks, this thesis lays the groundwork for exploratory modes of user interaction with sensor networks and the data they produce, and seeks interfaces that support this kind of interaction. By enabling users to move fluidly between convergent data streams and the higher-level inferences that fuse them together, this work aims to develop sensor network user interfaces that foster better understanding of sensor-driven context and the data that produces it.
To that end, this thesis documents research and development towards this goal, from sensor deployment to interface design. This work is spread across a set of separate, but related projects, taking a variety of forms and applying to a broad set of domains: first, an installation that composites multiple video sources into a single, salient view that is fed back to portals distributed throughout the environment; second, the introduction of real-time, mobile sensor network data and augmented video to a new domain, construction site safety; and third, a virtual environment that scalably collocates representations of dense, multimodal sensor data, applied to building information management. In addition, an ongoing project described here fuses wearable fine-grained location sensors with cameras to better interpret and filter contextual information for user privacy. These projects culminate in sensor network interfaces that interpret complex, contextual knowledge, like the activity taking place in a building or the state of the environment on a construction site, and present that information to users for exploration and interaction, through a combination of immersive 3-d visualization, animation, and augmented video.
Although these projects take very different forms, as a set of case studies they share a common set of system and interface design principles, which are elucidated in this thesis. While this thesis takes time to motivate each individual application, the larger aim is to analyze each as an instructional example of a different way of conceiving of new user interaction with sensor network data. From a systems perspective, the applications sense, interpret, and communicate information that relates people and their environments. These tasks involve integrating systems of wearable devices and embedded sensing infrastructure with servers and database architectures that can together accommodate and analyze heterogeneous data streams. This work explores strategies for processing and serving data from multiple sources in real-time.
At a higher level, each user interface makes use of the unique affordances of its medium, aiming to produce concise representations of contextual information from
sensors through visual metaphors equipped by those affordances. In a game engine, for example, they might include first-person perspective, 3-d visualization, physics, lighting, and interactive animation, among others. In their designs, these interfaces leverage such affordances to relate and combine the perspectives provided by the data streams on which they operate. Although each interface organizes and presents sensor data differently, all make sensor fusion central to the user experience, encouraging users to see and explore relationships across sensing modalities. These inferential visualizations expose the process of the fusion that produces them, while layers of interactivity provide a means for exploration of this information. Finally, this thesis raises questions about how sensor data might be organized and presented to users in light of its goals, and looks for answers in discussion, preliminary user evaluation, and expert interviews.
Building on documentation of these three projects and discussion of their common system and interface design goals, this thesis proposes a framework for thinking about user interfaces that support and encourage exploration of dense sensor networks, and begins to map the vast landscape of this application space through the examples given, as well as past work. More broadly, in a world of increasingly pervasive sensing and sharing, this thesis seeks to trouble the role of sensor networks as simple tools of either surveillance or closed-loop control by advancing technologies that support open-ended exploration. By encouraging users to move fluidly between convergent data streams and the higher-level inferences that fuse them together, this thesis seeks to foster better understanding of sensor-driven context and the data that drives it.
1.3 Thesis Goals and Outline
This thesis develops sensor network user interfaces that interpret, visualize, and communicate context, and proposes a common framework for their design that supports open-ended exploration while emphasizing saliency of representation. A
number of interface examples are presented in detail, each targeted at a very different application-interaction with real-time video through a portal, construction site safety, personal video privacy, and open-ended, cross-reality browsing of
dense sensor network data. The first examples hinge on video as the key channel for communicating sensor data, fusing distributed sensors and cameras to augment video streams with contextual information derived from the sensors. The last example, called DoppelLab, has a broader reach, and attempts to intuitively and scalably collocate visual representations of dense, multimodal sensor network data. In this document, each project is made to stand on its own in terms of application and motivation, but ideas and designs are developed, evolved, and shared across all.
This thesis builds on a diverse body of related work spanning sensor networks and sensor fusion, cross-reality, visual analytics, augmented and structured video, and sensor-network user interfaces. Chapter two situates this thesis within the related fields, and reviews the literature for insight. Presentation of the examples is split into several chapters-chapter three introduces the camera-wearable fusion and video augmentation interfaces, and chapter four the cross-reality browser. Chapter five draws from the previous chapters to propose a common design framework and set of goals for these applications, generalizing from the specific examples to a conceptual common ground. Chapter six details the user studies and evaluation done with expert professionals in the construction and building management industries. Chapter seven details ongoing work and future plans, and chapter eight looks ahead to a new front in cross-reality interfaces.
The systems presented in this document are the result of a number of close collaborations, both within the Responsive Environments Group at the MIT Media
Lab and across the Institute. Wearable sensing hardware for construction workers was developed by Brian Mayton as part of a larger collaboration between the Responsive Environments Group, the Tangible Media Group, and the Senseable City Lab at MIT. DoppelLab is a joint effort with Laurel S. Pardue and several undergraduate researchers.
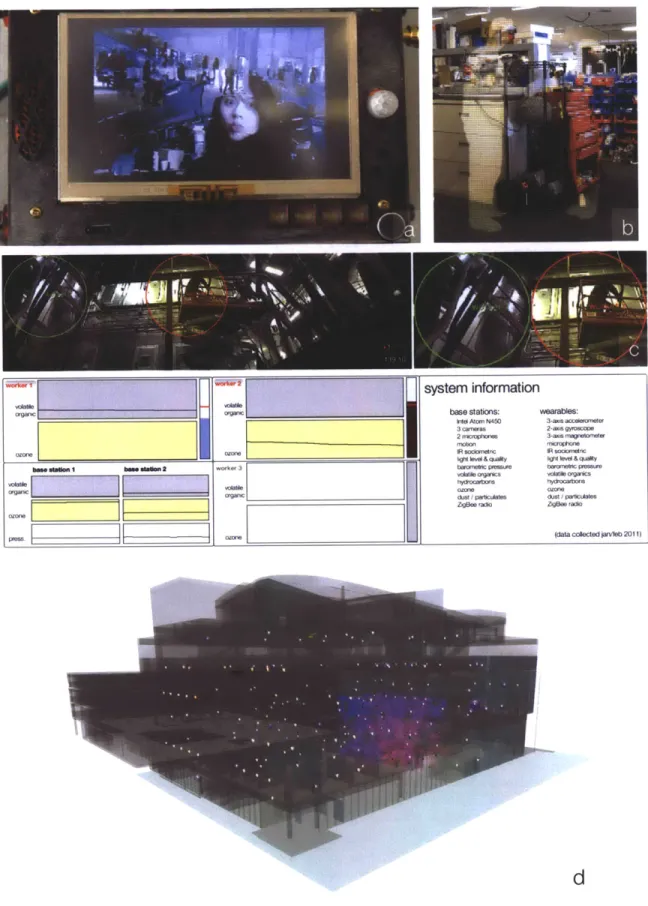
system informatior base stations: intel Atom N450 3 cameras 2 incrophones IR sociomesnc ght e & quaity barometric pressu ~Vows~ o~gw*cs "/ PateMIS Zgeee rai wearables: 3-axs accelerometer 2-Ms gyvoscope 3-ams magneometer OR soclometric Wgh lWei a quelly barometric pressure (aae arces
(data coleted WVfab 2011)
Figure 1: Communicating context from sensors through interactive video and visualization.
(a) Flurry; (b) Disappearing Act; (c) TRUSS for Safety; (d) DoppelLab
17
WAI
base tai 1 tene 1aan 2 worker 3
2
1
Related Work
This thesis develops systems that integrate pre-existing and custom-designed sensor network systems with new user interfaces to multimodal sensor data, and combines information from multiple sensors to produce salient representations of contextual information in the form of augmented video as well as 3-d visualization and animation. This work integrates literature from a wide variety of related fields that engage sensor networks, including human-sensing, sensor fusion (in particular fusion of cameras and distributed mobile devices), cross-reality, visual analytics, augmented and structured video, and sensor-network user interfaces. Further chapters review some of this literature as it relates to the individual applications described within each one. This chapter introduces selected work from those fields, providing a high-level overview of prior work relevant to the larger thesis.
2.1 Human-sensing and Sensor Fusion
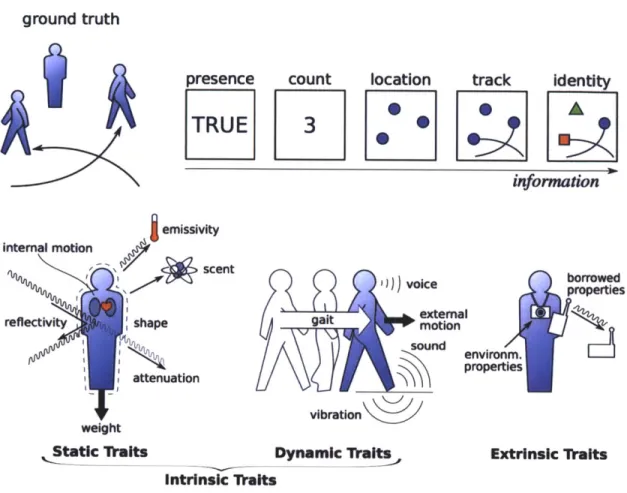
Human-sensing describes a broad class of problems relating to the application of indirect sensing to the extraction of spatiotemporal properties of people as they move through their environments. This section briefly touches on human-sensing challenges, and relates them to the larger problem of sensor fusion. Teixeira and Dublon provide a comprehensive, multi-disciplinary survey of techniques for human-sensing in [2], covering work spanning detection of presence, counting, extraction of indoor location, tracking, and identity. Figure 2, excepted from [2], illustrates these spatiotemporal properties and the traits that can be used to infer them.
ground truth
presence
count
location
track
identity
TRUE 3-information emissivity internal motion C" scent borrowed voice bo
reflectivity shape gait emxtn
environm. attenuation
vibration weight
Static waits Dynamic Omits Extrinsic 1raits
Intrinsic 1raits
Figure 2: Top: human-sensing goals; bottom: traits linked to a variety of sensing modalities (From A Survey of Human-Sensing, Teixeira, et al.)
Approaches to the problem are split between those that instrument people with physical sensors, like accelerometers or radio-location tags, and those that rely purely on sensors in the infrastructure, like cameras and microphones. When instrumentation is a possibility, fine-grained radio-location using ultra-wide-band radios and time-of-flight ranging best suits all five spatiotemporal properties; however, this approach requires significant radio infrastructure, facilities for distributing and managing tags, and a willingness on the part of users to carry the devices. Still, the technology is advancing, and costs are dropping rapidly.
Video is the most effective infrastructural sensing modality covering these properties. Recent approaches to detection extract specialized features, such as
SIFT (scale-invariant feature transform) [3] or HoG (histogram of oriented gradients)
[4], and perform classification using support vector machines or other methods. These features have significantly improved performance of vision-based detection and tracking. Still, the performance of most algorithms tends to decrease dramatically when the environment is cluttered or changing (e.g. inconstant light, frequent occlusions, or large numbers of people). This shortcoming has prompted researchers to develop increasingly complex models and methods that can work under a variety of conditions. Even so, despite significant advances in research, and admirable tracking performance when people stay within the field of view of a camera, vision alone cannot reliably count people under many real-world conditions, much less consistently identify them as they move through space.
2.1.1 Sensor Fusion
Sensor fusion algorithms combine multiple sensors or sensing modalities to produce inferences, leveraging the emergent benefits of the data fusion for improved performance. Fusion techniques can be used to build higher-level features that capture the affordances of each modality or avoid pitfalls associated with each one. In this thesis, the term sensor fusion is used broadly to describe the combination of multiple sensing modalities towards some better result than either could have independently produced. Under this definition, a good deal of applied sensor networks research makes use of fusion, in particular for activity recognition but also for human-sensing and other general sensing problems. The projects in this thesis aim to apply sensor fusion to produce intuitive interfaces to sensor data.
There are many approaches to sensor fusion, ranging from relatively simple flowcharts, confidence weighted averaging [5], or distributed average consensus methods [6] to others that employ Bayesian networks for the data fusion, applying
Kalman or particle filters, or building hidden Markov models. This section reviews several papers that apply fusion to problems related to the larger thesis.
Lukowicz, et al. develop a system for recognizing tasks like sawing, hammering, and turning a screw, among others in a wood workshop using a combination of wearable microphones and accelerometers mounted on a user's arm [7], [8]. The authors assume that in their application, loud sounds detected near a user's hand indicate shop activity, and use the difference in intensity between the hand and the upper arm to segment relevant activity from the background. Their system then applies linear discriminant analysis (LDA) to the frequency spectrum (FFT) of the audio data and classifies segments by their Euclidean distance to the mean of each class in the reduced feature space. At the same time, the system extracts features like peak counts within a time window and mean peak amplitude from the accelerometer data, as well as a single axis of raw data from each accelerometer, and applies hidden Markov models for classification. The authors test a number of methods for fusing these classifications: a simple comparison of top choices, which designates as valid only those classifications that agree; and class rankings, which examine each classifier's per-class confidence. Several class ranking methods are tested, and the authors report the best results for class ranking using logistic regression.
Camera-wearable sensor fusion is motivated by the premise that significant algorithmic challenges and computational costs of parsing video can be mitigated
by the labeling of tracked objects with lower-dimensional and ID-linked sensor data
that are synchronized with the video capture. Candidates for this fusion include inertial measurement units (IMU) that carry some combination of accelerometers, gyroscopes, and magnetometers, or any other sensors that can capture some shared state also available to a camera.
Teixeira, et al. show in [9] that people carrying wearable accelerometers can, under certain conditions, be reliably linked to their corresponding camera tracks by matching gait timing parameters between the accelerometers and the camera.
Heel-strike and mid-swing features are extracted from the accelerometer using the extrema of the vertical acceleration of the walker, and from the camera using the extrema of the standard deviation of the walker's foreground blob, in the direction of the ground plane. The authors achieve average recognition rates of over 85% in simulations of 10 people in a scene, even as subjects leave and re-enter the field of view. However, this strategy fails when subject are not walking, and when gait timing cannot be realistically extracted from a camera, which is often the case as a result of occlusions or non-ideal camera angles.
In [10], the authors generalize this idea, forming a hidden Markov model for each person consisting of a measurement from the inertial sensor and a measurement from the camera and applying maximum a posteriori estimation to generate the most likely matches. On the camera side, acceleration magnitude and yaw are computed from the raw tracks; on each person, the magnetometer supplies the direction of motion, and the accelerometer is used to discover whether the person is walking or stopped (classified by the amount of vertical bobbing seen by the accelerometer). The authors report remarkably good tracking results in simulation that juxtaposes multiple, real tests using a dense network of overhead cameras and dedicated IMUs.
In [11], Laibowitz, et al. apply multi-sensor techniques towards the automated creation of personalized documentary video. Their system, called SPINNER, labels feeds from many distributed cameras throughout an environment with synchronized data and audio gathered from wrist- and lapel-worn mobile sensor devices, and uses those data to select and edit video clips in response to user queries. The automated annotation of the video covers subjects' identities, activities, and social dynamics, enabling queries that hinge on those properties without requiring the
intractable amount of manual labor that would be needed to manage a system that multiplies every hour of video by the number of nodes. While the system does not strictly perform sensor fusion with the video, the synchronized annotation is sufficient to extract those properties for the application. However, the system does not label individual pixels in the video-only the clips themselves. Some application of fusion to associate wearable sensor data with individual actors, along the lines of
[9] or [10], could enable much finer-grained editing and selection, as well as
automated video augmentation or other pixel-level, actor-specific manipulation.
2.2 Cross-reality
Paradiso coin the term cross-reality in [12], to describe the mixed reality environment that results from the fusion of densely distributed sensing and pervasively shared virtual worlds, like Second Life. Cross-reality is distinguished from Milgram and Kishino's classical taxonomy of mixed realities [13] by its seamless bridging of the physical and virtual worlds through ubiquitous sensor and actuator networks, to form a dual reality [14], in which the these worlds meet. The two worlds are punctuated by so-called "wormholes" through which information and actuation bi-directionally tunnel, making use of available interfaces, from video portals to smart plugs [15].
In [15], Lifton, et al. develop this idea through several examples that cross a network of sensor-laden, web-controllable smart plugs into Second Life. In their
ShadowLab project, a floor-plan of the MIT Media Lab is augmented with
visualizations of data from this network. In another example, the authors cross audio, video, and sensor data from a network of media portals [16] into Second Life, and creatively leverage the 3-d world to map time to space-allowing users to "walk" from the present moment back through time in a video. Consistent with their
focus on shared worlds, the authors develop animated metamorphoses of the player-controlled avatars that respond to sensor data. Other work, like [17], has focused on supporting collaboration in these environments. This thesis presents works that builds on cross-reality, but focuses on individual users' experiences of sensor network data through interactive visualization in virtual environments.
2.3 Interactive Information Visualization
The fields of information visualization (Infovis) and interaction design are closely linked, though research efforts have generally treated them as separate endeavors. The literature of Infovis has tended to focus on building and cataloging salient visual representations of data, evaluated through a kind of "cognitive information economics" that measure the amount of information conveyed against the cognitive load associated with the observation [18]. While the separation between representation and interaction has been prevalent in the literature, there are notable exceptions, and increasingly so. Over a decade ago, Woodruff, et al. developed a framework for the use of zoomable user interfaces to would present visualizations with constant information density across a variety of scales [19]. Even earlier, Bederson, et al. conceptualized a zoomable ("stretchable") graphical sketchpad on which all the information stored on a computer would be organized and represented at different scales [20].
More recently, an offshoot of the Infovis community has developed a field of visual analytics to represent interactive visual interfaces that support analytical reasoning and decision-making. Visual analytic designs aim to transmit large data sets concisely, enable comparison between multiple streams of information, and encourage user interaction with visualizations [21]. These approaches apply strategies such as dynamic highlighting and obfuscation of subsets of visualized
data to support hypotheses or call attention to outliers in a data set. Users choose between modular representations, assess the efficacy of various designs, and aid in the fabrication of new designs. This ease of interaction facilitates feedback workflows from design to inference and back.
In [22], Yi, et al. explore the role of interaction in Infovis, surveying the field to build a taxonomy of low-level interaction techniques for visual analytics, as well as a collection of higher-level interaction categories:
- Select: mark something as interesting
- Explore: show me something else
- Reconfigure: show me a different arrangement
- Encode: show me a different representation * Abstract/Elaborate: show me more or less detail
- Filter: show me something conditionally
- Connect: show me related items
Yi, et al. [22]
The authors catalog users' generic intents in visual analytic applications, served by a variety of specific visualization strategies from the literature, such as interactive pie charts and semantic zooming, which, though quite different in form, both serve towards elaboration. These specific strategies can then be incorporated into a toolbox for interaction design in these applications.
2.3.1 Information Visualization using Game-engines
Outside of cross-reality, a small number of researchers have examined the use of game engines for interactive information visualization. [23] provides a clear introduction to the use of game engines for scientific research, outlining the modular system architectures that can support realism in simulation when precision is not critical, but exploration may be helpful.
Brown-Simmons, et al. use game engine affordances to encourage exploration of environmental data and communicate a specific point of view [24], advancing an artistic and scientific framework for thinking about game engines in this context.
Building on this work, [25] catalogs a small set of particle emitters for the visualization of Earth science data in a game engine, towards tools for education. Kot, et al. apply a game engine to information visualization, in [26], but focus on gaming-derived metaphors such as shooting, limiting their scope. In general, these efforts have focused on applications of game engines to specific simulations or applications; in contrast this thesis presents a game-engine based tool for open-ended exploration and development.
2.4 Augmented Video
Augmented reality (AR) spans a large field of work beginning in the early 1990s, in which a view into the physical world is mediated by or annotated by data from outside the original sensory channel constituting the view. A sub-field of augmented reality, augmented video renders layers of information from the physical world in the image domain, often on top of a live camera view; a broad collection of work falls into this category, and several examples are included here. Bimber and Raskar treat the subject thoroughly in [27].
Early on, researchers theorized head-mounted displays that would augment the user's view with knowledge about the world. Feiner, et al. looked at ways of delivering knowledge about maintenance and repair processes to users wearing such displays, tracking users' activities and adjusting the rendered plans accordingly [28]. Computer vision and graphics play a central role in AR research. In
[29], Mann, et al. develop diminished reality, which selectively removes objects from
objects, remove them, and perform image completion using patches from the surrounding texture to fill in the gap [30]. In [31], Sebe, et al. track objects and insert them into a 3-d environment for a surveillance application, applying segmented blobs as textures to polygons in the virtual space.
Structured video encompasses work in which some axes of structural context from video are meaningfully encoded in the image domain through augmentation, most often for compression or human consumption. This structural context is extracted using vision techniques like motion estimation and segmentation, and includes information like scene content and camera motion [32]. This information is then relayed to users through interactive interfaces that make use of video augmentation or other manipulation. In [33], Elliott constructs an augmented spatiotemporal volume from the video that reveals information about its content on its side; the viewer shows automatically detected scene cuts alongside a color frequency histogram for each frame. In [34], Teodosio and Bender define a class of images called "Salient Stills" which capture and convey information from across times in single, still images. In [35], Correa, et al. develop interactive, dynamic video narratives, which extend the concept of salient stills to moving panoramic video that tracks one or more actors to form salient video.
2.5 Sensor Network User Interfaces
There have been a number of recent efforts to create general purpose sensor network user interfaces. Lifton, et al. developed the Tricorder, a location- and orientation-aware handheld wireless sensor network navigator and data browser, based around an early smartphone [36]. Later work brought about the Ubicorder, a tablet-based graphical user interface (GUI) for sensor data browsing as well as defining inference rules [37], [38]. Both systems featured a graphically- augmented
2-d floor plan on which sensor data is illustrated. Other work has focused in
particular on user interfaces for defining inference rules on data streams, either through GUIs or scripting [39], [40]. Several commercial enterprises have developed user interfaces to sensor data, for consumer applications ranging from home energy monitoring [41], [42] to personal fitness [43]. These tend to focus on single modalities and center on 2-d graphical representations that can become quite complex as networks grow.
3
I
Sensor-driven Augmented Video
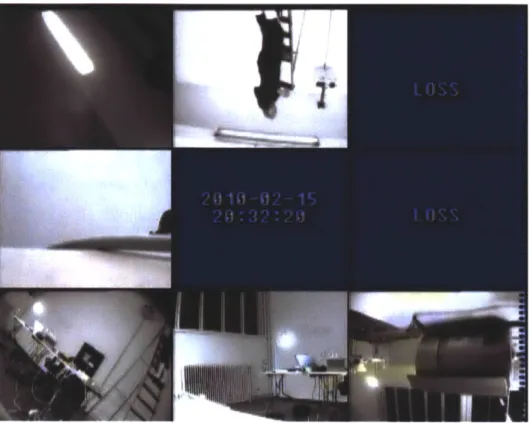
Figure 3: Multiple camera views, organized as adjacent rectangular windows in the style of most video surveillance interfaces. [Image credit: Scott Fitzgerald, February 15, 2010 via Flickr, Creative Commons Attribution]
3.1 Introduction and Motivation
Streaming video is by farbandwidth communication interfaces to live video in woefully antiquated. At the well as to the information adjacent views. Outside
the most ubiquitous and effective medium for high-of contextual information to remote users, but most use today, like the one depicted in Figure 3, remain same time, there are limits to the reach of a camera, as a viewer can realistically extract from many separated,
extensive use of the split format and which this thesis does not consider, this section investigates ways of creating more compelling and concise user interfaces to remote context through video.
As noted in chapter two, a number of research efforts over nearly two decades, like [34] and [35], have originated ways of collapsing time in video to create concise representations of complex movie sequences, composed of still images or short video summaries. In contrast, this section develops sensor-driven techniques for composing concise, interactive visualizations of multiple, concurrent video streams. This work is concerned with the relationships between camera perspectives and the search for salient details in each view, or across multiple. How can distributed sensing being used to estimate what the camera cannot see, or what is happening just outside the field of view? How are the cameras situated? Finally, how can a user be transformed from passive observer into involved participant?
Questions like these are inspired by artwork like the paintings in Figure 4. In Magritte's "The Blank Cheque," layers of depth are interwoven to link spaces and viewpoints, rendering foreground objects partially transparent. The oddly compelling cognitive dissonance brought on by the painting references the viewer's perceptual link to the hidden contexts of occluded objects, and suggests a way of thinking about occlusion in next-generation video. In the Pistoletto work, called "The Visitors," figures painted on tissue paper and affixed to floor-to-ceiling, mirror-finished steel create the impression that the surrounding environment flows through the work. This simple layer of interactivity turns the work into a portal that incorporates its ever-evolving context, causing the work to reach out of the 2-d plane and into the real (outside) and imagined (inside) spaces that it continuously creates and transforms.
Figure 4: From left: Ren6 Magritte, "The Blank Cheque" (1965, oil on canvas) [National Gallery of Art, Washington, D.C.], and Michelangelo Pistoletto, "The Visitors" (1962-1968, figures painted on tissue
paper and affixed to mirror steel) [cite: Galleria Nazionale d'Arte Moderna, Rome, Italy].
Seeking to harness this transformative potential of perspective-hacking works like the Magritte or Pistoletto, this chapter looks at ways of creating multi-perspective video interfaces that leverage distributed sensing to extend a camera's reach beyond the lens and into the world. Recent advances in sensor fusion, wearable radio location tracking, and embedded computer vision point to new possibilities in distributed smart cameras and sensor networks, where applications can start to assume persistent correspondence between tagged objects and their image representations across multiple, networked cameras. This chapter develops systems that fuse cameras and wearable sensors to support such capabilities, and documents a set of projects that apply this thinking to the design of augmented video-based user interfaces. Mirroring the larger thesis, each of the projects in this
Figure 5: Still frames captured from Flurry at two different times of day, showing composites of building-wide activity captured by sixteen distributed cameras and fed back to screens on each camera device.
chapter stands on its own in terms of motivation and application, but ideas are developed, evolved, and shared across all three.
3.2 Towards Concurrent, Multi-view Salient Video
As noted above, nearly two decades of research have produced powerful methodologies for condensing visual information from pre-recorded video into single frames or short sequences, but for the most part, these techniques do not extend to the fusion of multiple concurrent videos, especially in real-time. Outside of the surveillance industry, which to date has been the only real consumer of distributed, real-time video, increasing deployments of smart camera networks and systems of ubiquitous media portals like [11] have brought new interest and attention to the problem. Assuming a large number of distributed cameras, how
Figure 6: Flurry, fed back in real time to the media portal
can we create salient visual representations of the activity taking place throughout a building?
An early attempt to answer this question produced Flurry, an interactive video installation that used the ubiquitous media portals [11] distributed throughout the MIT Media Lab complex to capture fragments of activity from multiple perspectives and weave them together. In the application, video frames from a large number of viewpoints are collected on a central server and composited into a single stream
using linearly decaying motion-history images [45] to key the sources and blend them accordingly. Objects that move more than others are made more visible in the output video, and fade over time when their motion stops.
In the installation, which debuted during a conference at the MIT Media Lab in March, 2010 and continued running for several subsequent weeks, the composite images were streamed back to the devices' screens, turning them into permanently
open video portals. Looking into one device, viewers would see themselves mixed with anyone else doing the same on another device. Because the nodes were distributed across public and social spaces in the lab, activities in each space were automatically broadcast to others, bringing about immediate engagement through the portals as well as inviting physical attendance. Users treated the devices as
portals, interacting with others who happened to simultaneously look into the multi-perspective, multi-user window formed by each node.
Through camera-mediated engagement with its subjects, who encountered the installation at the portal itself, Flurry proposed accidental correspondences within the lab-wide fabric of activity that might give rise to unexpected and alternative lines of communication. By acting as a mirror and bringing its viewers into the interface, Flurry invited exploration of the content it was offering-watching meant contributing, and vice versa. In this way, Flurry recalled the Pistoletto
mirror-paintings and their transformative, incorporative effect on both space and
audience. After the installation, Flurry's visualization was stored as a static record of these input-output user interactions as well as the everyday happenings of a research lab.
To address privacy concerns, the devices could be switched off with clearly marked lamp switches. Separately, the media portal system faced a great deal of privacy-related challenges, and nodes were often turned off by building inhabitants. In [46], the system was used to test privacy preferences and develop novel solutions; in a number of experiments, the authors test users' willingness to give up personal privacy in exchange for different kinds of applications and services. In informal observation of Flurry, it was found that nodes were left on by users in abnormally large numbers. This is consistent with results in [46] that suggest that more explicit transactions of personal information mitigate users' mistrust; the installation made its use of cameras clear by feeding the video output back to the nodes in real-time-users could see what they were sharing as they shared it.
There were a number of shortcomings to the installation that informed future work. First, the motion-history masks in themselves were not ideal for creating scalably legible results; as activity increased to a maximum, the composite became convoluted and messy. Second, by maintaining the spatial arrangements of pixels all the way from the imagers to the output of the compositing process, Flurry never brought the camera beyond its traditional field of view, and wasted precious screen real-estate that could have been used to make the its composition clearer. Finally, though the work inherited modes of interaction from Pistoletto, it did not summon Magritte; as a result of its reliance on the camera as its sole input modality, there was no hacking or redirection of perspective, and no rendering of the invisible. The video interfaces documented in the next sections attempt to address these concerns while taking lessons from Flurry's involvement of users through interaction and natural incorporation.
3.3 Sensing and Video for Construction Site Safety
One of the motivations for this thesis at the outset was increasing numbers deployments of sensor networks in domains where real-time information collected from sensors and delivered remotely has never been part of users' workflows. Moreover, there are a number of critical application domains which demand decision support, as opposed to purely algorithmically-driven automation through sensor fusion. In these cases, the question becomes how sensor fusion can play a supporting, visual analytic role for users, especially for better understanding remote context.
This section develops a system for one domain, construction site safety management, that is not only new to real-time data but also requires expert,
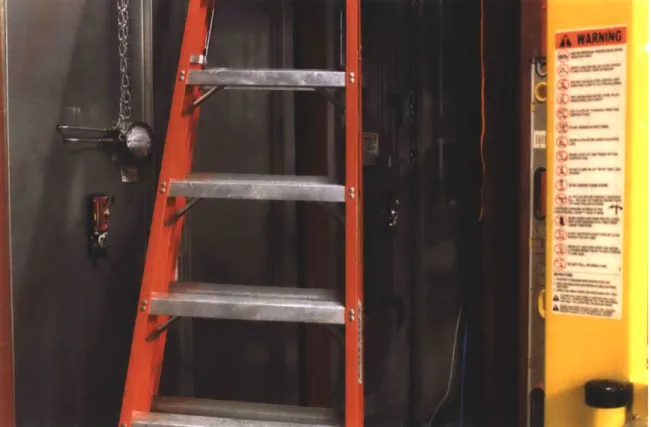
Figure 7: Cluttered construction site with two TRUSS sensor base stations magnetically mounted on either side of the ladder
human-in-the-loop engagement that cannot be replaced by automation. This project contributes to the larger body of work in this thesis in its application of camera-wearable sensor fusion towards an interactive and intuitive interface to sensor network data and video. Like the installation described in the last section, this project collects video from multiple sources and mixes it to distill and communicate context, but in this case, the compositing process is driven by data from sensors, mixing the cameras' perspectives with environmental sensing of otherwise invisible properties.
This project conceives of a remote exploration and decision-support system, called Tracking Risk with Ubiquitous Smart Sensing, or TRUSS, that infers and renders safety context on construction sites by fusing data from wearable devices,
distributed sensing infrastructure, and video. Wearable sensors stream real-time levels of dangerous gases, dust, noise, light quality, precise altitude, and motion to base stations that synchronize the mobile devices, monitor the environment, and capture video. At the same time, small, low-power video collection and processing nodes track the workers as they move in and out of the field of view, attempting to re-identify the tracks using information from the sensors. These processes together connect the context-mining wearable sensors to the video; information derived from the sensor data is used to highlight salient elements in the video stream; the augmented stream in turn provides users with better understanding of real-time risks, and facilitates remote human decision support.
To test the system, data was collected from workers erecting and welding steel catwalks in a building during active construction; the results of these tests, as well as user evaluation from industry experts, are in chapter six of this thesis. The first iteration of the system, used in this user study, was not run in real-time (though the hardware would allow it), but rather to test the hardware and software in the challenging environment of a real-life construction site. For clarity, it is important to note the distinction between the system architecture, detailed in the next section, and the data collection exercise, which was not supporting a real-time risk assessment interface. The term "real-time" is used in context of the architecture to illustrate the design thinking, as well as plans for future testing and deployment. The depictions of interfaces and sensor data in this chapter show the results of the data collection as a proof-of-concept towards the near-term goal of real-time sensing.
This work is ongoing, with next generation hardware and software in active development. The second design iteration addresses many of the shortcomings of the first, and will run in real time. The gas sensor daughter board was designed for the project by TRUSS collaborator Brian Mayton in the Responsive Environments Group. Base station and mobile badge devices were originally designed by Mathew
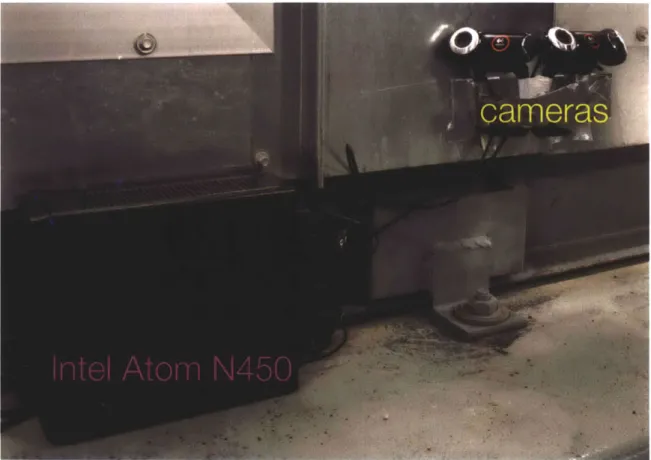
Figure 8: Low-power computer performs NTP time synchronization, bridges ZigBee network to the Internet using WiFi, and manages camera/vision subsystem.
Laibowitz for the SPINNER ubiquitous media portal system [11] and reprogrammed for this application.
3.3.1 TRUSS System Architecture
The next sections focuses principally on the TRUSS system architecture and interface design, and relate the latter to the general design principles introduced in the thesis introduction and earlier sections. The system is composed of three main
hardware components, organized into a tiered, networked architecture: battery-powered wearable sensor devices, small, externally battery-powered radio base stations
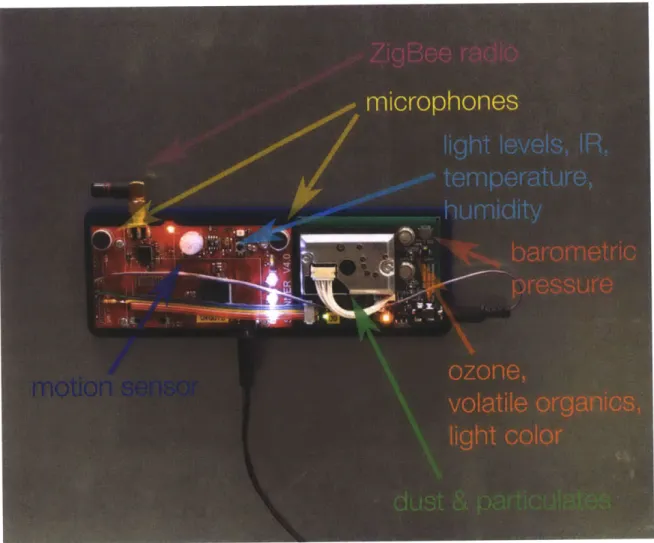
Figure 9: Base station sensor node, with "red board" streaming sensor hub paired to gas-sensor board.
with onboard sensors, and cameras attached to embedded Intel Atom-based computers running Linux. The embedded machine consumes approximately an order of magnitude more power than the base station, and the base station 2-3 times that of the mobile node. The components are time-synchronized using the ZigBee radios, enabling applications that fuse data from the independent sources; without synchronization the system becomes effectively non-functional, as none of the data can be correlated and confirmed across the nodes. In the absence of some models, and particularly in the unpredictable and challenging environment of a construction site, the uncalibrated signals from the gas sensors and drifting
(though calibrated) signals from the pressure sensors cannot be reliably linked to activities.
The embedded computer acts as a network bridge between the low-power ZigBee network and a fixed-infrastructure WiFi (or wired LAN or GSM cell network, in the general case), performing network time protocol synchronization (NTP) over the Internet, synchronizing the local ZigBee network with NTP time, and enabling remote connections. The computer also hosts a video subsystem consisting of a camera, a computer vision library, a video encoder, and a streaming server. Another, significantly more powerful remote server could perform further operations on the video before it reaches users, adding another tier, though this is not the case
in the existing architecture.
The fixed base stations shown in Figure 7 and Figure 9 are made up of a general purpose radio and sensor node (called the "red board") connected to a daughter board designed for environmental monitoring. The latter is inspired by Angove and O'Flynn in [47]. The onboard sensors include a PIR motion sensor that can be used to trigger data collection or processing when workers are detected. Stereo microphones pick up loud crashes and yelling. An infrared "sociometric" sensor [48] on both the base stations and mobile nodes is used to detect where workers are facing, and when and how they work together. Light level and color sensors keep track of lighting conditions to detect welding or anomalous flashes of light. A barometric pressure sensor on the base station, in tandem with one on each mobile node, can together provide a precise (-10cm resolution) measure of relative altitude, measured between the base stations and mobile nodes [49]. Both base stations and mobile nodes carry the environmental monitoring system, with sensors that measure un-calibrated levels of volatile organic gases, hydrocarbons, ozone, and particulates.
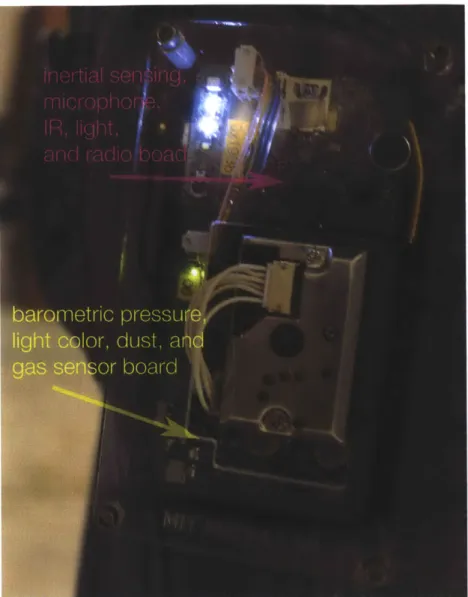
Figure 10: Belt-mounted wearable sensor node, with sensor badge paired to environmental monitoring board.
The mobile node includes a single microphone, the light level and color sensors, the IR sociometric sensor, and the sensor measuring temperature and humidity. It also carries a standard suite of inertial sensors: a 3-axis accelerometer, 2-axis gyroscope, and 3-axis magnetometer. ZigBee radios on both the mobile and infrastructure nodes are used for synchronization and can be used for rough
Ozone, 28 Jan 2011 10000 -- RB1 RB2 -- RB3 15000 - Worker 1 - Worker 2 Worker 3 14000
g
113000 'I 12000- 11000-1000 :30 11:00 11:30 12:00 12:30 13:00 13:30 14:00 14:30 TimeFigure 11: Ozone measurements, reflecting welding activity, collected from 3 workers and 3 base stations on one work day. The sensors are uncalibrated, but reflect relative levels.
localization of the mobile devices to within a rough area of 5-10 meters radius using radio link quality (due to hardware issues, we were unable to monitor the much more effective radio signal strength indicator). In our first test, the radiolocation accuracy suffered from a very challenging environment, facing large metal obstructions nearly everywhere and too low a density of base stations to provide useful location information.
This particular set of sensing modalities was chosen in consultation with construction site safety experts, based on their data about the most common causes of accidents on their sites. Commonly reported accidents include slipping and falling, falling objects, and dangerous chemicals. The gas sensors we included
were chosen for the specific construction site targeted for our first deployment, which was to involve steelworkers who would be working at height while cutting and welding very large steel structures. These activities would increase the risk of falling objects while generating generate gases and particulates that could be
flammable or harmful if inhaled.
3.3.2 Tracking and Sensor Fusion
In our system, workers wearing belt-mounted mobile sensor devices are monitored and tracked as they go about their normal activities; however, the cluttered and constantly changing environment of a construction site creates a particularly challenging tracking problem, with frequent occlusions, reflections and flashes from welding, and an inconstant background, subject to construction activities and large equipment in motion. Relying purely on radio-based tracking is also not realistic, as base stations must move relatively often to adjust to changing conditions and large metal objects are in constant motion, ruling out careful calibration. Dead-reckoning using wearable inertial sensors is prone to accumulating error, making it intractable.
Of all the available sensors, cameras are the most effective external tools for
tracking, as long as the worker does not leave the field of view or become significantly occluded; when a track is lost, the camera alone cannot recover it later.
Facing this rapidly changing, cluttered and heavily occluded environment, we opted for a relatively simple vision pipeline: a mean-shift blob tracker [50], operates on the image after a process of frame-differencing, thresholding, morphological operations to remove noise and join disconnected components, and a weighted moving average to smooth the motion. This approach works well to find and track people who move with some degree of frequency, but also finds anything else that moves (thought this problem can be mitigated slightly by a well-chosen search radius and
Figure 12: TRUSS system architecture, showing workers outfitted with wearable sensor devices. Risk bubble metaphor reflects parameters of the area around each worker, such as levels of dangerous gases detected by the wearable, and takes into account the tracked positions of other workers, in particular when they are working at height or below others.
blob size threshold). Still, the tracker can not segment multiple people when they occlude each other, causing problems when they separate again and the tracker cannot resolve the path ambiguity.
Figure 13: "Naive" fusion of vision system and wearable pressure sensor, as proof-of-concept.
In [9], Teixeira, et al. use inertial sensors in conjunction with cameras to create correspondences between ambiguous or temporally disparate tracks, developing a distance metric on gait timing events between the signals extracted from the camera and worn accelerometer. However, the cluttered environment of a construction site like the one we were targeting is not conducive to this technique, as there is little observable walking (especially from a sufficient distance to track gait), many continuous occlusions, and long periods of relatively stationary activities (one worker welding in a cluttered area, or two workers on a lift, for example).
However, in the environment of our test and in many similar scenarios, workers are often ascending and descending on lifts and ladders in cramped spaces where there is little opportunity to move radially towards the wall-mounted cameras. This
suggests that a fusion between the pressure-based altitude sensor and the camera tracker could recover worker ID after track ambiguities. This fusion would take a
small step towards solving the larger correspondence problem by re-identifying workers on occasion, and at the very least, this information could be used to weed out spurious tracks. Of course, this kind of fusion approach fails when non-instrumented workers work closely amongst non-instrumented ones, or if the workers are at the same height, but the system can subsequently recover. In this scheme, the tracker fuses three pieces of information: the number of workers in the field of view (extracted from the radio signal strength), the altitudes of each worker provided by their wearable pressure sensors, and the estimated height of each image blob.
The approach to this fusion taken in the first deployment, illustrated in Figure 13, is a simple flowchart-based algorithm that performs logical and naive nearest-neighbor operations on the signals from each sensing pipeline. While this approach is certainly not the optimal one, it is intended as a test of the data correspondence in the prototype system. Under the conditions described above, the system can reject spurious tracks caused by moving equipment and shadows, as well as identify multiple workers in a scene after the tracker's state has been cleared.
In general, the fusion approach seeks to extract state that is shared between the sensor signals. In our tests, detailed in chapter six, systemic and sensing challenges precluded the use of the other wearable sensing modalities in most cases, though there are clear avenues for fusion in future work. This kind of thinking can expand to include fusion between microphones (audio levels) on workers and in the infrastructure (building on [7] and [8]), inertial sensors and cameras (as in [9] and
[10]), or new radiolocation strategies that could, together with a vision tracker,
sensor system base stalons: Intel Atorn N450 3 Cameras 2 nerrrroon Fd soaorerrtric
ght lee & qualy
Darutc pressu
volarde rogeras
dust / pwrouates
Zg8ee sra
warabes:
3-axis accromeer ozone moe
2-axA gyloscope 3-are rupress. p. lght lv & quaRy Doromeir pressure Sofeo osu o St ys
hydrcaronsSensors for Constuctlon Site Safety
agmo / Prhuais respcnewr swkosnnris gr I mit mud. lo
ZgIBOB radoII
Figure 14: First version of the worker safety interface, showing unstitched video and altitude thresholds on each worker; when a worker passes the threshold set on the pressure sensor, the correspondinq blob is marked in red.
3.3.3 Interface to Safety Context Through Augmented Video
This section presents a real-time risk assessment interface for remote safety managers that combines sensors from multiple sources to better communicate the changing context around each worker. The software interface augments video of workers on the construction site with information from their wearable sensor nodes, and allows users to set thresholds and priorities on single data streams or combinations of streams. Sketched in Figure 12, this person-centric information architecture imagines a worker safety bubble metaphor, where a sphere of some variable radius encloses a worker's local context, and highlights the intersection of that context with others.
![Figure 4: From left: Ren6 Magritte, "The Blank Cheque" (1965, oil on canvas) [National Gallery of Art, Washington, D.C.], and Michelangelo Pistoletto, "The Visitors" (1962-1968, figures painted on tissue](https://thumb-eu.123doks.com/thumbv2/123doknet/14157064.472707/33.918.129.777.110.539/figure-magritte-national-gallery-washington-michelangelo-pistoletto-visitors.webp)