Publisher’s version / Version de l'éditeur:
Vous avez des questions? Nous pouvons vous aider. Pour communiquer directement avec un auteur, consultez la première page de la revue dans laquelle son article a été publié afin de trouver ses coordonnées. Si vous n’arrivez pas à les repérer, communiquez avec nous à PublicationsArchive-ArchivesPublications@nrc-cnrc.gc.ca.
Questions? Contact the NRC Publications Archive team at
PublicationsArchive-ArchivesPublications@nrc-cnrc.gc.ca. If you wish to email the authors directly, please see the first page of the publication for their contact information.
https://publications-cnrc.canada.ca/fra/droits
L’accès à ce site Web et l’utilisation de son contenu sont assujettis aux conditions présentées dans le site LISEZ CES CONDITIONS ATTENTIVEMENT AVANT D’UTILISER CE SITE WEB.
IABMAS 2010: Bridge Maintenance, Safety, Management and Life-Cycle
Optimization: 11 July 2010, Philadelphia, USA [Proceedings], pp. 1-7, 2010-07-11
READ THESE TERMS AND CONDITIONS CAREFULLY BEFORE USING THIS WEBSITE. https://nrc-publications.canada.ca/eng/copyright
NRC Publications Archive Record / Notice des Archives des publications du CNRC :
https://nrc-publications.canada.ca/eng/view/object/?id=02be4265-a869-41ae-ad9d-9c9ec3eda9db https://publications-cnrc.canada.ca/fra/voir/objet/?id=02be4265-a869-41ae-ad9d-9c9ec3eda9db
NRC Publications Archive
Archives des publications du CNRC
This publication could be one of several versions: author’s original, accepted manuscript or the publisher’s version. / La version de cette publication peut être l’une des suivantes : la version prépublication de l’auteur, la version acceptée du manuscrit ou la version de l’éditeur.
Access and use of this website and the material on it are subject to the Terms and Conditions set forth at Towards sustainable design of highway bridges
http://www.nrc-cnrc.gc.ca/irc
T ow a rds sust a ina ble de sign of highw a y bridge s
N R C C - 5 3 2 2 5
L o u n i s , Z . ; D a i g l e , L .
J u l y 2 0 1 0
A version of this document is published in / Une version de ce document se trouve dans: IABMAS 2010 - Bridge Maintenance, Safety, Management and Life-Cycle Optimization, Philadelphia, USA, July 11-14, 2010, pp. 1-7
The material in this document is covered by the provisions of the Copyright Act, by Canadian laws, policies, regulations and international agreements. Such provisions serve to identify the information source and, in specific instances, to prohibit reproduction of materials without written permission. For more information visit http://laws.justice.gc.ca/en/showtdm/cs/C-42
Les renseignements dans ce document sont protégés par la Loi sur le droit d'auteur, par les lois, les politiques et les règlements du Canada et des accords internationaux. Ces dispositions permettent d'identifier la source de l'information et, dans certains cas, d'interdire la copie de documents sans permission écrite. Pour obtenir de plus amples renseignements : http://lois.justice.gc.ca/fr/showtdm/cs/C-42
1 INTRODUCTION 1.1 General
Highway bridges provide a core public service and are needed for a very long time to support the sus-tainable development of neighbouring communities. They are critical links in Canada’s transportation network that should be kept safe and functional dur-ing their service lives to enable personal mobility and transport of goods to support the economy and ensure high quality of life. The average service lives of these assets vary from 50 years up to 100 years, which are continually extended by using different management strategies that include different combi-nations of preservation, rehabilitation, strengthening, replacement, mitigation and adaptation actions. 1.2 Management practices
Bridge management can be defined as a systematic process of operating, maintaining, upgrading and expanding physical assets effectively throughout their life cycles. It combines engineering principles with sound business practice and economic theory for resources allocation and utilization. The actual bridge management problem can be defined as a multi-objective optimization problem in which the decision maker is seeking to select the best decisions that achieve the best trade-offs between different competing objectives, such as maximizing public
safety, minimizing environmental impacts, maximiz-ing the levels of services and minimizmaximiz-ing the life cy-cle costs. However, most of the current decision-making approaches and bridge management systems are based on the optimization of a single objective, namely the minimization of life cycle costs. The state-of-art approaches to asset management have focused primarily on three objectives, namely: (i) preserving the physical condition of assets; (ii) en-suring acceptable levels of services (e.g. mobility); and (iii) minimizing the life cycle costs. It is clear that limited or no consideration has been given to assessing the life cycle or “cradle to grave” impacts on the environment and the society that result from the construction, operation, maintenance, failure, and replacement of bridge assets. Furthermore, there is also a need to assess the life cycle impacts on the environment of the service provided by these assets, such as vehicle emissions, impacts on environment due to traffic disruption, etc. The implementation of effective sustainable asset management approaches requires the development of approaches that can predict the performance of bridges and the service they provided with regard to society, economy and environment over their life cycles using appropriate performance measures.
The implementation of sustainability principles in asset management decisions and activities has be-come a “need or a necessity” rather than a “desire” to curb the consumption and emissions, protect the
Towards sustainable design of highway bridges
Z. Lounis & L. Daigle
National Research Council, Ottawa, Canada
ABSTRACT: The design and preservation of bridges have been driven, for a long time, by the concerns to minimize costs and improve asset condition. The growing concerns for environmental protection and the shift towards achieving sustainable transportation infrastructure are now requiring the use of approaches that seek to achieve an adequate balance between social, economic and environmental performance over the entire life cycle of the bridge. This paper discusses some performance indicators, such as safety, serviceability, costs, traffic disruption, greenhouse gas emissions, which can be used for life cycle design of highway bridges. An example, taken from the North American context, illustrates how different design and rehabilita-tion approaches can contribute to achieve the desirable balance between social, economic and environmental sustainability criteria.
environment and improve the efforts towards social equity and social progress. This concept has gained momentum and consensus since the publication of the Brundtland commission report (1987) in which sustainable development was first coined and de-fined as a “development that meets the needs of cur-rent generation without compromising the ability of future generations to meet their own needs.”
2 KEY CONCEPTS AND APPROACH TO SUSTAINABLE DESIGN OF BRIDGES
2.1 Sustainability objectives and indicators
Seven key objectives: public safety, public health, public security, mobility, environment quality, so-cial equity and the economy, against which the per-formance of public assets is assessed, are identified in a Model Framework for the assessment of public infrastructure performance (NRTSI/NRC 2009). These objectives derive from the so-called “Triple Bottom Line” evaluation approach or pillars of sus-tainability, i.e. social equity, environmental protec-tion, and economic prosperity. For each of these ob-jectives, several assessment criteria or performance indicators are provided to measure the performance of the asset towards reaching the objective. The se-lection of specific performance indicators or com-pleteness of assessment will depend on many fac-tors, namely (not exclusively):
• Availability of data.
• Size and scope of project.
• Relevance of pursuing particular objectives due to nature or context of the project.
• Use of governing criteria for social, economic and environmental sustainability.
The selected performance indicators should pro-vide a “fair” picture of the performance of the asset throughout its life cycle, including an estimate of the uncertainty associated with the future values of per-formance indicators
The following example illustrates the use of se-lected performance indicators to make a comparative evaluation of two rehabilitation alternatives in terms of their economic, social and environmental performance over the life cycle of reinforced con-crete (RC) highway bridge decks.
2.2 Service life prediction
Highway bridges age and deteriorate with time, which require different preservation actions over their service lives to ensure that they perform as re-quired. The life cycle of a bridge should not be con-fused with its service life. The life cycle can be
de-fined as the time period over which the cost or environmental impact are assessed, while the service life is the time over which the asset deteriorates and reaches a maximum level of damage or minimum performance level, which is referred to as a limit state, which can indicate unacceptable safety or ser-viceability of the asset, as shown in Figure1. The service life can also be defined as the time when the service provided by the highway bridge reaches a minimum acceptable level. Bridge deterioration shown on Figure 1 is due to wear and tear cumula-tive damage and does not include random shock-induced damage.
Figure 1. Bridge life cycle performance.
The knowledge of the service life of a bridge is required before undertaking a life cycle cost analy-sis, a life cycle environmental impact or life cycle social impact assessment (Fig. 2). The prediction of the deterioration or service life of a bridge require models that can forecast its future condition taking into account all the factors that contribute to its deg-radation.
Figure 2. Service life prediction input in sustainable manage-ment approach.
3 ILLUSTRATIVE EXAMPLE 3.1 General
The long-term efficiency of high performance con-crete (HPC) containing supplementary cementing materials (SCM) for the construction and
rehabilita-Service Life Prediction
Sustainable Life Cycle-Based Design Social Impact Assessment
Environmental Impact Assessment Life Cycle Cost Analysis
Time (years) P er for ma nc e Life cycle Residual life Limit state/ acceptable minimum performance Service life 1 Deterioration Repair/Rehab/Replace Service life 2
tion of concrete bridge decks is evaluated and com-pared to that of normal performance concrete (NPC) in terms of service life, life cycle cost, environ-mental impacts and social impacts. SCMs are re-claimed industrial by-products that improve concrete physical performance and extend the service life of RC structures as a result of concrete reduced perme-ability.
The HPC deck contains 25% of fly ash and has a 28-day compressive strength of 45 MPa. The NPC deck water/cement ratio of 0.4 is associated to a 28-day compressive strength of 30 MPa. The rein-forcement consists of #10M conventional black steel rebars with a yield strength of 400 MPa for both al-ternatives. Dimensions and traffic data are presented in Table 1 (Lounis & Daigle 2008).
Table 1. General information on highway bridge example.
Bridge width 12.57 m
Bridge length 47.5 m
Deck thickness 225 mm
Isotropic reinforcement percentage for both mats 0.3%
Annual Average Daily Traffic (AADT) 22000
Annual Average Daily Truck Traffic (AADTT) 4500
Normal traffic speed (km/hr) 100
3.2 Service life
In North America, the extensive deterioration of highway bridge deck is mainly caused by chloride-induced corrosion of the reinforcement. The primary source of chlorides derives from deicing salts ap-plied to roadways and bridges during winter. Given this predominant deterioration mechanism, most RC bridge deck failures are due to loss of serviceability and functionality and not loss of strength and col-lapse.
The service life of the RC deck built in a corro-sive environment is obtained using reliability-based analytical models that predict the time it will take before chloride ingress and subsequent corrosion-induced damage mechanisms reduce the serviceabil-ity of the deck to an unacceptable level. These mod-els, based on a reliability approach, take into ac-count the variability of the main physical parameters and the different types of uncertainties associated with the modeling of complex processes.
The time estimation of chloride ingress into con-crete cover is modeled using Crank's (1975) solution of Fick's second law of diffusion, which is given by:
(1) where C (x,t) = chloride concentration at depth x after time t; Cs = chloride concentration at the deck
surface; Dc = coefficient of diffusion of chloride
ions into concrete; and erf = error function. The time to corrosion initiation (ti) is estimated by
re-placing, in Equation 1, the chloride concentration (C) with a chloride threshold value (Cth) or chloride
concentration at which corrosion initiation is ex-pected to occur, and the variable x (the depth from the surface) with the effective cover depth (c) of the reinforcing steel. Equation 1 than becomes:
(2)
In this chloride contamination model, both the dif-fusion coefficient Dc and the surface concentration
Cs are assumed to be constant in space and time.
Times to reach different limit states of corrosion-induced damage (internal cracking, surface cracking, spalling, delamination) are estimated based on the thick-wall cylinder model (Timoshenko 1956). This model allows the calculation of the rebar diameter increase related to the different corrosion-induced damage limit states. Complete development of the thick-wall cylinder equations as applied to the dif-ferent limit states of reinforced concrete deteriora-tion is presented in Lounis et al. (2006). Chloride ingress and corrosion-induced damage models with associated corrosion propagation time are described in more in details in Lounis & Daigle (2008).
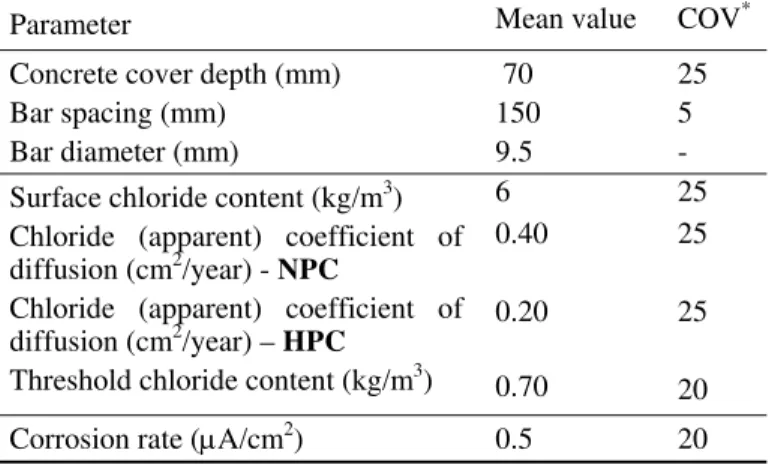
For this example, it is considered that the end of service life or serviceability limit sate of RC decks in corrosive environments is reached when an esti-mated 30% of the deck area is spalled. Using the models briefly described above, it is estimated that this condition is reached after 22 years for the NPC deck and after 40 years for the HPC deck. The data for the service life parameters of both replacement alternatives are given in Table 2.
Table 2. Service life parameters.
Parameter Mean value COV*
Concrete cover depth (mm) Bar spacing (mm) Bar diameter (mm) 70 150 9.5 25 5 - Surface chloride content (kg/m3)
Chloride (apparent) coefficient of diffusion (cm2/year) - NPC
Chloride (apparent) coefficient of diffusion (cm2/year) – HPC
Threshold chloride content (kg/m3) 6 0.40 0.20 0.70 25 25 25 20 Corrosion rate (μA/cm2
) 0.5 20
* COV = coefficient of variation (%)
( )
⎥ ⎥ ⎦ ⎤ ⎢ ⎢ ⎣ ⎡ ⎟ ⎟ ⎠ ⎞ ⎜ ⎜ ⎝ ⎛ − = t D x erf C t x C c s 2 1 , 2 1 2 1 4 ⎥ ⎥ ⎦ ⎤ ⎢ ⎢ ⎣ ⎡ ⎟⎟ ⎠ ⎞ ⎜⎜ ⎝ ⎛ − = − s th c i C C erf D c t3.3 Performance indicators
A limited number of performance indicators are chosen to illustrate the proposed approach to sus-tainable design, which include:
• Economy: life cycle agency costs and life cy-cle user costs.
• Environment: CO2 emissions and volume of
construction waste materials.
• Social: Accident cost and traffic congestion. Accident cost is used in this example as an indica-tor of social impact as these costs are mainly cov-ered by insurance premiums (material damages) and health services paid for by a large portion of the so-ciety. Traffic congestion is a problem that directly and indirectly affects all three pillars of sustainabil-ity and it is directly or implicitly considered in the following analyses. Time lost by drivers has an im-pact on the economy, especially for those whose jobs include a period of driving. Traffic congestion also contributes to an increase in CO2 emissions and
finally traffic congestion affects people quality of life (traffic delays for extended period of time). 3.4 Measures of economic performance
The analysis time period (or life cycle) is taken as 40 years and the discount rate used is 3%. The com-ponents of the agency or owner’s costs include la-bour, equipment, material, etc. of the initial con-struction and all required maintenance, repair, rehabilitation and replacement (MR&R) activities throughout the bridge deck life cycle. The initial construction costs (in-place costs for the steel and concrete mixes) of the two alternatives are presented in Table 3. Additional construction costs are not specified for the two alternatives as they are consid-ered to be approximately the same. Figure 3 summa-rizes the timing and costs of the different MR&R activities of both alternatives. The cost and time data presented in this example are taken from various sources referenced in Lounis & Daigle (2008) or as-sumed. The cost of the patch repairs includes:
• Cost of removing the contaminated or deterio-rated concrete.
• Cost of concrete patching.
• Cost of traffic control when the bridge is par-tially opened to traffic.
Table 3. In-place costs of materials.
Material Unit Cost
Normal concrete (NPC) 460 ($/m3)
High performance concrete (HPC) 520 ($/m3) Conventional (“black”) steel 1.80 ($/kg)
In this example, patch repairs are made when the deck spalling area reaches 10% and 20%. Times cor-responding to these damage states are predicted us-ing the reliability-based service life models men-tioned above. It is assumed that after 22 years, the damaged NPC deck is replaced with a similar type of deck (i.e. normal concrete with black steel rein-forcement in both top and bottom mats). The re-placement cost includes the initial construction cost and the costs of demolition and disposal that were assumed equal to $70/m2. Since the end of life of the HPC deck is equal to the analysis period, its re-placement is not included in the life cycle cost analysis (LCCA). At the end of the analysis period, the HPC alternative will have no residual service life or value whereas the NPC deck will have a four-year residual life and a residual value calculated as 18% (remaining service life over predicted service life) of the replacement cost. For the NPC alternative, the schedules of MR&R activities for the deck replace-ment (year 22 and after) are similar to those of the initial deck construction (up to year 22).
Figure 3.Costs and schedule MR&R activities for NPC and HPC decks over life cycle.
Users costs considered in this example include cost incurred by the users of the bridge (lost driver’s time and increased vehicle operating costs) due to traffic delay caused by MR&R activities. Duration of each (MR&R) activity (average for both ways),
(
)
T v T t t i i r R r t C C PVLCC i i − + + + =∑
= (1 ) 1 ) ( 1 0length of affected road during the activity (average for both ways), and reduced traffic speed during the activity (Table 4) are used to estimate life cycle user costs. These values are considered to be the same for both deck alternatives except for the replacement, which is used only on the NPC deck. The different unit or hourly user costs are found in Table 5. De-tails on user cost estimation are found in Daigle & Lounis (2006).
Table 4. Data related to user cost estimation.
Activities Duration (days) Length af-fected (km) Traffic speed reduced to (km/hr) Routine inspection 0.35 0.1 80 Detailed inspec-tion 0.5 0.5 50 Asphalt overlay 1.5 1 40 Patch repair 2.5 1 30 Replacement 15 1 30
Table 5. Unit user costs.
Average value of driver’s time ($/hr) Car
Truck
12 20 Vehicle operating cost ($/hr)
Car Truck
8.85 8.85
Figure 4 illustrates the results of the life cycle cost analysis (LCCA) that was evaluated using the pre-sent value life cycle cost (PVLCC) approach de-tailed in Equation 3 (Hawk 2003):
(3)
where C0 = Initial construction cost (including
de-sign costs); Ci(ti) = ith expenditure at time ti (e.g.
in-spection, maintenance, repair, demolition, disposal, etc.); r = discount rate; T = life cycle; and Rv =
re-sidual (or salvage) value at the end of the life cycle.
Figure 4.Costs and schedule MRR activities for NPC and HPC decks over life cycle.
The difference between the agency and user life cycle costs of the two alternatives favours the use of the HPC deck as there is a reduction of 20% and 70% in these costs, respectively. When based only on initial (partial) construction costs, the NPC deck alternative would seem to be a slightly better choice. 3.5 Measures of environmental performance
Environmental impacts, in terms of greenhouse gas emissions and waste production are estimated for all activities occurring during the life cycle of both concrete deck alternatives as outlined in the eco-nomic performance analysis. Pertaining to the pro-duction of CO2 emissions, these estimates include
the major components that illustrate the difference between the two alternatives, namely: (i) cement production; (ii) additional transportation needed for the SCMs included in the HPC mix; and (iii) CO2
emitted by cars/trucks delayed by the maintenance, repair, and replacement activities. The CO2 released
by the production of reinforcing steel is not ac-counted but would typically be the same for both deck alternatives. In this example, it is found that the CO2 emissions for the normal concrete deck
alterna-tive are almost three times higher than those of the HPC deck alternative (Fig. 5). This difference is mainly due to the lower cement consumption of the HPC mix that uses supplementary cementing mate-rials as a replacement material for a portion of the cement. The shorter service life of the normal con-crete deck, which leads to an increase in traffic dis-ruption due to earlier replacement, also accounts for the higher CO2 emissions of the NPC deck.
Figure 5. CO2 emissions within life cycles of bridge decks.
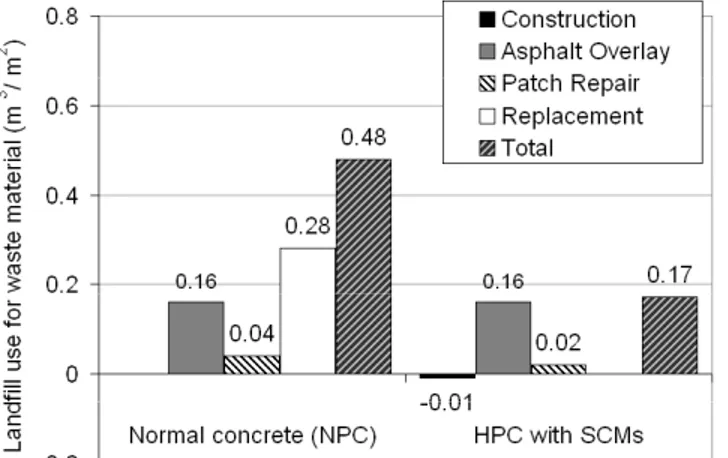
A comparison of the waste produced (or landfill use) for the two deck alternatives is shown in Figure 6, which includes the volume of waste material pro-duced during the replacement of asphalt overlay, patch repairs, and replacement.
Figure 6. Volume of construction waste materials from HPC and NPC bridge decks.
3.6 Measures of social performance
Average accident costs and the normal accident rate are taken from statistics published by Transport Canada (1994, 2006) and Statistics Canada (2003). Considering the lack of statistical data on accident in work zones, a rule of thumb of three times the nor-mal accident rates is used as suggested by Walls & Smith (1998). Data taken for this example are pre-sented in Table 6.
Table 6. Accident rates and cost. Normal accident rate
(/million vehicle * km) 2.1
Accident rate during MR&R activities
(/million vehicle * km) 6.0
Average accident cost ($) 33000
Figure 7 shows the accident cost per deck area for both deck alternatives, as well as the total time lost by drivers due MR&R activities. As for environ-mental impacts, the shorter service life of the NPC deck and its required replacement after 22 years, which causes an increase in traffic disruption, greatly affect the social performance of the NPC deck.
Figure 7. Social impacts - Accident unit cost and time lost for NPC and HPC deck alternatives.
4 COMMENTS AND CONCLUSIONS
In this paper, it is shown that the implementation of life cycle-based design and maintenance manage-ment approaches would lead to the construction of high performance highway bridges with reduced en-vironmental footprints and social pressure. The use of HPC materials results in bridge decks with ex-tended service lives, reduced life cycle costs, and better environmental and social profiles when com-pared to conventional normal concrete bridge decks. From the example above, the following conclusions can be drawn:
• In terms of durability, the HPC deck alternative incorporating SCMs has a service life that is almost twice as long as the service life of nor-mal concrete deck.
• In terms of life cycle costs, the HPC deck alter-native is found to be more economic than the normal concrete deck for both agency costs and user costs.
• In terms of environmental impact, it is estimated that the HPC deck alternative yields a reduction of 65% in the CO2 emissions compared to the
normal concrete deck.
• In terms of social impacts, time lost and acci-dent cost associated to the HPC deck alternative are estimated to be less than half of what was estimated for the NPC deck.
The illustrative example presented above extends beyond a conventional economical performance analysis as it includes some social and environ-mental aspects. It is not an exhaustive environenviron-mental impact analysis or a complete analysis of social im-pacts, but it provides some preliminary indications on the influence of selecting an alternative on added environmental burden and social pressure caused by life cycle maintenance, repairs and rehabilitation ac-tivities of the bridge deck. In this particular exam-ple, all the performance measures used indicated that the HPC deck alternative would be a better choice. There is no need to trade off or reach an equitable balance between environment, social and economi-cal. Only on initial construction cost would the NPC bridge deck option perform better, but this informa-tion was only shown for comparative purposes, as initial construction cost is not a suitable indicator for sustainability.
In life cycle performance analysis, the reliable es-timation of service life and associated schedule and extent of MR&R activities is critical. Beyond their significant influence on economic performance, they also drive the results of the social and environmental impacts analysis. For bridges with high level of traf-fic, the social and environmental “costs” of frequent
and/or extended interventions should be taken into consideration to move towards a sustainable ap-proach for the design and management of highway bridges.
REFERENCES
Crank, J. (1975). The Mathematics of Diffusion (2nd ed.), Ox-ford University Press, London.
Daigle, L. & Lounis, Z. (2006). Life cycle cost analysis of high performance concrete bridges considering their environ-mental impacts. INFRA 2006 Conf. - Quebec City, No-vember 20, 2006.
Hawk, H. (2003). Bridge Life-Cycle Cost Analysis. NCHRP Report 483, Transportation Research Board, Washington, D.C.
Lounis, Z., Martin-Perez, B., Daigle, L.& Zhang, J. (2006). Decision Support Tools for Service Life Prediction and Rehabilitation of Concrete Bridge Decks - Final Report, National Research Council Canada (B5318.2), 260 p. Lounis, Z. & Daigle, L. (2008). Reliability-based decision
support tool for life cycle design and management of high-way bridge decks. Annual Conf. of the Trans. Assoc. of Canada (TAC) (Toronto, Ontario, 2008-09-21), pp. 1-19. NRTSI/NRC (2009). Model Framework for the Assessment of
Sate , Performance and Management of Canada’s Core Public Infrastructure. National Round Table for Sustain-able Infrastructure and National Research Council (Can-ada).
Statistics Canada (2003). Canadian Vehicle Survey, Cat. No. 53-223-XIE.
Timoshenko, S.P. (1956). Strength of Materials. Part II:
Ad-vanced Theory and Problems, Princeton, NJ.
Transport Canada (2006). Road Safety in Canada – 2003. TP 13951E.
Transport Canada (1994). Guide to Benefit-Cost Analysis in Transport Canada. TP11875E
Walls, J., and Smith, M.R. (1998). Life Cycle Cost Analysis in
Pavement Design. Interim Technical Bulletin, Publication No. FHWA-SA-98-079, 107 p
World Commission on Environment and Development (WCED) (1987). Our Common Future. Oxford University Press, NY.