Publisher’s version / Version de l'éditeur:
ECS Transactions, 35, 34, pp. 259-269, 2011-05-06
READ THESE TERMS AND CONDITIONS CAREFULLY BEFORE USING THIS WEBSITE.
https://nrc-publications.canada.ca/eng/copyright
Vous avez des questions? Nous pouvons vous aider. Pour communiquer directement avec un auteur, consultez la
première page de la revue dans laquelle son article a été publié afin de trouver ses coordonnées. Si vous n’arrivez pas à les repérer, communiquez avec nous à [email protected].
Questions? Contact the NRC Publications Archive team at
[email protected]. If you wish to email the authors directly, please see the first page of the publication for their contact information.
This publication could be one of several versions: author’s original, accepted manuscript or the publisher’s version. / La version de cette publication peut être l’une des suivantes : la version prépublication de l’auteur, la version acceptée du manuscrit ou la version de l’éditeur.
For the publisher’s version, please access the DOI link below./ Pour consulter la version de l’éditeur, utilisez le lien DOI ci-dessous.
https://doi.org/10.1149/1.3654224
Access and use of this website and the material on it are subject to the Terms and Conditions set forth at
Analysis of aged polymer electrolyte fuel cell (PEFC) components by
nontraditional methods
Hiesgen, Renate; Wehl, Ines; Helmly, Stefan; Friedrich, K. Andreas;
Schulze, Mathias; Haug, Andrea; Yuan, Xiao-Zi; Wang, Haijiang
https://publications-cnrc.canada.ca/fra/droits
L’accès à ce site Web et l’utilisation de son contenu sont assujettis aux conditions présentées dans le site LISEZ CES CONDITIONS ATTENTIVEMENT AVANT D’UTILISER CE SITE WEB.
NRC Publications Record / Notice d'Archives des publications de CNRC:
https://nrc-publications.canada.ca/eng/view/object/?id=e88ff5d7-7775-4fc9-8a8f-193a8ca96f77 https://publications-cnrc.canada.ca/fra/voir/objet/?id=e88ff5d7-7775-4fc9-8a8f-193a8ca96f77
Analysis of Aged Polymer Electrolyte Fuel Cell (PEFC) Components by Non Traditional Methods
Renate Hiesgena*, Ines Wehla, Stefan Helmlya,b, K. Andreas Friedrichb, Mathias Schulzeb ,
Andrea Haugb, Xiao-Zi Yuanc, Haijiang Wangc
a
University of Applied Sciences Esslingen, Department of Basic Science, Kanalstrasse 33, 73728 Esslingen, Germany
b
Institute of Technical Thermodynamics, German Aerospace Center, Pfaffenwaldring 38-40, 70569 Stuttgart, Germany
c
Institute for Fuel Cell Innovation, National Research Council Canada, Vancouver, BC, Canada V6T 1W5
The ageing of microporous layers (MPL) of fuel cell gas diffusion layers has been quantitavely analyzed using a special atomic force microscopy technique, namely the so-called HarmoniX technique. From the change of mean adhesion force under dry and wet conditions an increased loss of polytetrafluoroethylene (PTFE) at the cathode was found. With ionic current measurement in tapping- and contact mode by AFM, activated Nafion was investigated before fuel cell operation with high resolution and individual ionic channels were imaged in one cluster. These measurements were compared to the current distribution of membranes after 1600 h of fuel cell operation under OCV. Distinct current levels were found which demonstrate the existence of an interpenetrating ionic network with different branches not directly connected at the surface. SEM/EDX investigations of the specially designed fuel cells indicate an important role of platinum in degradation of membranes.
Introduction
The future application of fuel cell technology will mainly depend on the costs of the fuel cell system. There are many factors influencing costs, including mass production and availability/costs of noble metals. One important factor is the life time of fuel cells and of all its components. A decrease of power output or failure due to degradation will directly lead to increase in total cost of ownership of fuel cells. In the recent past numerous degradation Phase Shift PTFE/ Carbon D e g ra dati on C h a nge of com pos it io n Dissipation Bimodal Distribution Phase Shift PTFE/ Carbon D e g ra dati on C h a nge of com pos it io n Dissipation Bimodal Distribution
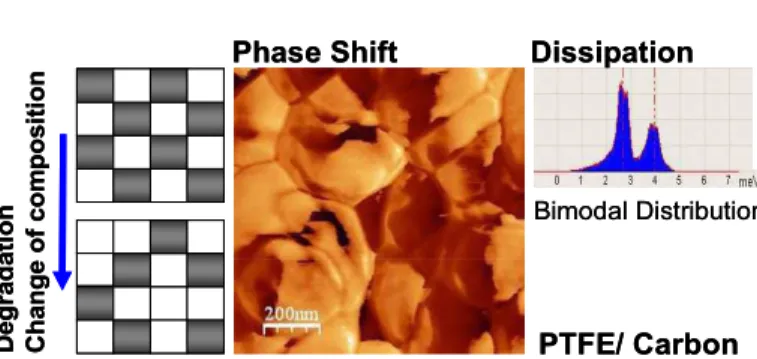
Figure 1 Phase shift image of a microporous layer with PTFE
(bright) and carbon (dark) components. On the right a histogram of the dissipation energy from all points shows a bimodal distribution. A scheme on the left side explained the expected change of surface composition with degradation, detectable by AFM.
mechanisms, some of them complex, have been identified. A main finding by various studies is that operating conditions, e.g. humidity changes of the gases or frequent switches to open circuit voltage (OCV) conditions can affect significantly performance degradation (1). Properties of membranes, electrodes, and gas diffusion layers, or MEAs (membrane-electrode-assemblies) in a polymer-electrolyte-membrane fuel cell (PEMFCs) are to a large extend dependent on the nanoscale structure of the material (2-4). The solid electrolyte membrane is coated on both sides with a porous electrode, consisting of Pt or Pt containing particles of 1-2 nm, PTFE, carbon, and Nafion. They are covered by gas diffusion layers, typically coated with a more dense microporous layer (MPL), mainly consisting of PTFE and carbon, facing the electrodes for regulating the
water and gas transport and providing superior electronic and heat conduc-tivity. The addition of a microporous layer results in significant-ly less degra-dation of the GDL and in a higher PEMFC performance (1). Different methods have been reported for investigating aged GDLs (2), including accelerated lifetime tests and ex situ tests (4-8). Enhanced ageing tests at elevated temperatures or freeze-thaw cycles have been applied for in-situ ageing, whereas exposure to aggressive media, e.g. oxidative ambient conditions with hydrogen peroxide solutions are used for ex situ ageing (4-6). Besides mechanical effects and structural changes one major reason for degradation is a change of wetting behavior and a loss of hydrophobicity. The last effect results in an accumulation of liquid water in the GDL pores and leads to a blocking of these pores for reactant transport. The loss of hydrophobicity is mainly correlated with a loss of PTFE. The importance of chemical decomposition by carbon oxidation is presently unclear. As a result of these changes water transport in the pores is modified and different electronic as well as heat conductivity is observed.
The ionic conductivity of solid electrolyte membranes like i.e. Nafion relies on a nanoscopic phase separation with hydrophobic and hydrophilic domains in the range of 10-50 nm size. The hydrophilic phase forms a proton conductive network in the membrane. The distribution and size of ionically conductive areas on the surface is therefore dependent on the molecular polymer structure. It has been found (13) that the local conductivity of the network and the formation of highly conductive channels are also determined by the current flow and may change the polymeric arrangement depending on the conditions.
Atomic force microscopy (AFM) techniques have proven to be a valuable tool for the investigation of fuel cell components. With AFM the surface topography as well as different properties such as i.e. electronic and ionic conductivity, adhesion force, elasticity, and dissipation energy can be measured and statistically analyzed (9-11). In
Force Adhesion Force Peak Force Dissipation Energy x/nm F/nN Stiffness Surface 0 -+ Adhesion Force Peak Force Dissipation Energy x/nm F/nN Stiffness Surface 0 -+ Peak Force Dissipation Energy x/nm F/nN Stiffness Stiffness Surface 0 -+
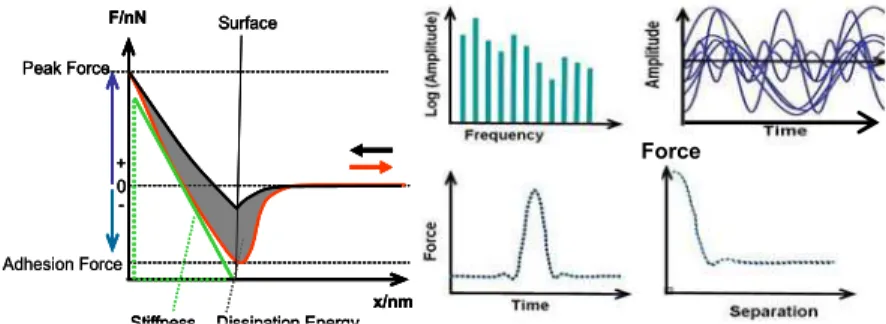
Figure 2 Left side: Force-distance curve of AFM tip with surface properties evaluated by the
measurement; right side: evaluation of the force distance curve by Fourier synthesis of tip vibrations in HarmoniX mode (Bruker Corp.)
this respect, the degradation of the different fuel cell components can also be investigated. AFM has already been successfully applied to the investigation of microporous layers before and after fuel cell operation (11). A microporous layer is a two-component material which mainly consists of carbon and PTFE. Degradation of a MPL is mainly attributed to a loss of hydrophobicity and correlated to the loss of PTFE. As shown in Figure 1 these changes in composition can be detected with an AFM by statistical evaluation of surface properties, e.g. energy dissipation.
Experimental
The AFM measurements have been performed by a commercial AFM system (Bruker Corp., Multimode 8). For the evaluation of mechanical properties two different modi have been applied: the so called “HarmoniX” mode and the PeakForce QNM-Mode (both Bruker Corp.). With HarmoniX a specially formed asymmetric AFM tip is used and from the higher harmonic vibrations of this tip after contact to the sample a force-separation
curve at every image point is reconstructed as shown in Figure 2. Thereby the topography together with images of the distribution of different surface and subsurface properties is measured, like stiffness (elasticity), peak force, energy dissipation, and adhesion force. For recording quantitative data the magnitude of the different forces and the dissipation energy is calibrated before measurement. This mode has been successfully applied to the investigation of microporous layers (11). For the analysis of polymer samples like Nafion the Peak Force Quantitative Nanomechanical Property Mapping (PeakForce QNM™, Bruker Corp.)) is better suited since it uses standard AFM tips with adjusted spring forces, including conductive tips. Here, the tip is vibrating at a fixed frequency and thereby a force distance curve is measured at every contact (image) point and delivers stiffness (elasticity), peak force, energy dissipation, DMT modulus, deformation, adhesion force, and in case of a conductive tip also the current. For current measurements the tip has to be in contact with the surface (Figure 3). In the past current measurements have been mainly performed in contact mode (10). During slow scanning almost steady– state conductivity can be measured. The high lateral forces onto the sample occurring during scanning are disadvantageous for imaging the soft polymer surface and can be avoided by tapping mode. The current measurement is only performed during a comparably short contact time in this case. At the solid electrolyte membranes higher currents than under steady-state conditions are measured since a higher transient current during restoring a new charge/water balance
A Current measurement during contact A A A A Current measurement during contact Force-distance curve at ervery point Force-distance curve at ervery point C u rr en t /n A & Vo lt ag e /V Time /s Current Voltage C u rr en t /n A & Vo lt ag e /V Time /s Current Voltage
Figure 3 Measurement of force-distance curves in
PeakForce QNM mode (Bruker Corp.) without (left) and with (right) conductive tip for current measurement at contact.
Figure 4 Current after voltage pulse
from 0 V to 1.5 V at activated Nafion 112.
after voltage changes occurs (Figure 4). This has to be taken into account if quantitative currents are compared. For current measurements with high resolution a further development of this technique, the PeakForce-TUNA mode (BrukerCorp.) has been applied, where the use of adapted software for current evaluation and an internal lock-in-amplifier together with a broad bandwidth current-voltage lock-in-amplifier delivers current measurements with minimal sample distortion.
Gas diffusion layers For monitoring the degradation of MPL besides topography adhesion force and energy dissipation are analyzed in detail. AFM images between 10 µm and 0.3 µm length were measured. The relative frequency of occurrence of adhesion force and dissipation energy was calculated from all recorded images and the peak values were statistically evaluated. For a sufficient confidence level a mean value (including
error bars) was calculated from several images measured under the same conditions. Most of the AFM measurements have been performed under ambient conditions at room
temperature and a relative humidity (rh) of about 30-40 % (labelled as “ambient”). Some
measurements (labelled as “wet”) have been performed after rinsing the sample in ultra pure water and carefully removing excess liquid water by absorbent paper. The model samples have been prepared as layers from a liquid consisting mainly of dispersed PTFE (Dyneon TF 5032 Z, 3M), and carbon Ensaco 250 G (TIMCAL) with different percentage of PTFE and have a comparable roughness to the commercial MPL. In Figure 5 the linear dependence of adhesion force and dissipation energy with PTFE content is visible and under ambient condition a change of adhesion force of 0.55 nN/%PTFE was calculated. The commercial gas diffusion layer SGL Sigracet 25 BC has been operated in a fuel cell test stand for 650 h at 60 °C, a mean current density of 600
Topography 80 wt% PTFE
Dissipation Energy
ǻEimage=0.002 meV
40 wt% PTFE 80 wt% PTFE 0 5 10 15 20 25 40% 60% 80% PTFE content Peak Va lu e A dh esion For ce /nN Di ss ipa tion Energ y /meV*10^4 Adhesion Force Dissipation Energy Topography 80 wt% PTFE Dissipation Energy
ǻEimage=0.002 meV
40 wt% PTFE 80 wt% PTFE 0 5 10 15 20 25 40% 60% 80% PTFE content Peak Va lu e A dh esion For ce /nN Di ss ipa tion Energ y /meV*10^4 Adhesion Force Dissipation Energy
Figure 5 Change of adhesion force and dissipation energy of samples with a defined PTE/carbon
composition. Image at top shows the topography of a sample with 80% PTFE, images at middle and bottom show the distribution of dissipation energy of a 40 %PTFE containing and 80% containing PTFE sample, respectively.
I
U
Anode: 2 H2O O2+ 4H++ 4 e
-Porous back electrode Cathode: O2+ 4H++ 4 e- 4 H2O Membrane GDL Platinum sheet AFM-Tip I U Anode: 2 H2O O2+ 4H++ 4 e -Anode: 2 H2O O2+ 4H++ 4 e
-Porous back electrode Cathode: O2+ 4H++ 4 e- 4 H2O Cathode: O2+ 4H++ 4 e- 4 H2O Membrane GDL Platinum sheet AFM-Tip
Figure 6 Measurement of ionic current at polymer
mA/cm2 (area 100 cm2), ȜH2=1.5 and rh=66 %, Ȝair=2 and rh=42 % at atmospheric
pressure without regulation. After operation the GDL was carefully removed from the MEA to keep the microporosity intact.
Polymer-Electrolyte Membranes
Before measurement the unused electrolyte membranes were coated with an extended porous back electrode containing platinum. For an AFM measurement after fuel cell operation the different layers of the fuel cell were carefully separated by hand. Prior to measurement the membranes have been activated in an electrolysis operation for 1-3 h at 2.3 V (13). The activated and humidified electrolyte membranes were mounted onto a porous conductive hydrophilic GDL layer and placed onto a conductive platinum sheet (Figure 6). The measurements were performed in an environmental chamber to further control humidity and temperature. For the investigation of membrane conductivity a platinum coated tip was used for catalyzing the electrochemical reaction at the tip. A voltage exceeding 1.3 V has been applied between back electrode and tip. The current flow through the membrane is enabled by the electrochemical reactions at the interfaces. The AFM tip is used as a nano-electrode at the otherwise bare membrane surface. During current flow water is on one hand transported from the back electrode to the surface by the electroosmotic drag of the proton current and on the other hand produced at the membrane surface by the reaction. Analysis was performed at or close to room temperature.
4-Cell-Stack
For operating a fuel cell the membrane is coated with an electrode, at least they are pressed together to provide a close contact. For the investigation with AFM the analyzed membrane surface has to be definitively free of platinum, to be sure that the measured current is a property of the membrane only. In order to analyze electrolyte membranes after fuel cell operation a stack was prepared
where each membrane
was assembled by
two identical one-sided CCMs (which means one side coated with catalyst and the other side bare), with two blank sides joining together. The
four cells were prepared from Nafion N211, Nafion N212, Nafion N115, and
Nafion N117. These MEAs were operated for 1600 h under open circuit conditions (OCV). After operation the double membranes were carefully detached for performing the AFM measurement.
N117 N115 N212 N211 AFM-Measurement at inner interface
A nod e Ca th o d e Electrode Gas diffusion layer Membrane
AFM tip
Electrode Gas diffusion layer Membrane
N117 N115 N212 N211 AFM-Measurement at inner interface
A nod e Ca th o d e Electrode Gas diffusion layer Membrane
AFM tip
Electrode Gas diffusion layer Membrane
Figure 7 Left side: Stack designed for AFM measurement of polymer
electrolyte membranes’ after fuel cell operation with each cell assembled of two half MEAs; right side: Disassembling of MEAS after operation for AFM measurement.
Results and discussion
Microporous Layer of Gas Diffusion layer
From the calibration of PTFE content with adhesion force under dry conditions a change of 0.55 nN per %PTFE has been calculated. AFM measurements with the HarmoniX mode have been performed on the operated MPL. In Figure 8 the adhesion force of a completely wetted sample is compared to the adhesion measured on the same sample, but under comparably dry conditions. While under dry condition the adhesion force had decreased at the anode (calculated decrease of PTFE content about 1%) and even stronger decreased at cathode side (about 2% loss of PTFE), the result is contrary at the wet surface. Here the adhesion force is larger at anode compared to the unused sample and even largest at cathode side. Since under dry conditions the change of adhesion force is directly correlated with the PTFE content a loss of PTFE can be concluded, larger at the cathode than at the anode side. Under wet conditions the source of adhesion force is obviously different from the dry environment. At the wet surface adhesion to a liquid water film is present which dominates the magnitude of adhesion force. The amount of loss of PTFE is correlated to an increase of hydrophilic surface and a subsequent increase of adhesion due to water. An increase of
adhesion force at anode and an even larger increase at cathode compared to the unused sample approve the former conclusion.
Force/nN
new Anode Cathode
15 20 25 30 35 40 wet ambient Force/nN
new Anode Cathode
15 20 25 30 35 40 wet ambient
Figure 8 Change of adhesion force on Nafion
112 after 650 h of operation at anode and cathode, measured with dry and with wet surface.
200 nA
62 nm
62 nm
Ipeak~450 nA Ipeak~200 nA Ipeak~150 nA I~0 nA62 nm
62 nm
62 nm
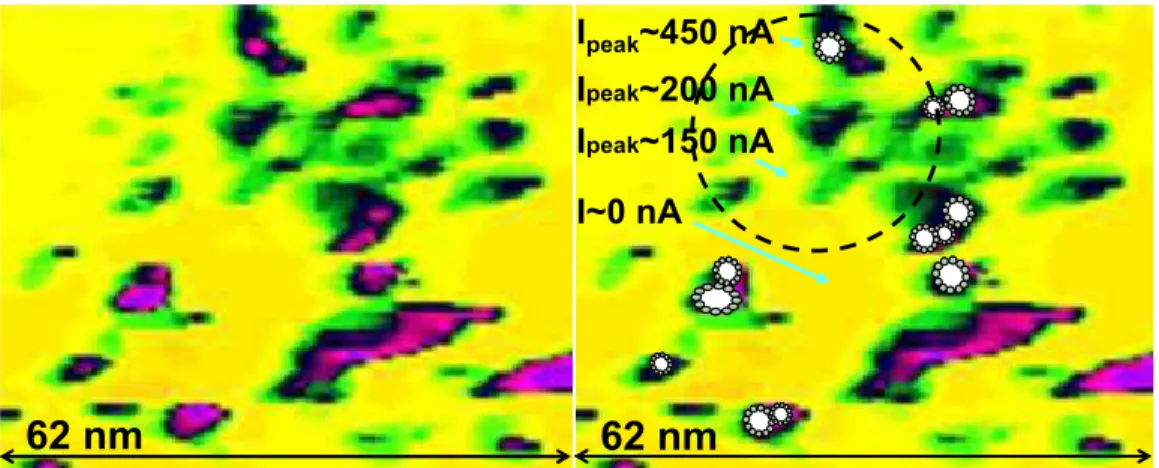
Ipeak~450 nA Ipeak~200 nA Ipeak~150 nA I~0 nAFigure 9 Current image of a 30 nm cluster (circle on the right side) of Nafion 112 composed of
individual conductive spots of 1 nm to 3 nm, measured by QNM TUNA on the left side and with an overlay of inverted micelles.
Nafion Polymer Electrolyte Membrane
The current distribution of an unused and activated Nafion 112 membrane has been measured by tapping PeakForce TUNA mode (Bruker Corp.). In figure 9 the
“Contact Current”, a mean current recorded during contact is shown. On the left side isolated as well as groups of current spots are visible with peak currents of more than 400 nA with a lateral dimension of about 2-5 nm. The current spots are assembled in a group with a diameter of about 30 nm, indicated by the circle in Figure 9 on the right side. Directly around this cluster the current drops to zero. Model calculations based on small
angle x-ray scattering data (SAXS) by Schmidt-Rohr and Chen (14) propose the formation of inverted clusters with a mean diameter of 2.4 nm (between 1.5 nm– 3.5 nm) composed by sulfonic acid groups and stabilized by the polymer back-bones which are filled with water and provide conductive channels for the proton current. These inverted micelles cluster together to form larger assemblies. In Figure 9 (right side) a drawing of some inverted micelles with diameters of 1.8 nm and 3.5 nm are drawn onto the high current spots to demonstrate their dimensions. As can be seen the current spots are composed of only very few or even single inverted micelles. The AFM images allow a direct view into the conductive nano-structure.
Figure 11 PeakForce QNM AFM measurement of Nafion 212
after 1600 h of fuel cell operation under OCV with topography, stiffness and adhesion images.
Anode
Topography Stiffness Adhesion
Cathode
new
Anode
Topography Stiffness Adhesion
Cathode
new
N212
Pt Profile across membrane(s), relative Position
0.0 0.5 1.0 1.5 2.0 2.5 3.0 -1.0 -0.8 -0.6 -0.4 -0.2 0.0 0.2 0.4 0.6 0.8 1.0 Distance from interface
P t / w t% ( n ot n o rm a liz ed ) N212 Anode Cathode Interface
+
-40 ȝm N212
Pt Profile across membrane(s), relative Position
0.0 0.5 1.0 1.5 2.0 2.5 3.0 -1.0 -0.8 -0.6 -0.4 -0.2 0.0 0.2 0.4 0.6 0.8 1.0 Distance from interface
P t / w t% ( n ot n o rm a liz ed ) N212 Anode Cathode Interface
+
-40 ȝm
Figure 10 Left side: SEM image of cross section of MEA from Nafion 212 after 1600 h of operation under
OCV, with initial center visible in the membrane; right side: EDX measurement of platinum content across the membrane.
4-cell –Stack After 1600 h of OCV operation the thinnest cell already failed and a severe degradation of the overall performance has occurred. Since the cells have been mounted from two identical halfs, the initial center can be identified in scanning electron microscopy (SEM) measurements as shown in Figure 10. Due to the degradation of the membranes both halfs have become much thinner. The cathode side thickness has decreased about 50% while the anode thickness has decreased about 25%. With energy dispersive measurements (EDX) platinum could be detected in the whole volume and at cathode side an additional platinum band visible in the SEM image has formed. Although no platinum band is visible at the anode side the measured platinum content analyzed in the middle of this side is even larger than at the position of the visible platinum band. The surface topography of the interfaces of the membranes in all four cells was imaged with PeakForce QNM mode and surface structure, Stiffness, and adhesion forces of Nafion 212 can be compared in Figure 11. After operation the roughness of the surface has increased, there a many holes and fissures while the unused membranes surface is quite uniform. With the use of Harmon (Bruker Corp.) platinum particles could be identified at the interface by their distinct mechanical properties since they differ substantially from the polymer (Figure 12). Especially due to the high peak force and stiffness, the large phase shift due to a high energy loss, a low adhesion force and small
energy dissipation due to their elasticity they can easily be detected. Beside some larger particles of 100 nm size a large number of small particles are present with a diameter
Topography Dissipation Phase Adhesion Peak Force Stiffness Z-Range: 50 nm Z-Range: 300 ° Z-Range: 100 nN
Z-Range: 1 meV
Z-Range: 5 nN Z-Range: 10 GPa Topography Dissipation Phase Adhesion Peak Force Stiffness Z-Range: 50 nm Z-Range: 300 ° Z-Range: 100 nN
Z-Range: 1 meV
Z-Range: 5 nN Z-Range: 10 GPa
Figure 12 HarmoniX AFM measurements of Nafion 212 after
1600 h of fuel cell operation under OCV with topography, phase shift, PeakForce, adhesion, dissipation, and stiffness images
N212 Anode side N211 Anode side N211 Cathode side
1500 nm 115 nm 220 nm
N212 Anode side N211 Anode side N211 Cathode side
1500 nm 115 nm 220 nm
Figure 13 Current images by contact mode AFM of Nafion 212 and Nafion 211after 1600 h of fuel cell
below 10 nm, best visible in the stiffness image of Figure 12. In the literature studies reporting enhanced degradation with platinum can be found (1). Taking this into account we interpret the presence of platinum as a main factor promoting degradation of the
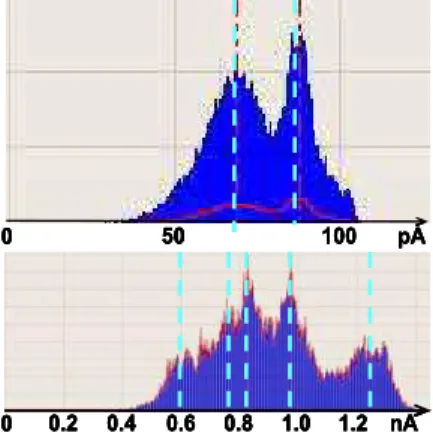
membrane. By AFM current images in contact mode have been performed at the inner interfaces (Figure 13). The conductivity has increased compared to a new membrane since they are fully activated after 1600 h of operation. A large area of the surface is conductive, distinct regions with sharply defined borders exist where a different magnitude of current is measured. They are frequently embedded completely into differently conducting areas. A histogram in Figure 14 of the current distribution exhibits five distinct current peaks in the left image in Figure 13 and two distinct current peaks from the right image of N211 cathode side. The typical cluster size is about 10-30 nm, some smaller current spots of about 3 nm are also present. These conductive areas have the same size as the cluster in figure 9 measured on Nafion before operation, but no internal resolution inside the cluster can be seen here. One explanation could be the formation of a thin water film on the hydrophilic clusters which would prevent further lateral resolution. In contrast, no dragging of water along the surface is visible in the image, which would indicate an extended water layer or excess water production. In addition, the border lines between differently conductive regions are rather sharp and the existence of an extended water layer can be excluded. The absence of a resolution of individual conductive structures, inverted micelles, inside the hydrophilic clusters may indicate that all inverted micelles are highly conductive with about the same conductivity and therefore closely connected below the surface or that they even have merged. The former conclusion is more probable due to the existence of differently conductive areas. A similar observation has been found in conductive networks composed of graphite nanotubes used for heterojunction solar cells and can be explained by some high resistance connection below the surface which determines the resistance of the whole subsequent branch of the network. Areas at the surface with the same current belong to the same conductive part of the interpenetrating network. The pronounced differences in the conductivity membranes are probably caused by the fuel cell operation. As it is known from the activation process (13) by current flow the conductive structure of the ionic network can be changed and highly conductive channels are formed.
Conclusion
By calibration of PTFE loss with change of adhesion force a quantitative measure for the change of PTFE in a MPL surface after fuel cell operation could be calculated. The comparison of adhesion force at anode and cathode after 650 h of fuel cell operation measured under dry and wet conditions deliver a loss of 1% and 2% of PTFE, respectively. While in the absence of a water layer the adhesion force is caused by PTFE, at the wet surface which is covered by a liquid water layer and the adhesion to water dominates. The increase of hydrophilic surface area now leads to an increased adhesion
50 100 0 pA 1.2 0 0.2 0.4 0.6 0.8 1.0 nA 50 100 0 50 100 pA 0 50 100 pA 0 pA 1.2 0 0.2 0.4 0.6 0.8 1.0 1.2 nA 0 0.2 0.4 0.6 0.8 1.0 1.2 nA 0 0.2 0.4 0.6 0.8 1.0 nA
Figure 14 Histogram of current distribution of N211 cathode side and N212 anode side of Figure 13.
force at the anode and an even higher value at the more hydrophilic cathode. The sequence of adhesion strength of the three samples is thereby inversed for wet conditions. An investigation of catalyst free solid electrolyte membranes after fuel cell operation has been accomplished by assembling a full MEA from two half cells. The indication of the initial center of the MEA allowed a direct comparison of membrane loss for the two half cells detected by SEM. The loss of cathode thickness was twice as large as that of the anode side. Inside both parts a large amount of non visible platinum was detected by EDX, besides a visible Pt band at the cathode as typically found in operated fuel cells, especially under OCV or cycling conditions ((1) and references therein). An important role of platinum in the degradation of fuel cell membranes is proposed.
The AFM investigation of Nafion membranes before operation could visualize the internal structure of a conductive cluster composed of individual conductive channels, identified as inverted micelles by comparison with the literature. After fuel cell operation large conductive areas without the detection of an internal structure could be measured. The observation of distinct current levels at the surface could give insight into the subsurface structure. The ionic network consists of different branches which are interpenetrating with no direct connection at the surface. High resistive connections below the surface must be assumed. The loss of internal resolution of on a conductive is assigned to a comparably high conductivity which is probably caused by the high current flow during fuel cell operation.
Acknowledgments
We gratefully acknowledge financial support by the ”Batterie- und Brennstoffzellenallianz Baden-Württemberg (BBA-BW)” and by the Helmholtz-NRC-Project “Durability of PEM Fuel Cells”. We thank Ercan Aslan for the preparation of the PTFE-carbon samples.
References
1. Wu Bi, G.E. Gray, T.F. Fuller, Electrochem. Solid-State Lett., 10 (5), B101-B104 (2007)
2. J.H. Lin, W.H. Chen, S.H. Su, Y.J. Su, T.H. Ko, Energy & Fuels, 22, 2533-2538 (2008).
3. R. N. Carter, T. A. Greszler, D. R. Baker, ECS Transactions, 25 (1) 225-231 (2009).
4. J. Frisk, W. Boand, M. Hicks, M. Kurkowski, R. Atanasoski, A. Schmoekel, 2004, Fuell Cell Seminar San Antonio, TX, USA, November 1-5 (2004). 5. C. Lee, W. Mérida, J. Power Sources, 164 141-153 (2007).
6. M. Oszcipok, D. Riemann, U. Kronenwett, M. Kreideweis, M. Zedda, J.
Power Sources, 145, 407-415 (2005).
7. A. Bazylak, D. Sinton, Z.-S.Liu, N. Djilali, J. Power Sources, 163, 784-792 (2007).
8. M.F. Mathias, J. Roth, J. Fleming, W. Lehnert, Diffusion media materials and
characterisation, Handbook of Fuel Cells – Fundamentals, Technology and Applications, chap. 42, 517-537 (2003).
9. E. Aleksandrova, R. Hiesgen, K.A. Friedrich, E. Roduner, Phys. Chem. Chem.
Phys., 9, 2735-2743 (2007).
10. R. Hiesgen, I. Wehl, E. Aleksandrova, E. Roduner, A. Bauder, K.A. Friedrich,
Int. J. Energy Res., 34 (14) 1223-1238 (2010).
11. K.A. Friedrich, M. Schulze, A. Bauder, R. Hiesgen, I. Wehl, X. Yuan, H. Wang, ECS Transactions, 25 (1) 395-403 (2009).
12. K. Andreas Friedrich, Mathias Schulze , Alexander Bauder, Renate Hiesgen, Ines Wehl, Xiao-Zi Yuan, Haijiang Wang, ECS Transactions, 25 (1) 395-403 (2009).
13. D.G. Sanchez, D.G. Diaz, R. Hiesgen, I. Wehl, K.A. Friedrich, J. Electroanal.
Chem. 649 (2010) 219-231