Vous avez des questions? Nous pouvons vous aider. Pour communiquer directement avec un auteur, consultez la première page de la revue dans laquelle son article a été publié afin de trouver ses coordonnées. Si vous n’arrivez pas à les repérer, communiquez avec nous à [email protected].
Questions? Contact the NRC Publications Archive team at
[email protected]. If you wish to email the authors directly, please see the first page of the publication for their contact information.
https://publications-cnrc.canada.ca/fra/droits
L’accès à ce site Web et l’utilisation de son contenu sont assujettis aux conditions présentées dans le site
LISEZ CES CONDITIONS ATTENTIVEMENT AVANT D’UTILISER CE SITE WEB.
READ THESE TERMS AND CONDITIONS CAREFULLY BEFORE USING THIS WEBSITE. https://nrc-publications.canada.ca/eng/copyright
NRC Publications Archive Record / Notice des Archives des publications du CNRC : https://nrc-publications.canada.ca/eng/view/object/?id=a7f166d4-23b3-4945-89d8-fb14acce4f1a https://publications-cnrc.canada.ca/fra/voir/objet/?id=a7f166d4-23b3-4945-89d8-fb14acce4f1a
NRC Publications Archive
Archives des publications du CNRC
Access and use of this website and the material on it are subject to the Terms and Conditions set forth at
First-year ridge loads on moored offshore structures
OTC 22099
First-year Ridge Loads on Moored Offshore Structures
D. Molyneux, Oceanic Consulting Corporation; A. Derradji-Aouat, National Research Council of Canada; J-M. Cholley, Total E & P
Copyright 2011, Offshore Technology Conference
This paper was prepared for presentation at the Arctic Technology Conference held in Houston, Texas, USA, 7–9 February 2011.
This paper was selected for presentation by an ATC program committee following review of information contained in an abstract submitted by the author(s). Contents of the paper have not been reviewed by the Offshore Technology Conference and are subject to correction by the author(s). The material does not necessarily reflect any position of the Offshore Technology Conference, its officers, or members. Electronic reproduction, distribution, or storage of any part of this paper without the written consent of the Offshore Technology Conference is prohibited. Permission to reproduce in print is restricted to an abstract of not more than 300 words; illustrations may not be copied. The abstract must contain conspicuous acknowledgment of OTC copyright.
Abstract
This paper describes the background, test methodology, experiment program and analytical methods used for a project to predict the peak mooring system loads that occur when a floating offshore structure encounters a first year ice ridge. The project included the construction of simplified physical models of a Spar at 1/30 scale and a Floating Production Unit (FPU) at 1/40 scale. The Spar was a representative structure with a downward breaking cone and a vertical neck designed for operation in ice. A partial spar, consisting of the cone only was also evaluated. The Floating Production Unit (FPU) was a simplified barge. This model was tested with a rigid connection to the towing carriage and also on a representative mooring system that allowed for some compliance. The model FPU was also fitted with two load measuring panels designed to measure local ice loads on the hull.
The methods of producing the model ridges and measuring their physical properties are described. Each model was tested in a range of ridge geometries from temperate to Arctic regions. The experiments were carried out in the ice tank of the National Research Council of Canada’s Institute for Ocean Technology. This paper describes the first phase of experiments on the spar model completed in December 2009 and the first phase of experiments on the FPU completed in June 2010. The paper also presents the description of a parallel numerical approach to the problem, which looks at the methods needed to model the ridge-structure interaction using finite element methods. The results of the simulations and experiments are discussed in general terms.
INTRODUCTION
In the global search for new hydrocarbon deposits, the Arctic is once again receiving a high degree of scrutiny as it is expected that as much as 25% of the world’s undiscovered reserves may be present in northern regions. World-wide demand for this energy has generated pressure to extract these resources, much of which lie beneath the sea bed. This presents a problem for many petroleum industry operators since exploration and production activities in such a harsh environment will require unique solutions to deal with the extremes of cold temperatures and large ice loads. The continuous interest of Total E&P and the engineering companies ( Saipem, Technip, Doris, Entrepose) for the Artic and Sub-Artic regions has lead them to begin a R&D study on the topic “First-year Ridge Loads on Moored Offshore Structures” through a French JIP (CITEPH, 2009). The ice engineering challenges are great for everything that is used in the Arctic, including production equipment, emergency evacuation systems, supply vessels, floating platforms and fixed structures. In fact, even the task of installing infrastructure is more complicated by the harsh conditions found in the Arctic. The continuous interest of Total E&P and the engineering companies (Saipem, Technip, Doris, Entrepose) for the Arctic and Sub-Arctic regions has lead them to begin a R&D study on the topic “First-year Ridge Loads on Moored Offshore Structures” through a French JIP (CITEPH, 2009).
Because the ice-free season is too short for economic exploitation of these resources, given the higher expenses of operating in cold and remote locations, it is necessary to operate with the presence of sea ice around the structure. While these challenges can sometimes seem insurmountable, some very innovative solutions have been developed. For example, early attempts at oil exploration in the Beaufort Sea used modified drilling ships or bottom mounted structures with extensive ice management from icebreaking supply ships.
Much of the new hydrocarbon resources north of 60˚ are found in water too deep for bottom mounted structures. Currently, floating systems are the only realistic option as practical techniques for subsea drilling technology have yet to be developed. The dynamic nature of ice itself places loads on the structure and may force it off its location, in extreme cases these forces create the potential for structural damage. Therefore the current challenge for industry is to provide drilling and production systems that will withstand the forces of the ice at the sea surface.
The objective of the project described in this paper is to develop a design code for the maximum load on an offshore structure due to first-year ridges and rubble ice. The code will apply to geometries such as cylinders and ship-like shapes, which are held in place by moorings or dynamic positioning systems. The project includes model experiments, numerical simulations and a review of analytical methods suitable for predicting ice ridge loads on structures. This paper gives a review of the progress of the project between 2009 and 2010. It is due to be completed in 2011.
SIMPLIFIED OFFSHORE STRUCTURES
Spar
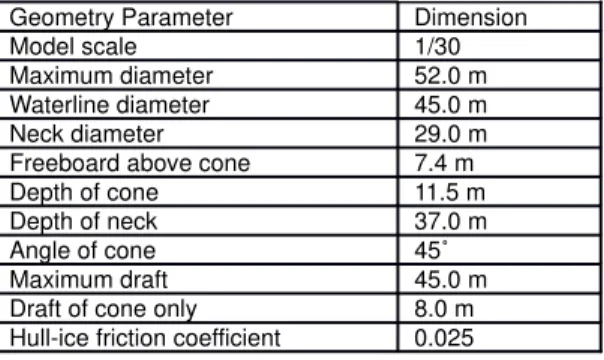
The spar model used for this project represented a simplified structure with a diameter at the waterline of 45 m, which is within the range of recently proposed designs for spars operating ice covered water (Murray & Chang, 2009; Murray et al., 2009). The expected maximum draft for a spar would be of the order of 200 m, but this exceeded the depth of the NRC-IOT ice tank. As a result of this draft restriction, the model was truncated at a draft equivalent to 45 m for the prototype, which was deeper than the region where ice was expected to build up. A sketch photograph of the spar geometry model is shown in Figure 1 and a summary of the dimensions is given in Table 1.
Figure : Sketch of Spar GeometryModel
Table : Geometry of Simplified Spar
Geometry Parameter Dimension
Model scale 1/30
Maximum diameter 52.0 m Waterline diameter 45.0 m Neck diameter 29.0 m Freeboard above cone 7.4 m Depth of cone 11.5 m Depth of neck 37.0 m
Angle of cone 45˚
Maximum draft 45.0 m Draft of cone only 8.0 m Hull-ice friction coefficient 0.025
The cone and the neck portions of the spar were constructed as separate units, and joined together by the load measuring system. The spar model was not buoyant and was free to flood once it was installed in the tank. The draft of the model was set by adjusting the height of the test frame on the towing carriage. The spar model was connected to the carriage by three load cells, measuring horizontal and vertical forces. In addition the spar model was split so that the force acting on the neck could be separated from the force acting on the cone.
The complete spar model (combined cone and neck) was assessed for one speed (1 m/s) at two pitch angles, 0˚ and 8˚, such that the toe of the spar was pointing forwards, to simulate the position of the floating spar under extreme ice loads. This tilt resulted in the slope of the neck being reduced. The cone portion of the spar was tested at two speeds (0.2 m/s and 1.0 m/s), with no tilt angle.
An attempt was made to measure local loads on the front face of the cone using a pressure sensitive panel, but this system failed early in the test program.
The FPU structure was simplified in an effort to try to understand the fundamental forces. The initial model had a 30 degree inclined cylindrical bow, a 45 degree inclined flat stern and rectangular parallel middle body. This bow form had
approximately the same diameter at the waterline as the spar used for the first phase of the project, but with a reduced draft and an increased angle of inclination to the waterline. The second bow shape was constructed from flat plates, with the same inclination angle to the waterline. The FPU was tested bow into the ice ridge, with no drift angle.
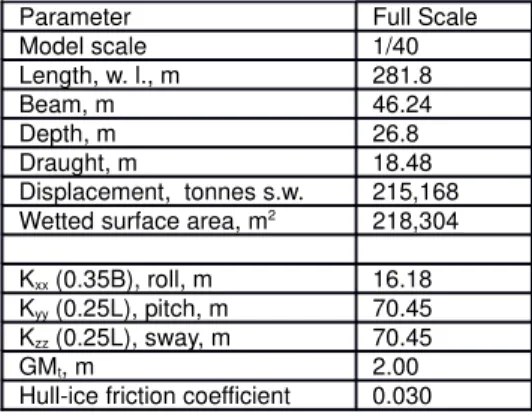
A sketch of the FPU geometry is shown in Figure 2 and a summary of the dimensions is given in Table 2. The model had a 45 degree inclined plane at the stern. The model was ballasted to nominal radii of gyration in pitch (0.25L) and roll (0.4B) and the representative transverse metacentric height (GM) as presented in Table 2.
Figure : Simplified FPSO Hull Shape.
Table : Summary of Principal Particulars
Parameter Full Scale
Model scale 1/40 Length, w. l., m 281.8 Beam, m 46.24 Depth, m 26.8 Draught, m 18.48 Displacement, tonnes s.w. 215,168 Wetted surface area, m2 218,304 Kxx (0.35B), roll, m 16.18 Kyy (0.25L), pitch, m 70.45 Kzz (0.25L), sway, m 70.45
GMt, m 2.00
Hull-ice friction coefficient 0.030
Global loads were measured with two different systems to determine the effect of mooring compliance on the peak loads. For a stiff connection, the model was towed with a device which allowed the model freedom to heave and trim (pitch). For a soft connection between the model and the carriage, the model was towed by a system of four springs oriented at 90˚ to each other and 45˚ from the centerline of the ship. The mooring system was simplified, and did not represent any particular mooring design since the intention was to compare the loads in the soft mooring with the stiff connection. Figure shows the mooring arrangement of the model. The springs were fitted to the model with one end at the level of the deck and; the other end on the test frame of the towing carriage. The resulting mooring system allowed the model six degrees-of-freedom. Two levels of spring stiffness were used, which gave natural periods in surge of approximately 50 seconds and 100 seconds. The model was ballasted to the nominal radii of gyration in pitch (0.25L) and roll (0.4B) and the representative transverse metacentric height (GM).
Figure : Mooring Arrangement, Soft Connection.
A revised system for measuring the local loads was developed after the failure of the pressure panel on the spar. The system consisted of a panel (with a surface area of 3.58 m2
full scale) mounted on a waterproof six-component ATI-Nano load cell. Two panels were fitted to the centerline of the bow. The intention of this measurement system was to measure pressure loads on different parts of the hull, so that the effect of ice loads at different depths could be determined. Details of the panel and load cell attachment to the hull are shown in Figure 4.
Figure : Local Load Measurement System on Bow of FPU
Timco et al. (2000) gave ranges of ridge geometry for three different geographic areas, and from these three representative ridge geometries were chosen, which are summarized in Table .
Table : First-year Ridges, Keel Width and Depth, by Region
Region Size Keel
width, m Keel depth, m Temperate/Sakhalin Large/Small 39.0 10 Sakhalin/Arctic Large/Medium 58.5 15 Arctic Large 85.8 22
To model the effect of ridge parameters on the response of the structure, the test matrix given in Table 4 was used for the first six ice sheets. The proposed ice sheets for the second half of the project are given in Table 5.
Table : Test Matris Matrix for Ice and Mooring Conditions, First and Second Phases
Structur e Mooring Level Ice Thickness, m Ice Density, kg/m3 Flexural Strength, Level ice, kPa
Ridge Type Date
Spar Stiff 1.2 940 600 Unconsolidated Dec-09
Cone Stiff 1.2 940 600 Unconsolidated Dec-09
FPU Stiff 1.2 940 600 Unconsolidated Jun-10
FPU Stiff 0.7 940 600 Unconsolidated Jun-10
FPU Stiff 1.2 880 600 Unconsolidated Jun-10
FPU Soft 1 1.2 940 600 Unconsolidated Jun-10
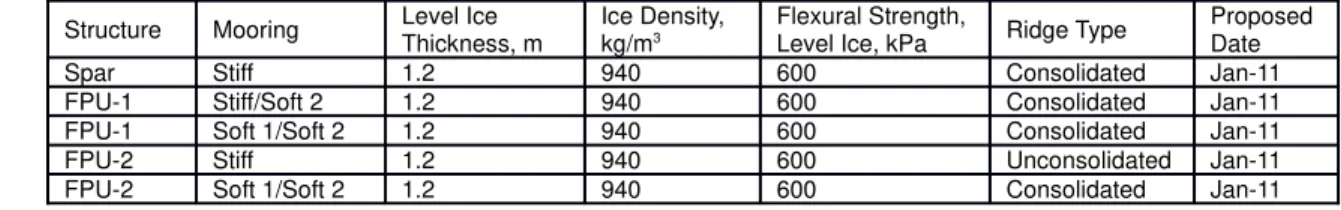
Table 5: Test Matrix for Ice and Mooring Conditions, Third Phase
Structure Mooring Level Ice Thickness, m
Ice Density, kg/m3
Flexural Strength,
Level Ice, kPa Ridge Type
Proposed Date
Spar Stiff 1.2 940 600 Consolidated Jan-11
FPU-1 Stiff/Soft 2 1.2 940 600 Consolidated Jan-11 FPU-1 Soft 1/Soft 2 1.2 940 600 Consolidated Jan-11
FPU-2 Stiff 1.2 940 600 Unconsolidated Jan-11
FPU-2 Soft 1/Soft 2 1.2 940 600 Consolidated Jan-11
Soft 1, natural period in surge =100 seconds Soft 2, period in surge =50 seconds
The ridges were manufactured using the “dump truck” method. To manufacture a model ridge, level uniform ice was grown to the desired thickness. The model ice used at the Institute for Ocean Technology is EGADS ice. It is a dilute aqueous solution of ethylene glycol (EG), aliphatic detergent (AD) and sugar (S) in the approximate ratio 0.39/0.036/0.04%. Glycol is the principal ingredient and its function is to reduce the strength of the ice. After the ice has been grown to approximately the desired thickness, the air temperature is raised to a little over freezing. During this tempering period the ice warms and the entrapped glycol pockets within the ice slowly melt the surrounding crystal structure, thereby weakening the ice. Ice density was controlled by incorporating fine bubbles into the ice when it was being frozen.
The temperature in the basin was brought up to 0ºC prior to making the ridges. The ridges were made by making two cuts across the tank, with the width between the cuts based on the keel width of the ridge. The ice between these cuts was broken up into floes. Extra ice was then taken from the end of the tank, close to the thermal door, and added to the ice already in place between the cuts. The amount of additional ice added was based on the required width and depth of the ridge. A completed model ridge with the spar is shown in Figure 5.
Figure : Spar Model in First Year Ridge
For the first phase of the project, only unconsolidated ridges were studied. This required keeping some level ice behind the final ridge for structural purposes. All three ridges were constructed with some level ice on either side of each ridge, which was also used for determining the resistance of the structure in level ice.
The mechanical properties of the unconsolidated ridges were tested using a shear punch apparatus to determine the internal friction angle of the rubble. A number of different shear punch devices were used to investigate how the type of shear punch apparatus affected the measurements of the internal friction angle of the ridge. The diameters of the three punches were 0.152 m, 0.304 m and 0.508 m. For the two small punches, load was applied to the plate via a spring balance which
recorded the peak load during the test. Two punch tests (one each at North and South ends of the ridge) were made in the ridges, mostly with the 12” apparatus, supplemented by the 6” and 20” apparatus. The ridge was made one to two hours before the first punch tests and the air temperature was about -1ºC for tests.
The shear stress and internal friction angle were calculated using the shear punch test data and the following formulations. The hydrostatic pressure, , from the ice buoyancy in the ridge is given by:
From the Mohr-Coulomb failure criteria the rubble shear strength, , is proportional to the internal friction angle, φ plus a cohesion c,
By integration of the elemental shear forces the total vertical punch force, T, can be found to be given by:
where HK is the total ridge thickness. The gross shear stress, *, can be defined as the shear force, T, divided by the punch
perimeter (πD) times the keel depth, HK.
Ridge profile (keel depth) was measured via an array of six Digital Acoustic Radar Transponders (DART) mounted on the front of the underwater video carriage. The sensors were approximately evenly spaced and covered the middle six meters of the basin. Since two penetrations were performed, the ridges were profiled twice. The DART signal data was incorporated to the other test data through re-sampling and offset adjustment. The keel depth was obtained by using the average values from the appropriate sensors.
The void space within the ridge was calculated from the ratio of the volume of ice used in the construction and the measured profile of the ridge. Ice piece size within the ridge was calculated from calibrated digital photographs of the ridge surface. An example is shown in Figure 6.
Figure : Determination of Component Ice Floe Size in a Ridge
Since the ridges were unconsolidated, it was necessary to reinforce the ridge after the structure had made one pass through. The device used for this purpose was a plywood box designed to float and be towed into position. After the first pass through the ridge, the box was fixed into the broken channel made by the first pass. This allowed the test structure to pass through the ridge the second time without the ridge collapsing into the void left by the first pass.
DATA ANALYSIS AND REDUCTION
Spar
For the spar, forces and moments were measured at the test frame by an array of three six-component AMTI load cells. A tubular backbone extended from the test frame to the bottom of the cone section of the spar. The neck of the spar was
zg
P
z
1()(
)()
W
i
c
)tan(
2 2 11(tan
)()
K iWHg
P
cDT
WiK
K Hg P c HD T tan2 ()1( ) 1 * attached to this backbone by an array of three six-component ATI load cells, so that the force acting on the neck could be separated from the global load. This lower assembly was completely removed for the experiments without the neck. The axis system for the spar was defined as x, positive in the direction of motion, y, positive to starboard, and z, positive downwards. The origin for the global forces (measured at the test frame) was at the design waterline at the centre of the spar. Force components from each load cell were summed to provide the total load acting at the required origin. For the loads on the neck, the origin was at the centre of the plane of the joint between the cone and the neck, regardless of the tilt angle.
To provide the 8˚ tilt angle, the whole unit was adjusted with wedges and clamps. When the model was tilted 8˚, the origin for the loads remained in the plane of the ice, so the force calculation included an 8˚ rotation.
Prior to any experiments in ice, a series of load checks were carried out in the x-, y- and z-directions. The purpose of these checks was to ensure that the force measurement system reacted correctly to known loading conditions. To check the z-load, the dynamometer frame was inverted and weights applied to the bottom of the frame. X-load and y-load were checked in situ before and after each experiment sequence by applying known loads to the model, through a wire that was connected to the model by a strain gauge load cell.
The natural frequency of the model in the x- and y-directions was determined with a ‘pluck’ test. This consisted of loading the model, at its design draft, and then suddenly releasing the load. The time history of the acceleration at the deck was then analyzed with inverse Fourier transforms to identify the peak frequency.
FPU
The axis system for the FPU was the same as the spar. For the stiff mooring system, tow force was measured using a load cell built into the towing device, which was calibrated externally with fixed weights covering the expected resistance load. Sinkage was measured with a yo-yo potentiometer and trim was measured with a rotary velocity displacement transducer. Roll was measured by an inclinometer.
The local load measurements the load cells were calibrated using the manufacturer’s injected calibration procedure. However, they were checked before the experiments using known loads in the three orthogonal directions.
For the soft mooring system, the stiffness in longitudinal and transverse directions was measured. Also, decay experiments were carried out in Surge, Sway, Roll, Pitch, and Yaw directions. As the model transited the ridge, the linear and angular motions relative to the ‘neutral’ position of a stationary model were measured using an optical tracking system.
For the experiments of the model with soft connection, the fairlead tension in the four mooring lines was recorded. The total mooring forces in X, Y and Z directions were then calculated using the known positions of the fairleads and the anchors and the loads measured in the mooring lines.
General
Two data acquisition systems were used during the experiments. One was a time based system which collected data on the forces, carriage speed and carriage position and the other was a position based system which collected data on ice profile as a function of tank position using the DART. The first step in the analysis was to synchronize the two data acquisition systems. This was done using the known location of the ridge in the tank, and determining the time at which the model entered the ridge on each system. A correction to the DART system was made to make the time scale common in both systems. All time dependent data were sampled at 50Hz.
Force data and carriage position were plotted against time. Time segments were selected to represent different events, such as tare segment, open water, level ice, ridge and post ridge. For each segment, the mean and the peak values were
determined. Results were scaled to full scale using the Froude scaling. Time histories were generated of the encountered loads due to the ridge in the x, y and z directions, trim, and sinkage, together with the ridge profile (as appropriate for the model structure).
The experiments consisted of a general pattern which included: 1. Zero speed tare value to re-zero transducers
2. Force measurement at steady speed in open water section
3. Force measurement at steady speed in level ice before entering the ridge 4. Increase in load as the FPU model enters the ridge
5. Decrease in load as the FPU model passes through the ridge
6. Approximately steady value due to combined forces of rubble and level ice after the ridge (post ridge) An example time trace for the spar is shown in Figure 7.
Figure : Fx, Fz and Ridge Profile for Spar
Examples of the time histories of load on the FPU for the stiff connection and the moored connection are shown in Figures 8 and 9.
In addition to the forces, position and speed, visual records of the experiments were made. These consisted of two above water video cameras fixed to the towing carriage, and two below water views from the underwater carriage. For the spar, an additional underwater view was obtained from a camera fixed to a sting at the bottom of the neck.
DISCUSSION OF RESULTS OF EXPERIMENTS
The dominant factor affecting the load due to pressure ridges on the FPU, the cone and the Spar was the depth of the keel. There was no consistent trend for the effect of drift speed on the loads due to first year ice ridges on the FPU, when the model was attached to the towing carriage with a stiff connection. In two out of three cases, the higher speed had lower loads than the low speed, by approximately 15%. These were for the low ice thickness at the high ice density and the high ice thickness at the low ice density. For the high ice thickness at the high ice density, the higher speed had higher loads, also by about the same order of magnitude. On the basis of these observations it is reasonable to conclude that drift speed had little effect on the loads on the FPU, due to first year ice ridges.
There were four cases where the same nominal ridge was prepared with two different parent ice thicknesses. These were for nominal keel depths of 10m and 22 m made from ice 0.7m and 1.2m thick. Based on the results of the experiments, parent ice thickness had no discernable effect on the loads.
Ice density has a large effect on the loads on the FPU. Reducing the ice density from 950 kg/m3 to 800 kg/m3 increased the
load by approximately 40% for the low density ice compared to the high density. In practice, there will be little variation in ice density, but the results of these experiments will be useful in scaling the results of model ridges, constructed with model ice, to prototype ridges constructed with sea ice.
One noticeable feature about the experiments carried out on the spar model as part of this project was the different failure processes for the ridge. For the spar in the medium and large ridges, the ridge was observed to fail in a global mode rather than a local mode. In this condition, a shear plug forms and the ridge fails as a complete structure along two planes at the extreme width of the structure. This phenomenon was also observed for the FPU at both speeds in the largest ridge constructed from 0.7m ice. It was also observed in some cases for the medium and large ridges in the 1.2m ice. The failure followed a similar pattern to the spar, in that the global failure occurred after the peak load had been reached. This was observed as a flattening of the relationship of load against time on the reducing side of the ridge. Global failure was not observed for any cases with the cone only.
The soft mooring system for the FPU was simplified as a linear system, and did not include any non-linearities that occur in more realistic systems. Mooring stiffness had a very significant effect on the magnitude of the peak loads. The soft mooring had a longitudinal stiffness of 0.763 MN/m. With the soft mooring, the loads in the 15m and 22m ridges increased by a factor of 1.8 at 0.2 m/s and 2.4 at 1.0 m/s. The mooring stiffness had little effect on the peak load in the 10m ridges.
Figure : Time Histories of Tow Force, Sinkage and Pitch, Stiff Connection
Figure : Time Histories of Tow Force, Sinkage and Pitch, Soft Connection
Examination of the time traces of model motions showed that the model was surging with large variations in loads at the natural surge frequency of the mooring system. The process was for the model to slow down as the load increased, until
some point when the load in the springs reached the force necessary to start the model moving again. Once this point was reached the model would accelerate and surge forward until the model slowed again due to the increased load. The system is very lightly damped in surge, even in ice. In level ice, prior to the ridge, the hull is surging, and although the extra load due to the ridge acts to damp the surge oscillation, it is only applied for a short time, relative to the natural period of the system. NUMERICAL METHODS
Since the number of physical experiments that could be carried out within this research program was limited, it was planned to develop numerical models of ridge failure against a floating offshore structure in an effort to understand the problem and if possible to supplement the results of the experiments. In this project, Finite Element (FE) models were developed for the study of the interactions of first year ice ridges with offshore platforms. From the start, the modeling concept was based on three fundamental pillars, and they are:
1) the mechanical behaviour of ice during ridge-structure interactions, 2) the multi physics numerical solution, and
3) the validation of the numerical simulations (for the target 95% confidence level and following the ISO-GUM-1995 guidelines).
Other secondary pillars included the creation of a realistic representation of the geometry of the ice ridge, the development of the appropriate contact algorithms, and the effects of hydrodynamics effects on the magnitude of impact ice loads. Realistic ice ridge model should include random geometries, random ice blocks sizes, random ice block orientation, and the effects of initial bulk porosity and ice block packing (i. e. how ice blocks orient and are pack themselves during the interactions). The contact algorithms are needed to model contact forces between discrete ice blocks of the ridge as well as the contact between and the ice ridge and the structure. The inclusion of the hydrodynamics effects will yield a multi-physics solution, where ice-structure-sea waters are all included in a single computer runs (what is called as a fully coupled analysis).
Traditionally, the mechanical behaviour of ice is categorized into low and high strain rates. At high strain rates (>10-3
m/s), linear elastic ice behaviour with a brittle mode of failure is used. However, at low strain rates (<10-3
/s), ice behaves as a time dependent elasto-plastic material with creep deformation. First year ice ridges are made of discrete ice blocks, the individual blocks can be assumed to be small enough so that they will not bend and/or break into yet smaller pieces, and therefore, the behaviour of each block can be even viewed as rigid1
. In this project, by using empirical formulas to calculate ice strain rate, it can shown - (for typical ice ridge drift velocities and the dimensions of the structure targeted in this program), that ice undergoes linear elastic behaviour with a brittle mode of failure (typical strain rates > 10-3
/s). Additional Ttwo additional numerical challenges are encountered when modeling ice ridges, and they are cohesion and frictional forces between ice blocks.
Figure 10 shows a simplified FE model for an ice ridge and a down breaking structure. The keel, sail, and the parent ice sheet are modeled as a series of rectangular blocks creating a very simple FE model. The main purpose of this simple model was to illustrate how frictional and cohesive forces can be modeled. The rectangular blocks used in this phase were easy to generate. R(real ice ridges are made up of random ice blocks, as indicated above, and future model development will include that natural randomness).
All numerical pre-processing for the FE, models presented in this study were developed using ANSYS (www.ansys,.com) and the solution was obtained using LS-DYNA (www.lstc.com). Both software packages were available at the NRC-IOT. ANSYS has great flexibility and versatility to model volumes and surfaces, and also it has the capability to create control meshes for complex forms. LS-DYNA is based on an explicit FE solver, which is mainly used for analysis of short-term, highly dynamic impacts and collision problems. In addition LS-DYNA provides an additional advantage that allows users to model fluids (water and air), and study the effects of hydrodynamic forces on the ice-ridge interactions problems.
In the FE model for the ridge, the coincident nodes (within a prescribed tolerance) are welded together via spot weld beam elements (represented by blue dots in Figure 10). Spot welds are very short beam elements with lengths very close to zero 1 Rigid block does not deform, but realistic material properties are needed so contact and friction between blocks is
(or zero). Each beam element has stiffness and can be programmed to fail at either a prescribed stress value (and/or fail at a prescribed deformation limits). Therefore, the strength for cohesion between individual ice blocks can be controlled. By varying the stiffness of the spot weld beams, ice blocks in the consolidated layer have high stiffness values. Very low stiffness (or zero) stiffness values are used for the spot weld beams in non-consolidated regions of the ice ridges. It follows that, in the first case (moderate to high stiffness values), initial and instantaneous cohesion effects are considered (that is useful for multi-year ridges), while for the second case (very low or zero stiffness), there are no cohesion forces between ice blocks (that is useful for first year ridges). To account for frictional forces between ice blocks themselves, a friction coefficient of 0.3 is assumed. The contact algorithm in the LS-DYNA program uses the friction value coefficient and computes frictional forces generated between ice blocks (that is ice-ice friction). The same routine is used to compute frictional forces between the ice and the structure (that is ice-structure friction). Ice-ice friction and ice-structure frictions may have different values.
Down breaking plate (structure) Reaction Plate
Ice Ridge
Spot Welds - BeamsFigure 10: Simplified Finite Element Model of an Ice Ridge and Structural Plate (spot weld elements are shown in blue)
The interaction between a downwards breaking plate and a first year ridge is shown in Figure 11 (atfor different times of during the simulations). At the present stage of model development, the offshore structure is represented by a simple down breaking inclined plate. However, it is our objective to integrate the actual models for both spar and FPU into the final numerical model.
Figure 11: FE Example Results - Interaction between Simplified Down Breaking Structure and an Ice Ridge at Different Times of the Interaction Process
To simulate the ice ridge–structure interactions (such as in the case shown in Figure 11), the plate was moved forwards at a given drift velocity2
. The plate approaches the ice ridge, contacts it, and then it pushes through it. Initially, the ridge resists, and then ice blocks start to break away. During the simulations, the cohesion “spot weld” beams stretch and break, and therefore ice blocks pile up on top of each other (see figure Figure 11). In this particular case, the stiffness of the spot weld beams are assumed to be very small because the objective at this stage is to simulate interactions of structures with non consolidated ice ridges.
The fluid domain is represented by two Eulerian computational spaces (one for air and one for water, figure Figure 12). Together, the two Eulerian spaces allow modeling of the free surface, the hydrodynamic motion of the ridge, the buoyancy, and the hydrodynamic forces. More information regarding modeling of ice in fluid domains were given by Derradji-Aouat (20012010).
Air
Water
Figure 12: FE Simplified Model in an Eulerian Computational Space
Figure 12 shows the simplified model (ice ridge-plate) in the Eulerian space. The computational spaces are made up of fixed space. A Fluid-Structure Interactions (FSI) algorithm in LS-DYNA is used to compute interactions (forces, pressures, and velocities) between the fluids (air and water) and both the ice blocks and the structure.
Currently, in this project, work is focused on FSI routines. The next immediate step is to integrate all numerical models together (Structure-Ice-Fluid). The integrated model will include the spot weld beams, ice blocks self contact and frictions, interactions between ice and structures, hydrodynamic effects, proper buoyancy calculations, and FSI. The long-term goal is to use the integrated (multi-physics) model and perform a V&V analysis (verification and validation). This will include comparisons between experimental data and numerical results.
RECOMMENDATIONS AND CONCLUSIONS
The comparison of the loads between the stiff connection and the elastic mooring system should be investigated in more depth. Earlier research with spars in ridges (Murray & Yang, 2009; Murray et al., 2009) had shown that soft mooring systems experienced higher loads in ridges than stiff systems, and determining the reasons for this was one of the motivations for carrying out this research. The research described in this paper showed that this type of response can be observed in other types of offshore structure.
The main objective of the project was to develop methods of predicting the peak loads on an offshore structure due to first year ice ridges. There are several published analytical methods for predicting the load on a vertical cylinder due to ice ridges. Most of them are described by Timco et al. (2000), but these methods were developed for primarily for vertical cylinders rigidly fixed to the sea bed. These methods do not apply to moored structures or structures with inclined surfaces similar to those found in icebreaking ships. The development of a numerical and analytical model which includes ridge structure interaction for a compliant mooring system is required.
For the successful completion of this project, it is important to be able to predict the peak loads due to ridges acting on a floating offshore structure, which includes the following features:
[1] Effect of ridge keel thickness [2] Geometry of the structure
[3] Effect of mooring system stiffness
[4] Failure due to local and global mechanisms
[5]
The data from theses experiments will be useful for developing and validating numerical and analytical approaches. ACKNOWLEDGEMENTS
The research described in this paper was part of project organized through CITEPH in Paris, France, The authors would like to thank the management of Total for granting the permission to publish this paper. The authors also express their appreciation to the sponsors Total, Saipem, Technip, Doris & Entrepose for their support and advice without whom this project would have not be possible. The authors would also like to thank the management and staff of the National Research Council’s Institute for Ocean Technology and Oceanic Consulting Corporation for their support and assistance during the project.
REFERENCES
CITEPH 27-2009; Modelling of First Year Ice Loads on Floating Offshore Structures
Derradji Aouat, A. (2010) Critical Roles of Constitutive Laws and Numerical Models in the Design and Development of Arctic Offshore Installations, Icetech10 (www.icetech.org), Anchorage Alaska, USA.
ISO-GUM-1995. “Guide to the Expression of Uncertainty in Measurement”, International Organization for Standardization, Genève, Switzerland.
Murray, J. J. and Yang, C. (2009) “A Comparison of Spar and Single Column Floater in an Arctic Environment’, Offshore Technology Conference, Paper 19797, Houston TX, May 4-7.
Murray, J. J., LeGuennec, S., Spencer, D., Yang, C. and Yang, W. (2009) “Model Tests on a Spar in Level Ice and Ridge Conditions’, Paper OMAE2009-79733, Proceedings, 28th International Conference on Ocean, Offshore and Arctic Engineering, Honolulu, HI, May
31-June 5.