HAL Id: hal-02442237
https://hal-cea.archives-ouvertes.fr/hal-02442237
Submitted on 16 Jan 2020HAL is a multi-disciplinary open access archive for the deposit and dissemination of sci-entific research documents, whether they are pub-lished or not. The documents may come from teaching and research institutions in France or abroad, or from public or private research centers.
L’archive ouverte pluridisciplinaire HAL, est destinée au dépôt et à la diffusion de documents scientifiques de niveau recherche, publiés ou non, émanant des établissements d’enseignement et de recherche français ou étrangers, des laboratoires publics ou privés.
Corrosion mechanism of iron in liquid uranium
hexafluoride environment
M. Achour, L. Martinelli, S. Chatain, L. Jouffret, M. Dubois, P. Bonnet, A.
Selmi, B. Morel, S. Delpech
To cite this version:
M. Achour, L. Martinelli, S. Chatain, L. Jouffret, M. Dubois, et al.. Corrosion mechanism of iron in liquid uranium hexafluoride environment. EUROCORR 2016 - European Corrosion Congress, Sep 2016, Montpellier, France. �hal-02442237�
Corrosion of iron in liquid uranium hexafluoride
Mickaël ACHOUR1, Laure MARTINELLI2, Sylvie CHATAIN2, Laurent JOUFFRET3, Marc DUBOIS3, Pierre BONNET3, Ania SELMI1, Bertrand MOREL1, Sylvie
DELPECH4
1
AREVA, Hall de Recherche de Pierrelatte, Chemistry and enrichment division, 26701 Pierrelatte, France, mickael.achour@areva.com; ania.selmi@areva.com;
bertrand.morel@areva.com 2
CEA, DEN, Service de la Corrosion et du Comportement des Matériaux dans leur Environnement (SCCME), CEA, Université Paris-Saclay, F-91191, Gif-sur-Yvette, France,
laure.martinelli@cea.frsylvie.chatain@cea.fr 3
Institut de Chimie de Clermont Ferrand, Campus des Cézeaux, 63170 Aubière, France,
laurent.jouffret@univ-bpclermont.commarc.dubois@univ-bpclermont.com pierre.m.bonnet@univ-bpclermont.com
4
Institut de Physique Nucléaire, 91406 Orsay, France, delpech@ipno.in2p3.fr
Abstract
Dedicated and reliable experimental setup had been designed and experiments had been carried out in order to perform corrosion experiments on pure iron in liquid uranium hexafluoride (UF6) at 80°C and 3 bars. Three corrosion tests have been carried out from several hundred to almost a thousand hours. No uniform corrosion has been observed for early stages samples with nodule-facies consisting in FeF2 and UFx (with 4<x<5) deposits. Those FeF2 nodules grew and merged leading to the formation of an almost continuous FeF2 layer. The thickness of the nodule shape / continuous layer seemed to follow a parabolic kinetics law with a final thickness about 15 µm for almost a thousand hours. Thermodynamics calculations showed that the obtained corrosion products are the most stable compounds leading to assume that Fe+UF6=FeF2+UF4 reaction occurred. After merging, the FeF2 layer contained many cracks filled by UFx. These cracks were certainly due to growth stresses within the corrosion layer.
Keywords
Introduction
In the framework of nuclear fuel production, one of the intermediate compounds is uranium hexafluoride used for the enrichment of uranium. UF6 is obtained by fluorination of uranium mining concentrates through a process called “conversion” and its high volatility near room temperature makes it compatible with the gaseous centrifugation process used to enrich uranium in its fissile isotope 235U. Structural materials of COMURHEX, the industrial conversion plant of AREVA, are submitted to liquid, solid and gaseous uranium hexafluoride. This molecule is moisture sensitive, leading to hydrogen fluoride and uranium oxyfluoride, which means that both chemical and radioactive risks are involved. Steel’s mechanical properties and cost are adapted for industrial appliances and different grades of steel are thus used for the whole UF6 production process. Even if it resists more than ceramics and organic compounds which are highly reactive with UF6, steel is corroded by uranium hexafluoride. Corrosion products can then be found in liquid UF6 and they induce pollution in the final product. In a first estimation, the corrosion kinetics has to be determined to quantify the level of pollution caused by steel degradation and the corrosion mechanism understood. On one hand it is important to evaluate the lifetime of the industrial equipment, on the other hand the quality of the final UF6 product might be lowered by the pollution caused by steel degradation. Indeed, the understanding of steel corrosion induced by liquid UF6 has not been studied in the past and mechanisms or kinetics models are not available. Pure iron was chosen as a first material to be studied, as it is a standard material. This proceeding deals with the corrosion of pure iron (99.5%) induced by liquid uranium hexafluoride at 80°C. A dedicated experimental set up was designed and built to deal with the constraints of liquid UF6 (radiological environment, relatively high pressure, high reactivity with moisture) and precise procedures have been developed to perform reliable experiments.
This dedicated apparatus called CORFU (CORrosion in uranium hexaFlUoride) is described in this paper. Corrosion experiments were performed for several lapses of time, up to about 1000 hrs. Corroded samples were observed and analyzed by Scanning Electron Microscopy (SEM) coupled with Energy Dispersive Spectroscopy (EDS) and X-Ray Diffraction (XRD).The results of the experiments are shown and discussed: the nature of the corrosion products are detailed and a corrosion mechanism is suggested.
Experimental device
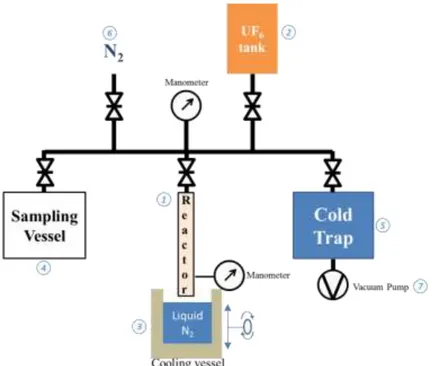
Some parameters have to be considered to set up a reliable experimental device and procedure. First of all, moisture has to be completely avoided since the reactivity with UF6 is very high. It implies working with a glove box and an airtight apparatus. Secondly, the setup has to allow the insertion of a small quantity of UF6 as radioactive risk is involved in those experiments. As liquid UF6 is required in the study, referring to the phase diagram displayed Figure 1, the reactor has to resist under pressure: the pressure of UF6 is 3 bars at the working temperature of 80°C and safety margin must be taken into account.
Figure 1: Phase diagram of UF6.
In order to obtain liquid UF6 in the corrosion reactor (Figure 2.1), in which samples are inserted, is connected to an industrial gaseous UF6 tank provided by AREVA (Figure 2.2). During the reactor filling, gaseous UF6 is solidified by cooling the reactor with liquid nitrogen (Figure 2.3). This step permits, by pressure variation, to monitor the inserted amount of UF6. From those considerations, reactor material requirements are known: withstand UF6 corrosion, be machinable, display the lowest water absorption and resist temperatures from -195 °C to 100°C (safety margin). The chosen material is the polychlorotrifluoroethylene (PCTFE). The designed reactor is shaped as a tube with an 8 mm internal diameter. This reactor can be closed with a manufactured PCTFE valve. The smallness of the reactor implies to use small Fe samples. Three Fe samples per experiment are corroded in order to perform various analyses and ensure the reproducibility of the results. Dimension of the samples are 10x1x4mm plates.
Experimental Conditions
Figure 2: Gas transfer setup drawing
Concerning the gas transfer setup (Figure 2), an assembly of valves, pipes and manometers allows to connect the reactor (Figure 2.1) to the UF6 tank container (Figure 2.2) but also to the sampling vessel (Figure 2.4) and the safety cold trap (Figure 2.5). The whole equipment is thermally controlled and can be maintained at the desired temperature. This gas transfer setup is also linked to gaseous N2 tank (Figure 2.6) in order to be filled by neutral gas and to a vacuum pump (Figure 2.7) across the cold trap in order to vacuum to whole setup.
Sample holders have also been designed. Two kinds of sample holders have been proposed both made of PCTFE (Figure 3). The first one, called “slot” holder, presents three slots where samples are plugged in (Figure 3.a). The second one, called “rod” holder, consists of a manufactured slit tub, in which a 2 mm diameter rod slides. This rod is threaded through holes in the samples. The samples are further separated by small PCTFE braces to prevent any contact between them. In that way, the metal free surface for each sample is known since any contact between them or with the reactor’s walls are avoided.
Experimental procedure
Samples are grinded up to SiC 1200#, the measured roughness Ra is about 50 µm. After weighing, samples are introduced in the reactor inside a glove box under a commercially pure Nitrogen atmosphere. The reactor is weighed and then connected to the gas transfer setup. In order to obtain total desorption of oxide and water of the facility, setup is maintained one night at 80°C under vacuum and residual moisture is purged. The cold trap, the sampling vessel and the reactor are cooled down by means of liquid nitrogen. As soon as cold enough, a UF6 pressure is introduced in the pipes from the UF6 tank. Then, the reactor is filled and because of UF6 solidification, the introduced amount of UF6 is monitored by pressure variation in the pipe. Due to the small volume in the reactor, corking can happen limiting the introduced amount of UF6. This is noticeable by the halt of pressure variation. In this case, the reactor is closed, warmed up, leading to liquid UF6 flowing in the reactor bottom, and the remnant UF6 in the pipe is send to the sampling vessel. Then the reactor is cooled down again and the operation is repeated until the expected quantity of UF6 is introduced in the reactor. The UF6 amount necessary for an experiment is between 2.5 g and 3 g. This quantity of introduced UF6 is also controlled by weighing. As soon as the filling is finished, the reactor is disconnected from the gas transfer setup and introduced in an oven for a determined corrosion time.
Since PCTFE reactor is opaque, each reactor has a manometer which allows monitoring for the detection of potential external leak.
When the corrosion duration is reached, the reactor is once again connected to the gas transfer setup and emptied by the reverse manipulation: UF6 is sublimated and fills the sampling vessel. The collected UF6 is analyzed by Inductively Coupled Plasma Mass Spectrometry (ICPMS) and compared to the initial UF6. The samples are removed from the reactor in a glove box and the reactor is washed by a HNO3 solution, which is also analyzed. All these ICPMS analysis are performed to evaluate the impurities concentration in the UF6.
The samples are weighted and prepared for post mortem analyses. XRD is carried out on one sample in a dedicated XRD cell which has been designed by the Institut de Chimie de Clermont Ferrand (ICCF). This XRD cell is airtight in order to prevent any corrosion product degradation. Another sample is mounted for SEM and EDS and cut with a dicing saw using a water free cutting oil to lubricate and protect the sample from air. Sample polishing is also performed under oil lubrication and ethanol based polishing solution to obtain a mirror finish. After 2 minutes in ethanol ultrasound bath, a 15 nm carbon layer is deposited before SEM observations. This metallization is necessary to avoid charge effect of the sample caused by the poor conductivity of corrosion products.
Experimental results
XRD measurements have been carried out using a Panalytical X’pert diffractometer with a Cu (Kα1) radiation (λ= 1.5406Å). SEM pictures were obtained with a Zeiss MERLIN FE-SEM with an EDS Oxford Detector X-Max 80 mm², using the standard UO2 from Cétama for uranium and oxygen, and the standard SrF2 from Microspec for fluorine with EHT=15 kV and a current of 5 nA. Finally, hydrolysis solutions were analyzed using an ICPMS PerkinElmer NexION.
Among the three samples per corrosion time, one is used for XRD analysis, one for cross section SEM observation and the third is kept for other potential analysis.
Nature of corrosion products and layer structure
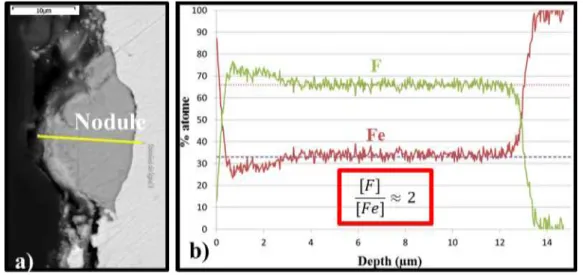
At early stages the iron surface is scattered with iron fluoride nodules (Figure 4.a, 5). Those nodules present cracks and peeling between them and the iron substrate surface is still visible. Each measurement on nodules performed by EDS (as line analysis Figure 4), shows that the formed iron fluoride is probably FeF2, since the concentration of fluorine over the concentration of iron in atomic percent is close to 2. Note that for the 3 first microns of the EDS profile, a boundary effect has been observed: the mass looping (sum of all the elements mass percent) was lower than 100% involving an unreliable analysis. Then reliable quantification can be considered from 3 µm to 14 µm in profile of Figure 4b obtained from the yellow line of Figure 4.a.
Figure 4: iron sample oxidized several hundred hours in liquid UF6: (a) QBSD-SEM picture
of the nodule; (b)EDS results
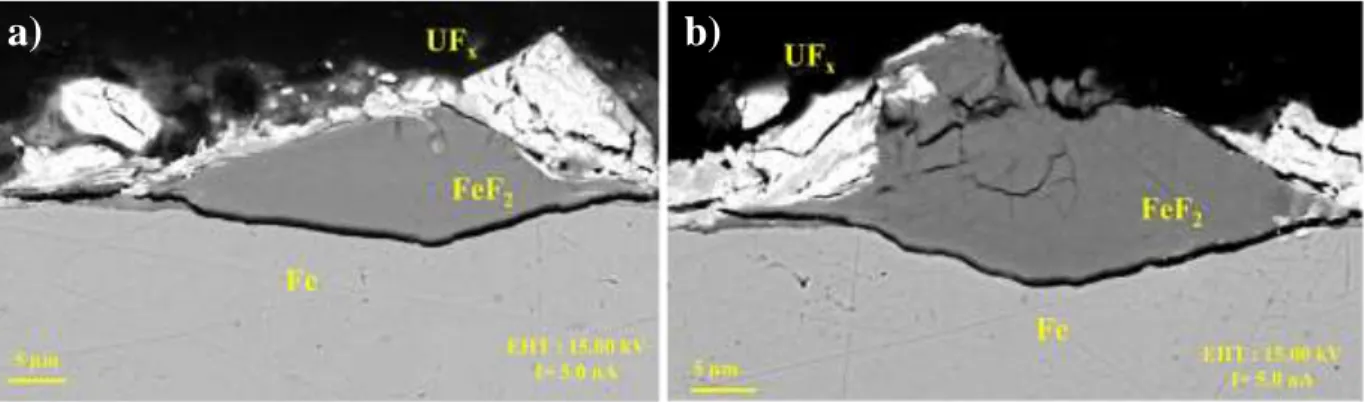
Close to those FeF2 nodules, intermediate uranium fluoride particles are deposited, either on top of FeF2 nodules (Fig. 5a) or on the iron on nodules sides (Fig. 5b). A high porosity is already noticed on those UFx blocks. The stoichiometry of uranium fluoride is not clearly determined on the two first experiments (with nodule facies), due to the low XRD and EDS signals. The pictures Figure 5.a and b are representative of the global observation of this corrosion layer structure and those defects.
Figure 5: SEM Back Scattering Electron (BSE) pictures of nodules visible on surface cross
section of Fe sample oxidized in liquid UF6.
After a while, FeF2 nodules grow, leading to a quite continuous layer (Fig. 7a). The layer composition is still FeF2 as confirmed by the XRD measurement of Figure 6.
Figure 6: XRD measurement on Fe sample oxidized in liquid UF6 presenting a continuous
layer.
Moreover, this XRD measurement leads to propose that UFx stoichiometry is U2F9. This x value (4.5) cannot be confirmed by EDS analyses since the UFx is too porous to be reliably quantified as observed on Figure 7.
Figure 7: SEM pictures of cross section of the continuous layer on an iron sample oxidized in
liquid UF6: (a) general view of the corrosion layer; (b) zoom on uranium fluoride layer.
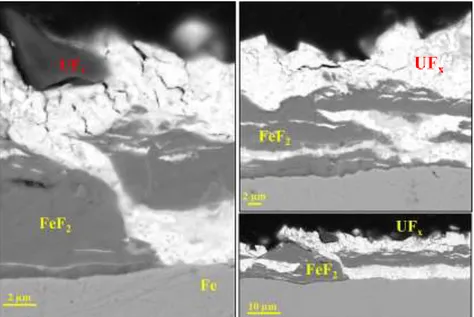
The corrosion layer structure of the corroded sample is quite heterogeneous: Figure 7.a and Figure 8 are SEM pictures of two parts of the sample. EDS shows that the corrosion layer can either consists in a FeF2 layer in contact with Fe substrate and an upper layer of UFx (Figure 7.a) or consists in a succession of FeF2 and UFx layers (Figure 8).
Figure 8: SEM-BSE Pictures of the structure variability of corrosion layer on an iron sample
oxidized in liquid UF6.
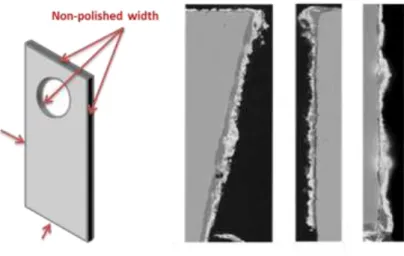
Finally SEM pictures of the width of each sample are presented figure 9. Presence of continuous FeF2 layer even for the earliest stages of corrosion is due to the higher surface roughness of the sample width since only the two large faces of the sample were ground up to SiC 1200#.
Figure 9: SEM pictures of width of oxidized iron sample at early stages presenting layers instead of nodules.
Kinetics
The kinetic evolution is usually drawn by weight gain or weight loss of sample. The weight gain evolution for those three experiments seems to be inappropriate for the corrosion monitoring since spalling seems to occur. In that consideration, the layer thickness is used to monitor the corrosion. As SEM pictures are taken from a lonely transversal cut, there is a possibility to observe a particular orientation of a nodule which is not representative of the nodule itself. Figure 10 displays some possibilities of observations made on the same nodule from various cross sections (1, 2, 3 and 4). It appears that both measured thickness and width clearly depend on the section cut.
Figure 10: a) Various plans of cross section (1, 2, 3, 4) and b)nodule draws of nodule displayed by SEM on cross section 1, 2, 3 or 4.
Figure 10 shows that the real size of the nodules cannot be determined by cross section observations. Then, a statistical review of each nodules observable on one cross section lead to evaluate the maximal nodule dimension as it has to be used to monitor the corrosion. Due to spallation of uranium fluoride layer, only the FeF2 layer thickness is considered.
The corrosion process seems to follow a parabolic kinetics which usually means that the growth of the layer is limited by diffusion phenomenon.
However, only 3 experiments have been carried out for this paper. More values are needed to conclude on the parabolic or linear feature of the kinetics. Moreover, as observed on figure 8 and 9, spallation of FeF2 scale seems to occur for long duration which impedes a precise measurement of the FeF2. Then, measurement of consumed iron should be done instead of measurement of the formed FeF2.
Discussion
Nature of corrosion products and layer structure
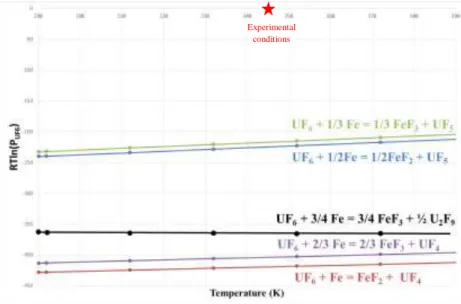
Phase diagram [1] Fe-F shows that only the FeF2 and the FeF3 components exist. Using free energies given by [JANAF98] for FeF2, [GLUSHKO96] for FeF3, [GLUSHKO94] for UF4 and UF5 and [CTI92] for U2F9 formation, the Ellingham diagram Figure 12 is plotted. This study experimental conditions are also added to the graphic. It shows that:
- For 3 bar of UF6 at 80°C, the two iron fluorides are stables;
- FeF2 is slightly more stable than FeF3 which explains the observation of FeF2 in our experiments;
- Reaction between UF6 and Fe leads to uranium reduction into UF4 or UF5 with higher stability for UF4.
Figure 11: Ellingham diagram of reactions of iron with liquid UF6 forming iron fluorides and
uranium fluorides UF4 or UF5.
Then the reaction taking place with iron at 80°C is probably: UF6 + Fe = FeF2 + UF4. The current EDS measurements on uranium components are not good enough to conclude clearly on the uranium fluoride stoichiometry. Indeed, as proposed previously, the high porosity of UFx layer involved an unreliable quantitative measurement. Moreover, EDS references for this kind of component were not available at this moment, and the F-U system is not common and could only be approximate with U-O and Zr-F references in order to conserve heavy nucleus/light nucleus ratio. Finally, as presented in different literature studies [2, 3, 4, 5], UFx component stoichiometry is dependent of UF6 pressure and temperature. As the reactor is
Experimental conditions
emptied by evaporation, the UF6 pressure variation should be considered as a major issue for the product conservation.
Considering the current results, the main occurring reaction is assumed to be: UF6 + Fe = FeF2 + UF4. According to this assumption, when one mole of FeF2 is formed, one mole of UF4 is also formed. As the ratio of FeF2 molar volume over the UF4 molar volume is equal to 2.04; the UFx layer thickness observed on the corroded samples should be two times higher than the FeF2 nodules/layer thickness. Figures 4, 5, 7, 8, 9 show, on the opposite, a higher thickness for FeF2 nodules than for the UFx layer. This observation reveals that high proportion of UFx layer spalled or crumbled into liquid UF6.
Concerning the structure, SEM pictures show that iron fluoride present cracks. Those cracks can be explained by the Pilling-Bedworth Ratio (PBR) [6]. Generally, this PBR is the ratio of the volume of the elementary cell of a metal oxide over the volume of the elementary cell of the corresponding metal (from which the oxide is created). The formula is the following one:
𝑅𝑃𝐵 = 𝑉𝑜𝑥𝑖𝑑𝑒 𝑉𝑚𝑒𝑡𝑎𝑙 =
𝑀𝑜𝑥𝑖𝑑𝑒𝜌𝑚𝑒𝑡𝑎𝑙 𝑛 𝑀𝑚𝑒𝑡𝑎𝑙𝜌𝑜𝑥𝑖𝑑𝑒
With PBR the Pilling Bedworth Ratio, V the molar volume, n the number of atoms of metal per one molecule of the oxide, M the atomic or molar mass and ρ the density.
If the PB ratio is less than unity, the oxide presents tensile stress leading to porosity, if it is higher; it presents compressive stress which can lead to cracks. In the present study, fluorides replace oxides on the metal surface, but the same reasoning can be proposed. Then the PBR for FeF2 presents a value of 3.24 which is high in comparison to usual metal/oxide PBR as Al2O3/Al = 1.28, NiO/Ni = 1.65 or Fe/Fe3O4 = 2.1. This value confirms that growth stress and strains are important in the FeF2 scale and can lead to cracks in the scale.
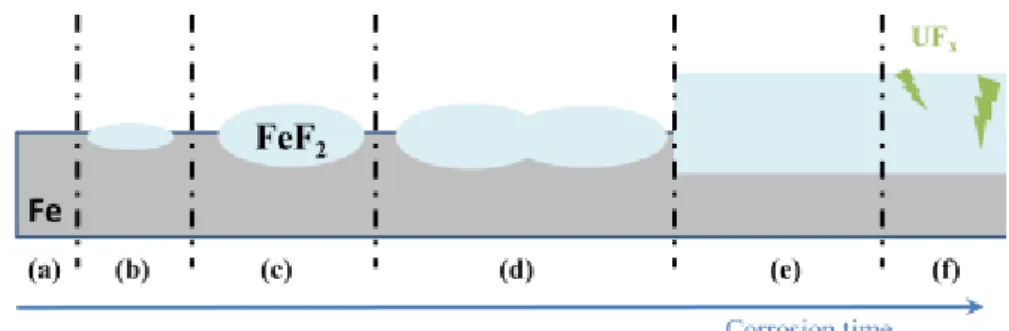
The cracks lead to direct contacts between the iron and the liquid UF6 leading to enhance the corrosion kinetics. From those ideas (crack filling, thermodynamic stability and enlightened structure) a mechanism can be proposed as follows, figure 13. At the beginning (a), iron is in contact with liquid UF6. Then after a while, nodules start to appear on the iron surface (b) then grow (c). Growing, nodules merge (d) leading to a continuous layer (e). As cracks occur in the scale, uranium fluoride comes in the FeF2 layer (f).
Figure 12: Schematic of successive steps for the formation mechanism of the corrosion layer: (a) contact between iron and UF6, (b) nucleation of nodule, (c) nodules growth, (d) nodules
Conclusion
This paper gives the first results on iron corrosion in a liquid UF6 environment whereas the whole literature focuses on gas state. These results have been obtained thanks a dedicated reliable experimental setup and the associated procedure which have been developed in the framework of this study. Three experiments have been performed and have been presented here. These corrosion tests, analyzed by SEM/EDS and XRD, gave results on nature of corrosion products and their structure but also the trend of the corrosion kinetics for iron samples polished up to 1200# SiC. On the one hand, the iron fluoride formed at experimental conditions is FeF2, from nodules to a scale which present important cracks. The uranium fluoride resulting during the corrosion reaction, and mainly localized in cracks, is not clearly identified by EDS since it is highly porous leading to low EDS signal while XRD results tend to attribute the U2F9 nature. On the other hand, the kinetics follows a parabolic law. Since the kinetics is obtained from only 3 experimental points, other experiments are currently running. Moreover, the use protective coating on sample parts will help to know the consumed iron and precise the corrosion monitoring. This could be performed with a Ni coating. Indeed Ni presents higher resistance to corrosion in UF6 than iron [7]. This coating could act like a surface marker allowing estimation of the consumed iron thickness instead of the formed fluoride.
Acknowledgment
Authors thank Lionel MAZELLIER who has greatly assisted for device set up and UF6 manipulations. For the post mortem analyses, authors thank Mathilde PONS and Cedric DAVID for their advices.
References
1. Elisabeth Renaud, « Modélisation des équilibres thermodynamiques impliquant le fer dans la cryolithe lors de l’électrolyse de l’aluminium à l’aide d’anodes inertes », Thesis, Montréal, 2009.
2. Agron, P., Grenall, A., Kunin, R., Weller, S., 1948. MDDC-1588. Oak Ridge. 3. Leitnaker, J.M., 1980. High Temp. Sci. 12, 289–296.
4. NGUYEN-HOANC'NGHI, « Contribution à l’étude de fluorures intermédiaires d’uranium », Thesis, Université de Lyon, 1961
5. Aurélien Bock, « Etude de la réactivité de l'hexafluorure d'uranium : application à la formation de composés dérivés de fluorures d'uranium et à la réaction avec les métaux et leurs alliages », Thesis, Université de Clermont Ferrand, 2012
6. N.B. Pilling, R.E. Bedworth, "The Oxidation of Metals at High Temperatures". J. Inst. Met 29 (1923), p. 529-591.
7. W. H. Gunther and M. J. Steindler, “The corrosion of nickel and nickel alloys by fluorine, uranium hexafluoride, and selected volatile fission product fluorides at 500°C”, AEC Research and development report, 1966.