HAL Id: hal-02265574
https://hal-univ-tln.archives-ouvertes.fr/hal-02265574
Preprint submitted on 10 Aug 2019HAL is a multi-disciplinary open access archive for the deposit and dissemination of sci-entific research documents, whether they are pub-lished or not. The documents may come from teaching and research institutions in France or abroad, or from public or private research centers.
L’archive ouverte pluridisciplinaire HAL, est destinée au dépôt et à la diffusion de documents scientifiques de niveau recherche, publiés ou non, émanant des établissements d’enseignement et de recherche français ou étrangers, des laboratoires publics ou privés.
Variable properties of solid solutions of cerium-samarium
tungstates Ce(2-x)Smx (WO4)3 (x
≤0.3)
K. Derraji, Sylvie Villain, C. Favotto, Jean-Raymond Gavarri, J-C
Valmalette, A. Lyoussi, G. Nolibe, F. Guinneton
To cite this version:
K. Derraji, Sylvie Villain, C. Favotto, Jean-Raymond Gavarri, J-C Valmalette, et al.. Variable prop-erties of solid solutions of cerium-samarium tungstates Ce(2-x)Smx (WO4)3 (x≤0.3). 2019. �hal-02265574�
Ce(2-x)Smx (WO4)3 - Working document- HAL-08/10/2019
1
Variable properties of solid solutions
of cerium-samarium tungstates Ce
(2-x)Sm
x(WO
4)
3(x≤0.3)
K. Derraji (1,*),
S. Villain(1), C. Favotto (1), J-R. Gavarri(1), J-C Valmalette (1),
A. Lyoussi (2), G. Nolibe (3), F. Guinneton(1,**)
(1) Université de Toulon, Aix-Marseille Univ., CNRS, IM2NP, La Garde 83130, France.
(*) (**) correspondence to : kaouther.derraji@univ-tln.fr; (**) guinneton@univ-tln.fr
(2) CEA Cadarache, St Paul lez Durance, France
(3) CeSigma S.A, Le Pradet, France
Abstract—A solid solution Ce(2-x)Sm x(WO4)3 with x≤0.3 was synthesized via a coprecipitation route followed by thermal treatment at 1000 °C. The polycrystalline compounds were characterized by X-ray diffraction, scanning electron microscopy and photoluminescence experiments. Using Rietveld procedure, the decrease of cell parameters showed that a solid solution was obtained. A comparative analysis of diffraction profiles allowed determining structural distortions increasing with composition x. Photoluminescence (PL) experiments were performed under UV and X-ray excitations. The variations with composition x of PL emission intensities, corresponding to complex charge transfers and quenching effects, were interpreted in terms of transitions proper to Ce3+ and Sm3+ cations, accompanied by additional transitions probably due to oxygen vacancies and other point defects generated by substitution and synthesis conditions. The CIE chromaticity diagrams showed variable colors located in the orange-red range.
Keywords— samarium cerium tungstates, chemical substitution, structural distortions, photoluminescence
I-
INTRODUCTION
The tungstates AWO4 and molybdates AMoO4 with A = Ca, Sr, Ba, Pb, Cd… were extensively studied for their potential applications: luminescence for detection, low cost lighting, photocatalysis [1]. The synthesis conditions or thermal treatments played a prominent role in the observed final properties. The most common crystalline forms are of scheelite and wolframite types. Recently, various series of solid solutions of photoluminescent materials were synthesized and studied in our laboratories: Ca(1-x)CdxWO4 [2], Sr(1-x)PbxWO4 [3], Sr(1-x)PbxMoO4 [4], Ba (1-x)PbxWO4 [5]. In each of these series of scheelite solid solutions, the structural, electrical, vibrational and photoluminescence (PL) properties were studied as a function of composition x. The effect of disorder was observed through perturbations of these properties: an increase in photoluminescent emissions was observed for certain intermediate compositions x. Tungstates based compounds are also considered as potential excellent matrix for rare earth (RE) doping to develop luminescent materials [6]. Rare earth tungstates have attracted much attention from researchers because of their well-known photoluminescence emissions [7,8] applicable to scintillators, electro-optical devices, thermoluminescence, stimulated Raman scattering,
catalysis [9]. In the field of luminescence, scheelite tungstates are much interesting because of their self-luminescence character [10]. This family has a self-luminescence in a visible spectrum, it could be divided into three regions: blue, green and red. In the literature, the researchers attributed the emission in the blue region to the charge transfer within the group of transition (WO4)2- [11,12]; however, to date, the origins of the green and red luminescence emissions are not definitely interpreted.
Presently, we have focused our attention on new solid solutions based on a matrix Ce2(WO4)3 in which Sm3+ ions substitute for Ce3+ ions. The Ce2(WO4)3 phase was synthesized first by T. Greesling et al. [13]. The authors prepared single crystals of Ce2(WO4)3 by crystallization from molten mixtures of WO3 and CeO2. The crystal structure was determined by X-ray diffraction on single crystal: the symmetry was monoclinic with space group C2/c and cell parameters a (Å) = 7.813(4), b (Å) = 11.720(2), c (Å) = 11.586(3), β = 109.36(3) ° and with 4 chemical units (Z = 4). The structure of Ce2(WO4)3 was characterized by WO4 tetrahedra, WO5 square pyramids and distorted CeO8 polyhedra. Recently, Anna M. Kaczmarek et al. [14] synthesized the Ce2(WO4)3 phase by using a hydrothermal method. The authors demonstrated the influence of the presence/absence of the surfactant on the morphology and the photoluminescence properties of Tb3+ in the Ce2(WO4)3 matrix. Other authors, Bai Sun et al. [15] reported a simple hydrothermal way to elaborate the Ce2(WO4)3 phase: the goal was to fabricate a resistive switching memory device with Ag/Ce2W3O12/fluorine-doped tin oxide (FTO) structure. Moreover, they demonstrated the effect of visible-light illumination on the device.
The interest of doping Ce2(WO4)3 by Sm3+ cations is multiple: magnetic properties, luminescence of both Ce 3+ and Sm 3+ cations combined with charge transfers in WO4 / WO5 groups. This system was never investigated with the objective of determining the interactions between diversified emission centers, which is essential to develop tunable systems of detection or low-cost lighting (Light Emitting Diode, LED).
Wenyan Zhang et al. recently studied the Sm2(WO4)3 compound [16] presenting the same monoclinic structure and space group as cerium tungstate. These authors demonstrated that, in the Sm2(WO4)3 matrix, the WO42- group could transfer the near UV light energy to the Sm3+ ions, emitting blue, green and red light. This property would allow these materials to act as UV absorbers for solar cells and can be useful for the development of white-light LEDs. In parallel, researchers are also attracted by the Ce3+ doped materials (with low concentration of dopant <1%) because of their low cost, their spin and their parity which allows 4f - 5d optical transitions characterized by fast-radiative lifetime of about 10 to 50 ns, which is very desirable for scintillators, diodes etc. [17].
In this study, the distant objective would be to determine the role of PL emitting centers in the variations of PL intensities, and to determine their potential applications as materials with tunable photoluminescence.
II-
EXPERIMENTAL
SECTION
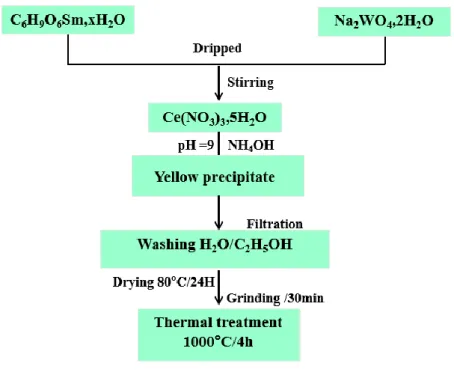
Synthesis. The Ce(2-x) Smx (WO4)3 polycrystalline samples were elaborated via a co-precipitation route, using aqueous solutions of different precursors (cerium nitrate, samarium acetate and sodium tungstate). Stoichiometric amounts of Ce (NO3)3.5H2O [Sigma-Aldrich No. 238538,> 99.0%], C6H9O6Sm.xH2O [Alfa-Aesar No. 14604,> 99.0%] and Na2WO4, 2H2O [Sigma-Aldrich
No. 72069,> 99.0%] were dissolved in 50 ml of distilled water to individually prepare 2g of Ce (2-x)Smx (WO4)3. Both solutions of C6H9O6Sm.xH2O and Na2WO4.2H2O were added dropwise into the cerium nitrate solution maintaining constant stirring. Yellow precipitates formed after pH adjustment at room temperature. These precipitates were washed three times with distilled water and ethanol. A thermal pretreatment at 80 °C for 24 h was carried out. Finally, each precursor sample was compressed and a thermal treatment at 1000 °C for 4 h was applied, giving rise to Ce(2-x)Smx(WO4)3 samarium ceriumtungstate compound. Fig. 1 describes the preparation process of precursor.
Fig. 1: Synthesis of Ce2-x Smx(WO4)3 polycrystalline samples by coprecipitation method followed by thermal treatment.
Characterizations. X-ray diffraction (XRD). The XRD patterns were acquired with an
EMPYREAN Panalytical diffractometer, equipped with a copper X-ray source (Cu Kα1-Kα2 doublet: λ= 1.540/1.544 Å), operating at V = 45 kV and I = 35 mA, with a Ni filter eliminating the Kβ radiation and a rotating sample holder. The diffractometer was equipped with a Pixcel-1D-Detector. The XRD analysis was carried out using the classical θ–2θ configuration, in continuous mode, with a step size of 0,0032826 °, a scan speed of 0,001394 °/s.
Rietveld analysis using the classical Fullprof software [18] was performed to determine the cell parameters and evaluate the crystallization levels through profile analyses. The initial crystal structure data of Gressling et al. in 1995 [13] were used to refine the as-obtained structures.
Scanning electron microscopy (SEM) analyses. SEM analyses were carried out to characterize
the morphology and the local composition of the materials. Images were obtained with a SUPRA 40 VP COLONNE GEMINI ZEISS scanning electron microscope (SEM).
Photoluminescence analyses. The equipment used to perform the measurements of
luminescence under UV was a spectrometer Horiba Jobin-Yvon HR800 LabRam. All samples were in form of powders and the wavelength of excitation of an Ar-ion laser was 364.5 nm. The power applied to the samples was fixed to 0.005 mW, with an acquisition time set to 5 s. All spectra were recorded in the range [300 - 1200 nm]. For the luminescence under X-ray excitation, the copper X-ray source of the diffractometer Empyrean-Panalytical was used to irradiate the samples and perform luminescence experiments. The nominal emission conditions were 45 kV /35 mA.
III- RESULTS
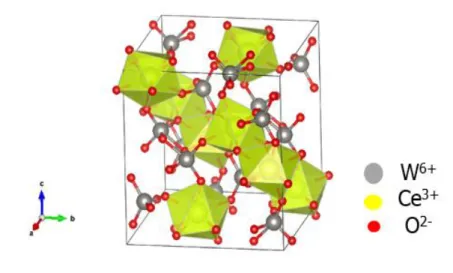
Structure and morphology. Using the atom coordinates of authors [13], the crystal structure of
Ce2(WO4)3 is shown in Fig. 2. It is constituted of WO4 and WO5 groups linked to CeO8 polyhedra.
Fig. 2: Crystal structure of Ce2(WO4)3.
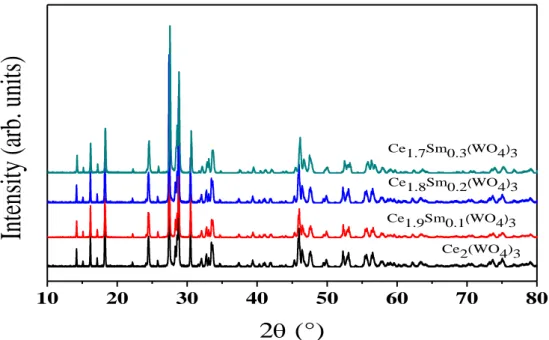
Fig. 3 reports the diffractograms of the Ce(2-x)Smx(WO4)3 system (0 ≤ x ≤ 0.3), obtained after thermal treatment at 1000 °C during 4 h. The analysis of the diffraction profiles shows good crystallization of the synthesized materials with the presence of a minority CeO2 residual phase.
Fig. 3: XRD pattern of Ce2-x Smx(WO4)3 0 ≤ x ≤ 0.3 obtained after thermal treatment at 1000 °C.
Fig.4: Enlargement of the angular domain between 24 et 34 ° (2θ)
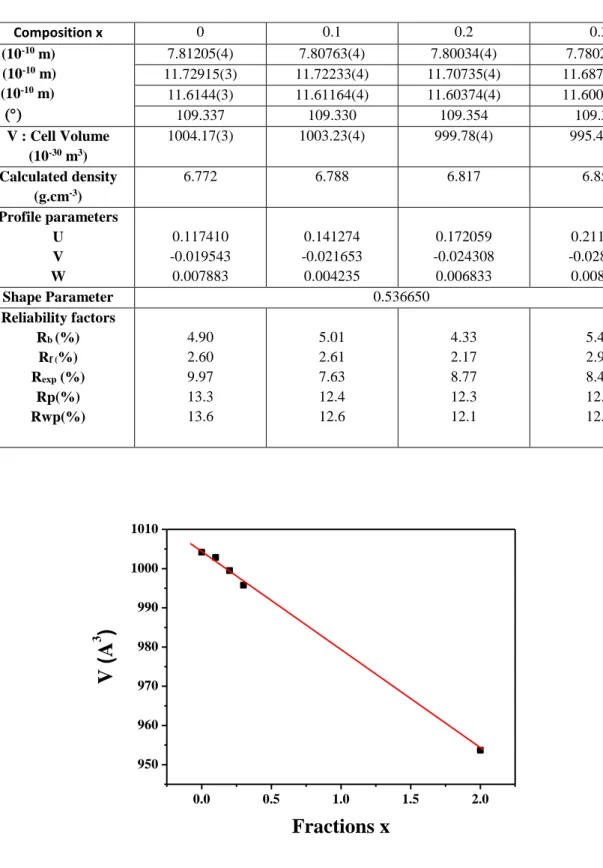
To determine the structural evolution, Rietveld refinement procedure was applied. The atom coordinates given in annex were fixed during the refinements: this was necessary because of the limited data delivered by powder diffraction and the high number of variable atom coordinates. Using the XRD analysis of the Ce2(WO4)3 (x=0) considered as a standard, the refinements consisted in determining the cell parameters and the variations of full width at half maximum (FWHM) as a function of composition x. Table 1 reports the cell parameters and volumes of the Ce(2-x)Smx(WO4)3 samples thermally treated at 1000°C. Fig. 5 shows the variations of cell
10 20 30 40 50 60 70 80 Ce1.7Sm0.3(WO4)3
Int
en
sit
y (arb.
u
nit
s)
2
(°)
Ce2(WO4)3 Ce1.9Sm0.1(WO4)3 Ce1.8Sm0.2(WO4)3 24 25 26 27 28 29 30 31 32 33 34 Ce1.7Sm0.3(WO4)3Intensity (ar
b. units)
2
(°)
Ce2(WO4)3 Ce1.9Sm0.1(WO4)3 Ce1.8Sm0.2(WO4)3volumes V as a function of x. A quasi-linear correlation is observed with the volume of the Sm2(WO4)3 isomorphous [16].
Table 1: Rietveld structure refinement of the Ce(2-x)Smx(WO4)3 samples thermally treated at 1000 °C. Cell parameters, volume, density, profile parameters, reliability factors.
Fig. 5: Variation of volume V (in Å3) as a function of x of Ce
(2-x)Smx(WO4)3. Volume of Sm2(WO4)3 for x=2 from ref. [16].
Composition x 0 0.1 0.2 0.3 a (10-10 m) b (10-10 m) c (10-10 m) 7.81205(4) 7.80763(4) 7.80034(4) 7.78022(4) 11.72915(3) 11.72233(4) 11.70735(4) 11.68704(4) 11.6144(3) 11.61164(4) 11.60374(4) 11.60053(4) 109.337 109.330 109.354 109.308 V : Cell Volume (10-30 m3) 1004.17(3) 1003.23(4) 999.78(4) 995.47(4) Calculated density (g.cm-3) 6.772 6.788 6.817 6.850 Profile parameters U V W 0.117410 -0.019543 0.007883 0.141274 -0.021653 0.004235 0.172059 -0.024308 0.006833 0.211064 -0.028276 0.008855 Shape Parameter 0.536650 Reliability factors Rb (%) Rf (%) Rexp (%) Rp(%) Rwp(%) 4.90 2.60 9.97 13.3 13.6 5.01 2.61 7.63 12.4 12.6 4.33 2.17 8.77 12.3 12.1 5.48 2.99 8.49 12.2 12.3 0.0 0.5 1.0 1.5 2.0 950 960 970 980 990 1000 1010
V
(A
3)
Fractions x
Fig.6 shows SEM images of the polycrystalline phases constituting complex particle size
distributions. A gradual evolution of morphologies and grain sizes is observed when the composition x increases.
- For the compound CeW (x=0), we observe a majority of crystallites of micrometric sizes, faceted smooth and regular, having grain boundaries.
- For the composition of x=0.1, large crystallite sizes are observed, with facets containing cavities.
- For compositions 0.2 and 0.3, the crystallites are of varying large sizes (> 5 m) and are covered by thin particles with submicronic sizes.
Fig.6. a,b,c,d: SEM images of the Ce(2-x)Smx(WO4)3 samples thermally treated at 1000°C; (a) x=0; (b) x=0.1; (c) x=0.2; (d) x=0.3.
XRD profile analyses. Having regard to the complexity of XRD profiles of these monoclinic
structures, where many observed peaks are the superposition of different (h,k,l) Bragg peaks, it was not possible to determine the individual broadening of Bragg peaks in the full diffraction angle range. So, we have used the results of Rietveld refinements to determine individual calculated full width at half maximum (FWHM) for each (h,k,l) Bragg peak.
Considering the sample x=0 as a standard, we have determined the modifications of each observed FWHM for x>0 and ascribed the additional FWHM increase to substitution effect. The resulting size and/or distortion effects were determined by applying a Williamson Hall test. As a first step, it was necessary to carry out corrections using Lorentzian model as a simplified approach. The corrected FWHMs, noted as were calculated from the difference between the observed FWHMobs for x>0 and the value FWHMobs for x = 0 for each (h,k,l) reflection:
= FWHMobs (x) – FWHMobs (x=0). Then, the Williamson-Hall test was performed by reporting vs. sin:
Δ2θ.cosθ = 0.9 / L + 4ɛ.sin θ (1)
In this expression (1), is the Bragg angle, is the wavelength (1.54 Å), L is an hypothetical average grain size or coherence length, and ɛ is the lattice distortion defined as the averaged ratios a/a, b/b and c/c, or 1/3 V/V. The calculations gave insignificant L values (close to 0 with large uncertainties) and only distortion values were obtained. This is congruent with our SEM analyses showing that the major population of crystallites had sizes greater than 1 m. So, we have assumed that only distortion effects must be considered in the X-ray diffraction analyses.
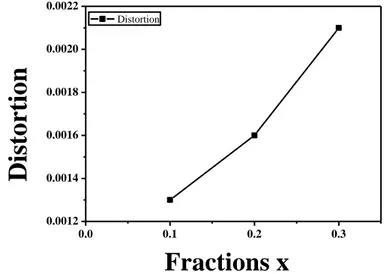
Fig.7 shows the increasing values of distortions (x) which are due to combined effects of
different cation sizes of Ce3+ and Sm3+, and of defects generated during crystal growth. It should be noted that these values were calculated considering the x=0 sample as a standard without any distortion due to substitution. However, it is necessary to note that initial distortions due to crystal growth could not be considered in this approach.
Fig. 7: Variations of lattice distortion ɛ as a function of composition x.
Luminescence properties. The photoluminescence spectra obtained under X-Ray (45 kV-35
mA) and UV (364.5 nm) excitations are shown in Figs. 8 a,b,c,d and Figs. 9 a,b,c,d respectively. Emissions of Ce3+ and Sm3+ observed under UV excitation correspond respectively to the two
[2Eg , 2T2g ] → 2F7/2,5/2 (j =7/2, 5/2) transitions and to the four 4G 5/ 2 → 6HJ (with j = 5/2, 7/2, 9/2, 11/2 ) transitions respectively [19]. The Sm3+ emissions are observed in PL experiments under X-ray excitation. We note first that the charge transfer (CT) in WO4 groups (blue emission) is not observed under X-ray excitation and its presence is questionable in the case of UV excitation. We note also that the luminescence analysis under X-Ray excitation showed the absence of two Ce3+ components (497, 524 nm). The two additional emissions at 619 nm and
664 nm cannot be attributed directly to the Ce3+ emission center. The luminescence in the 400-1200 nm spectral range is characterized by a broad spectral band [850-1000 nm].
0.0 0.1 0.2 0.3 0.0012 0.0014 0.0016 0.0018 0.0020 0.0022
Dist
ort
ion
Fractions x
DistortionA detailed analysis of the variations of intensities shows that, as x increases:
The weak Ce3+ emission intensities close to 500 nm (2.5 eV), only observed under UV excitation, first increase then decrease;
The emission intensities at 617-619 and 644-645 nm observed under UV and X-ray excitations are strong, first increase then decrease;
The emission intensities associated with Sm3+ transitions are relatively strong and continuously decrease;
The broad emission spectrum in the 800 to 1000 nm IR range, with a maximum at 900 nm, is observed under both UV and X-ray excitations, however it is strongly increasing in the case of UV excitation.
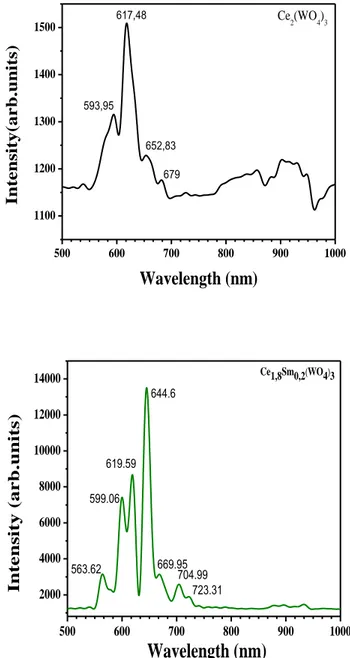
Fig. 8 a,b: Photoluminescence spectra under X-Ray excitation (45 kV-35mA) of Ce2-xSmx(WO4)3 system with x=0, 0.1. 500 600 700 800 900 1000 1100 1200 1300 1400 1500 Ce2(WO4)3 Int ensity (ar b.un its) Wavelength (nm) 593,95 617,48 652,83 679 500 600 700 800 900 1000 2000 4000 6000 8000 10000 12000 14000 Ce1,8Sm0,2(WO4)3 Int ensity (a rb.units)
Wavelength (nm)
563.62 599.06 619.59 644.6 669.95 704.99 723.31
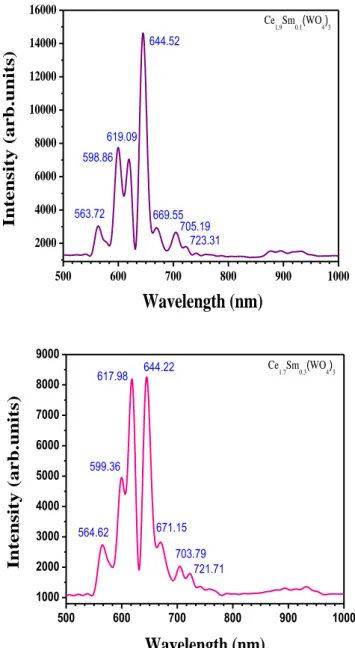
Fig. 8 c,d: Photoluminescence spectra under X-Ray excitation (45 kV-35mA) of Ce2-xSmx(WO4)3 system with x=0.2, 0.3. 500 600 700 800 900 1000 2000 4000 6000 8000 10000 12000 14000 16000 Ce 1.9Sm0.1(WO4)3 Int ensity (a rb.units)
Wavelength (nm)
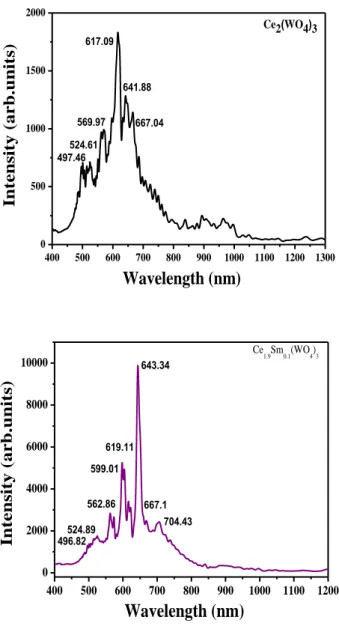
563.72 598.86 619.09 644.52 669.55 705.19 723.31 500 600 700 800 900 1000 1000 2000 3000 4000 5000 6000 7000 8000 9000 Ce 1.7Sm0.3(WO4)3 In tensity (arb. un its) Wavelength (nm) 564.62 599.36 617.98 644.22 671.15 703.79 721.71Fig. 9 a,b: Photoluminescence spectra under UV excitation (excitation = 364.5 nm) of Ce2-xSmx(WO4)3 system with x=0, 0.1.
400 500 600 700 800 900 1000 1100 1200 1300 0 500 1000 1500 2000 Ce2(WO4)3 Wavelength (nm) Int ens ity ( arb.unit s) 569.97 617.09 641.88 497.46 524.61 667.04 400 500 600 700 800 900 1000 1100 1200 0 2000 4000 6000 8000 10000 496.82 Ce 1.9Sm0.1(WO4)3 Wavelength (nm) I nt ens ity ( arb.unit s ) 643.34 704.43 619.11 599.01 562.86 524.89 667.1
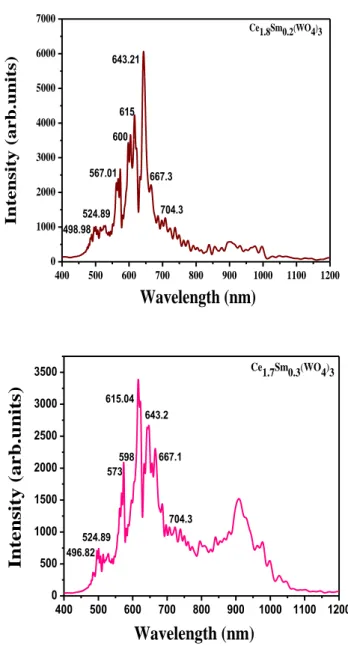
Fig. 9 c,d: Photoluminescence spectra under UV excitation ((excitation = 364.5 nm) of Ce2-xSmx(WO4)3 system with x=0.2, 0.3.
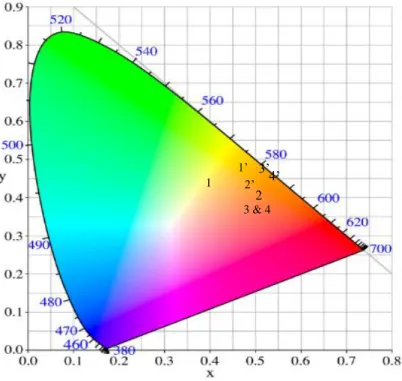
Chromaticity diagrams. The colors associated with the various PL spectra are represented in
the classical CIE chromaticity diagrams. The CIE coordinates associated with PL emissions under X-ray and UV excitations are reported in Table 2.
400 500 600 700 800 900 1000 1100 1200 0 1000 2000 3000 4000 5000 6000 7000 704.3 Wavelength (nm) Ce1.8Sm0.2(WO4)3 In tensity (arb. un its) 498.98 524.89 567.01 615 600 643.21 667.3 400 500 600 700 800 900 1000 1100 1200 0 500 1000 1500 2000 2500 3000 3500 598 524.89 Ce1.7Sm0.3(WO4)3 Wavelength (nm) Intensity (a rb.units) 496.82 573 615.04 643.2 667.1 704.3
Table 2: CIE coordinates (xCIE, yCIE) for PL emissions of the Ce2-xSmx(WO4)3 compounds. X-ray excitation Composition 0 0.1 0.2 0.3 xCIE 0.39 0.50 0.50 0.50 yCIE 0.38 0.36 0.35 0.35 UV excitation Composition 0 0.1 0.2 0.3 xCIE 0.47 0.49 0.52 0.53 yCIE 0.43 0.41 0.42 0.42
Fig. 10: Chromaticity diagram for Ce2-xSmx(WO4)3 system under both excitations. Under X-ray excitation, points are noted as 1 for x=0, 2 for x=0.1, 3 for x=0.2 and 4 for x=0.3. Under UV excitation points are noted as 1’ for x=0, 2’ for x=0.1, 3’ for x=0.2, 4’ for x=0.3.
IV- DISCUSSION.
In the present work, we managed to form a solid solution of cerium samarium tungstate, in the Sm composition range 0 to 0.3. The quasi-linear decrease of cell parameters shows that
1 2 3 & 4 1’ 2’ 3’ 4’
substitution of Ce3+ by Sm3+ has been successfully completed (Table 1). Using an adapted profile diffraction analysis extracted from Rietveld method, increasing lattice distortions due to increasing composition x were clearly evidenced. This clearly shows that this disordered solid solution is constituted of a disordered distribution of Sm in the lattice, with local bond length variations and with local defects (vacancies and local distortions) likely to play the role of emission centers. The photoluminescence was observed under polychromatic X-ray and monochromatic UV excitations.
It should be recalled that Anna M. Kaczmarek et al [14] in their study of the two Ce2(WO4)3 and Ce10W22O81 phases doped with Tb3+ observed some changes in the luminescence spectra depending on morphologies. The authors proposed different energy transfer (ET) mechanisms for the two cerium tungstate materials. In a recent work [20], other authors proposed a complex system of energy levels due to oxygen vacancies. In agreement with their approach, using the classical notation of Kröger and Vink for point defects, we assume that, in the present solid solution, three types of oxygen vacancies neutral or positively charged (noted Vq° with q = 0, 1, 2) can be formed:
Neutral Vx oxygen vacancies with 2 trapped electrons occupying an orbital (also noted as F0 by authors [20])
Singly charged V° oxygen vacancies with 1 trapped electron (noted as F+ [20])
Doubly charged V°° oxygen vacancies with 0 electron (noted as F++ [20]): this defect can trap one or two electrons, however, it cannot have any excited state.
Under photonic excitation, the Vx and V° defects can reach excited states noted Vx* (close to V° or V°°) and V°* (close to V°°). The V°° cannot be excited (no electron present).
According to these hypotheses, at least four PL transitions could be expected: 1 electron in level Vx* transiting to level Vx to form Vx (2e-);
then: Vx (2e-) transiting to holes in O2p valence band;
1 electron in level V°* transiting to level V° to form V° (1e-); then: V° (1e-) holes in O2p valence band.
Considering the energy gap Eg of the extreme compounds Ce2(WO4)3 and Sm2(WO4)3 of about 3.5 and 3.8 eV respectively, all intermediate levels associated with vacancies have energies less than 3 eV.
The two PL emissions at 495 and 525 nm (blue -green emissions) can be attributed to the Ce3+ transitions involving the two 2F5.2, 7/2 states. The two PL emissions at 619 and 664 nm (orange-red emissions) can be attributed to the two transitions Vx* Vx and V°* V°. The PL emissions in the IR range (large spectrum between 800 and 1000 nm with maximum at 900 nm) can be attributed to transitions (Vx , V°) holes in O2p orbitals.
It should be noted that the 2 emissions associated with Ce3+ and the 2 additional emissions are constituted of thin bands and could be also associated with typical defect clusters: W6+ - VO (q°) – Ce3+ and Ce3+ - V
O (q°) – Ce3+. Each complex defect can act as emission center with different emissions due to the two main excited states of vacancies and the emissions due to excitation of 4f1 electron of Ce3+.
In the case of UV excitation, PL emissions are mainly generated by grain surfaces and given the low energy of irradiation (3.6 eV), excited electrons can jump up to the bottom of CB. In the
case of X-ray excitation, the penetration of X-rays concerns the bulk of grains and due to the high energy polychromatic beam, excited electrons jump in higher energy levels, which modifies the transition conditions and can be at the origin of a complex quenching process.
The CT transitions W5d O2p are fully quenched in our experiments because of the existence of different levels acting as trapping centers (Ce3+, Sm3+, defects).
The increasing red and IR emission intensities as Sm3+ content increases (and Ce3+ content decreases) are directly correlated to the presence of increasing number of defects (vacancies and distortions of oxygen polyhedra).
In addition to the thin emission peaks, a very large continuous emission covering the range 500 to 1000 nm is observed: this means that a large distribution of defects and local structural distortions exist in relation with the distortions observed in the above X-ray diffraction analysis due substitution and presence of vacancies and clusters Ce-VO-W.
Table 3 reports the different PL emissions observed under UV and X-ray excitations and their
attributions. Fig. 11 is a schematic representation of the various transitions.
Table 3: Photoluminescence emissions under UV and X-ray excitations observed in the series Ce2-xSmx(WO4)3. Transitions generated by presence of oxygen vacancies Vx , V° and V°°.
UV excitation X-ray excitation Attributions
Wavelength (nm) Color
Energy (eV) Wavelength (nm) Color Energy (eV) Transitions Ce3+ and Sm3+ 497.75 Green 2.49 No emission Ce: 2T2g / 2D 3/2 2F7/2 524.61 Green 2.36 No emission Ce: 2T2g / 2D 5/2 2F5/2 564.33 Yellow 2.19 563 Yellow 2.20 Sm: 4G 5/2 -> 6H5/2 600.50 Orange 2.064 599 Orange 2.070 Sm: 4G 5/2 -> 6H7/2 616.56 Orange 2.013 617 Orange 2.009 V°* V° 643.2 Red 1.927 644 Red 1.925 Sm: 4G 5/2 -> 6H9/2 667 Red 1.859 669 Red 1.853 Vx* Vx 705 Dark red 1.759 705 Dark red 1.759 Sm: 4G 5/2 -> 6H11/2 900 Large IR 1.38 880 Large IR 1.41 V° holes O2p 950 Large IR 1.30 930 Large IR 1.33 Vx holes O2p
Fig. 11: Schematic representation of PL transitions in samarium cerium tungstates. Oxygen vacancies noted as Vx, V°, V°°. VB = valence band with O2p orbitals. CB = conduction
band with W5d and Ce5d orbitals.
V-
CONCLUSION.
The solid solution Ce2-xSmx(WO4)3 with x≤0.3, obtained by coprecipitation followed by thermal treatment at 1000 °C, is characterized by two PL emissions of Ce3+ observed only under UV excitation, and 4 PL emissions of Sm3+ observed under UV and X-ray excitations. Two additional transitions are observed under UV and X-ray excitations and are attributed to oxygen vacancy defects. As composition x increases, we observe a weak increase then a decrease of transition intensities linked to cerium, and a decrease of samarium PL emissions. The quenching effects observed in this material are probably amplified by the presence of defects increasing in number with x. The IR emission observed in the case of UV and X-ray excitations increases with x: this argues in favor of increase of the number of structural defects as x increases. To conclude, this series of solid solution presents different PL spectra under UV and X-ray excitations. The chromaticity diagram shows that the colors associated with PL responses vary with Sm composition and excitation energies (X-ray or UV). This offers the opportunity to develop materials with tunable PL. To better understand this complex behavior, now, we plan to study the solid solution in the composition range 0.3<x≤2.
ANNEX: atom coordinates for Rietveld calculations
The refined atom coordinates of T. Gressling et al. [13] were used to apply the Rietveld method to each X-ray diffraction pattern.
Ce 8f 0,3212 0,3734 0.4048 W(l) 4e 0.0 0,1184 0,25 W(2) 8f 0.1543 0,3547 0,0479 O(1) 8f 0.0129 0,0404 0,3874 O(2) 8f 0,1915 0,2056 0,2781 O(3) 8f 0,0717 0,3008 0.4620 O(4) 8f 0.2184 0,4265 0,1915 O(5) 8f 0.1383 0,5370 0,4402 O(6) 8f 0.3831 0.2858 0,0765
ACKNOWLEDGEMENTS: This work is part of the thesis by Kaouther DERRAJI and was
financially supported by the Regional Council of Provence-Alpes-Cote d’Azur and CeSigma company. It was carried out in the general framework of a collaboration between IM2NP laboratory, CEA of Cadarache and CeSigma company.
R
EFERENCES[1] Jinsheng Liao, BaoQiu, Huasheng Lai. Journal of Luminescence, Vol. 129 (2009), p. 668 [2] A.Taoufyq, F. Guinneton, J-C. Valmalette, M. Arab, A. Benlhachemi, B. Bakiz, S. Villain, A. Lyoussi, G. Nolibe, J-R. Gavarri, J. of Sol. St. Chem. 219 (2014) 127-137.
[3] A.Hallaoui, A.Taoufyq, M. Arab, B. Bakiz, A. Benlhachemi, L.Bazzi, S. Villain, J-C. Valmalette, F. Guinneton, J-R. Gavarri, J. of Sol. St. Chem. 227 (2015) 186-195.
[4] A.Hallaoui, A.Taoufyq, M. Arab, B. Bakiz, A. Benlhachemi, L.Bazzi, S. Villain, J-C. Valmalette, F. Guinneton, J-R. Gavarri, J. of Materials Research Bulletin. 79 (2016) 121-132. [5] A.Hallaoui, B. Bakiz A.Taoufyq, A. Benlhachemi, F. Guinneton, S. Villain, M.Ezahri, J-C. Valmalette, M. Arab, J-R. Gavarri, J. of Solid State Chemistry. 258 (2018) 146-155.
[6] Jinsheng Liao, BaoQiu, Huasheng Lai. Journal of Luminescence, Vol. 129 (2009), p. 668 [7] Qilin Dai, Hongwei Song, Xue Bai, et al. J Phys Chem C, Vol. 111 (2007), p. 7586
[8] Ying Guo, Meng Sun, Wanmei Guo, et al. Optics & Laser Technology, Vol. 42 (2010), p. 1328.
[9] K.V. Dabre, S.J.Dhoble, JyotiLochab, Journal of Luminescence 149 (2014) 348–352 [10] F. Kang, Y. Hun, L. Chen, X. Wang, H. Wu, Z. Mu, J. Lumin. 135 (2013) 113. [11] Z. Lou, M. Cocivera, Mater. Res. Bull. 37 (2002) 1573.
[12] M.V. Korzhik, V.B. Pavlenko, T.N. Timoschenko, V.A. Katchanov, A.V. Singovskii, A.N. Annenkov, V.A. Ligun, I.M. Solskii, P. Peigneux, Phys. Status Solidi A 154 (1996) 779. [13] T. Gressling and Hk. Müller-Buschbaum, Z. Naturforschung, 1995, 50b, 1513.
[14] Anna M.Kaczmarek, Dorine Ndagsi, Isabel Van Driessche, Kristof Van Hecke and Rik Van Deun, Dalton Trans., 2015, 44, 10237.
[15] Bai Sun, Xiaoping Li, Dandan Liang, Peng Chen, Chemical Physics Letters, 643, (2016) 66-70.
[16] Wenyan Zhanga, Chunhua Lub, Le Chenc, Yaru Nid, Zhenyu Baoe, Zhongzi Xu, Advanced Materials Research Vols. 239-242 (2011) pp 1964-1967.
[17] C.R. Ronda, Luminescent Materials: From Theory to Applications, Wiley-VCH, New York, 2007.
[18] J. Rodriguez-Carvajal, Fullprof Program, Physica B, 55, 192 (1993), and http://www.ill.eu/sites/fullprof/
[19] Cuimiao Zhang, Jinyu Zhang, Yanshen Li, Journal of Alloys and Compounds, 33-38, 14 December 2017.
[20] Saurabh Tiwari, Gyanendra Rathore, N. Patra, A.K. Yadav, Dibyendu Bhattacharya, S.N. Jha, C.M. Tseng, S.W. Liu, Sajal Biring, Somaditya Sen, Journal of Alloys and Compounds, Vol. 782, 2019, 689-698.