HAL Id: hal-01059360
https://hal.archives-ouvertes.fr/hal-01059360
Submitted on 29 Aug 2014
HAL is a multi-disciplinary open access
archive for the deposit and dissemination of
sci-entific research documents, whether they are
pub-lished or not. The documents may come from
teaching and research institutions in France or
L’archive ouverte pluridisciplinaire HAL, est
destinée au dépôt et à la diffusion de documents
scientifiques de niveau recherche, publiés ou non,
émanant des établissements d’enseignement et de
recherche français ou étrangers, des laboratoires
Temperature increase of Zircaloy-4 cladding tubes due
to plastic heat dissipation during tensile tests at 0.1-10
s–1 strain rates
Arthur Hellouin de Menibus, Quentin Auzoux, Jacques Besson, Jérôme Crépin
To cite this version:
Arthur Hellouin de Menibus, Quentin Auzoux, Jacques Besson, Jérôme Crépin. Temperature increase
of Zircaloy-4 cladding tubes due to plastic heat dissipation during tensile tests at 0.1-10 s–1 strain
rates. Journal of Nuclear Materials, Elsevier, 2014, 454 (1-3), pp.247-254. �hal-01059360�
Temperature Increase of Zircaloy-4 Cladding Tubes due to Plastic Heat Dissipation
during Tensile Tests at 0.1 to 10 s
-1Strain Rates
Arthur Hellouin de Menibus1, Quentin Auzoux2, Jacques Besson3 and Jérôme Crépin3 1 CEA Saclay, DMN/SRMA, 91191 Gif Sur Yvette, France
2CEA Saclay, DMN/SEMI, 91191 Gif Sur Yvette, France
3MinesParistech, 10 rue Henri-Auguste Desbruères, 91100 Corbeil-Essonnes, France
Keywords: Zirconium, Zircaloy-4, Plastic Dissipation, Infrared, Reactivity Initiated Accident
Corresponding author at: CEA Saclay/DEN/DANS/DMN/SRMA, 91191 Gif sur Yvette, France. Tel.:+33 1 69 08 39 43; fax: +33 169 08 71 67, email: arthur.hellouin-de-menibus@cea.fr
Article published in the Journal of Nuclear Materials Volume 454, Issues 1–3, November 2014, Pages 247–254 (Available online 20 August 2014)
http://www.sciencedirect.com/science/article/pii/S0022311514005388
ABSTRACT
This study is focused on the impact of rapid Reactivity Initiated Accident (RIA) representative strain rates (about 1 s-1 [1]) on the behavior and fracture of unirradiated Cold Work Stress Relieved Zircaloy-4 cladding tubes. Uniaxial ring tests (HT) and plane strain ring tensile tests (PST) were performed in the 0.1 to 10 s-1 strain rate range, at 25 °C. The local temperature increase due to plastic dissipation was measured with a high-speed infrared camera.
Limited temperature increases were measured at 0.1 s-1 strain rate. Limited but not strongly localized temperature increases were measured at 1 s-1. Large temperature increase were measured at 5 and 10 s-1 (142 °C at 5 s-1 strain rate in HT tests). The local temperature increase induced heterogeneous temperature fields, which enhanced strain localization and resulted in a reduction of the plastic elongation at fracture.
INTRODUCTION
The hypothetical control rod ejection in a Pressurized Water Reactor leads to a rapid RIA, which triggers rapid thermal expansion of the fuel pellets. These pellets expansion induced a strain-controlled loading on the cladding at approximately 1 s-1 circumferential strain rate [1]. This phase is referred to as PCMI (Pellet Cladding Mechanical Interaction). Such a 1 s-1 strain rate is susceptible to cause an important increase of the cladding temperature due to plastic heat dissipation. The aim of the present study is to quantify this temperature increase and its effect on the Zircaloy-4 cladding tubes behavior and fracture.
The temperature increase due to plastic heat dissipation assuming adiabatic conditions can be estimated for uniaxial ring tensile tests (Figure 1) performed on unirradiated Zircaloy-4, using the following equation:
̇ ̇ (eq. 1)
where is the uniaxial stress (MPa), ̇ is the plastic strain rate (s-1), is the material density (kg/m3), is the specific heat (J/kg/K) and is the Taylor-Quinney coefficient [2, 3]. The β coefficient varies with plastic strain [4] and can be greater than one. Indeed, the heat released during a given time period is the plastic energy dissipated into heat plus a possible release of energy previously stored in the material [5]. Regarding pure zirconium, it was shown that the β coefficient depended on the material crystallographic texture: it is higher in non-basal than in basal directions [6]. More precisely, the results in [6] suggest that setting
β=90% is an acceptable assumption when stretching the samples in directions parallels to zirconium <a> axis. In directions parallels to <c> axis, β increases from 50% to 75% from 0% to 10% plastic strain, and remains almost constant for higher plastic
strain. In CWSR Zircaloy-4 cladding tubes, the crystallographic texture is such that <c> axis are mostly in the radial-circumferential plane at 30° to the radial direction [7]. Therefore, the axial direction corresponds to a non-basal direction, following which β=90%. The circumferential direction is not purely non basal, one may assume it results in β=50%-90%. To
estimate an upper bound for the temperature increase, a value of β=90% was used and the stress level was assumed to be constant and equal to the maximum stress. Therefore, equation 1 can be integrated from zero to a given plastic strain level (p) considering β is independent of plastic strain:
(eq. 2)
The temperature increase at fracture is about 270 °C using the maximum stress and the plastic elongation at fracture:
(eq. 3)
With the elongation at fracture, the calibrated gauge length equal to 3 mm, the stress at fracture and E the elasticity modulus.
Considering the maximum duration of a CABRI test (76.4ms for REP-Na4 [8]), the thermal diffusion distance √ , with
the thermal diffusivity of zirconium (m2/s) [9] and the time (s), is about 0.7 mm. Thus, the diffusion distance is similar to the
sample dimensions (0.57 mm in thickness for instance). As a consequence, adiabatic conditions are not fulfilled in RIA conditions. The local maximum temperature increase due to plastic heat dissipation is expected to decrease when the pulse duration increases. The effect of a local temperature increase on the fracture strain (at local and at macroscopic scale) is not trivial. On one hand the temperature increase may increase the material ductility, but on the other hand the induced heterogeneous thermal field could promote strain localization.
In order to measure the local heating at RIA strain rates and its potential impact on the behavior and fracture, uniaxial tensile test on ring and plane strain tensile tests were performed at strain rates ranging from 0.1 to 10 s-1 at 25 °C on Zircaloy-4 cladding tubes and were monitored with a high-speed infrared camera. First, the thermal fields measured during such tests are described and their impact on the mechanical behavior and fracture is discussed. Then, the temperature increase at higher temperature (350 °C and 480 °C) is theoretically estimated using the energy balance.
MATERIAL
The studied material consisted in 9.5 mm external diameter and 0.57 mm thickness tubes of Cold Worked Stress Relieved (CWSR) unirradiated and non hydrided Zircaloy-4 provided by CEZUS Company®. The grain size measured by statistical analysis of polarized light optical pictures was 2.5±0.7 µm in radial, 3.7±0.7 µm in circumferential and of about 10 µm in the tube axial direction. This material was obtained with the standard manufacturing route for CWSR Zircaloy-4. For this route, most of the zirconium <c> axis are oriented at ±30° to the tube radial direction and one of the ̅ direction is aligned with the tube axial direction [7].
PROCEDURES
a. Tensile tests
Uniaxial ring (Figure 1) and plane strain ring tensile tests (Figure 2) were performed. In the following, they would be referred to as HT for Hoop Tensile test and PST for Plane Strain Tensile tests, respectively. The HT gauge section was 2 mm wide (W) and 3 mm (L0) long. The PST geometry has no clearly calibrated gauge length because stress and strain fields are heterogeneous
in PST samples. However, the gauge section was considered equal to the notches diameter L0=2 mm in order to derive from the
displacement a macroscopic strain value. During a PST test at 25 °C, it was shown by Le Saux [10] that a centered area of 1 mm in circumferential direction and 2 mm in axial direction reaches plane strain conditions. Both types of tensile tests were done using two 8.30 mm diameter D-shape mandrels on an INSTRON servo-hydraulic tensile machine (Figure 3). No “dog-bone” part was used and no lubricant was inserted between mandrel and ring. Above 1 kN, the accuracy of the load measurements is better than 0.1%, and the discrepancy on the imposed strain rate is lower than 0.3%. The load-displacement curve was recorded with a 1024 Hz frequency.
b. Infrared monitoring
The tests were monitored with a FLIR SC7000 high-speed infrared camera at frame rates up to 3600 Hz. The spatial resolution of the infrared measurement was 70 µm/pixel in HT tests and 110 µm/pixel in PST tests. Before the tensile tests, a 7778 BBQ black RUSTOLEUM®black paint coating was hand sprayed in a reproductive manner. The coating thickness was ranging from 10 µ m to 15 µm based on scanning electron microscope cross sections observations. Comparison of infrared camera
and thermocouple measurements showed that the coating emissivity was at room temperature and was constant up to 200 °C. It was checked that a 5% uncertainty on the emissivity results in a 0.4 °C uncertainty on the absolute temperature at 25 °C, and a 1.9 °C uncertainty at 90 °C. The HT tests were monitored with the infrared camera at a 30° angle from the normal to the sample gauge section, and PST tests with a 0° angle. The reason of the tilted angle is HT samples were also monitored with a high speed optical camera for DIC application. The tilted angle is not an issue regarding the temperature measurements because it was shown by Poncelet [11] that the emissivity of highly emissive black coatings remained constant up to a 45° angle. In the following, all the thermal measurements are expressed as relative temperature ( ) to get rid of any parasitic reflections that were supposed not to vary during the tests short durations (the longest test lasted less than 5.5 s).
Figure 1: HT sample drawing.
Figure 2: PST sample drawing.
Figure 3: Black painted PST sample placed on the D-shape mandrels. c. Thickness reduction at fracture and elongation at fracture measurements
The thickness reduction at fracture Δe/e was measured with an optical macroscope on the radial axial plane, with 20
measurements on both sides of the fractured specimens. The uncertainty on the average plastic strain in the thickness direction was estimated to be 1.5% for PST samples and 0.6% for HT samples. The HT thickness reduction was measured in the center of the 2 mm gauge section, in a 0.3 mm axially extended area.
Plastic elongation at fracture was calculated from the load-displacement curves and the gauge lengths defined above.
RESULTS
HT tests and PST tests both require a limited quantity of material. The loading biaxiality level in HT tests is mainly uniaxial in the circumferential direction, which not representative of the loading biaxiality expected in RIA conditions that is from plane strain to equibiaxial conditions. Thus, PST tests, which allow reaching plane strain conditions, were also performed.
The mechanical test results and associated temperature measurements are listed for each individual test in Table 1. Averaged values for each type of tests are presented in Table 2. The parameter is the yield stress (MPa), is the maximum stress (MPa), (%) is the plastic strain at the maximum load, is the thickness reduction at fracture, is the average temperature increase at fracture on a gauge section centered area (1.4 x 3.2 mm2 for HT tests and 2.0 x 0.9 mm2 for PST tests) and
Test type
Strain rate (s-1)
Mechanical results Infrared camera measurements
σy0.2 (MPa) σu (MPa) (%) (%) (%) (°C) (°C) At maximum load At fracture At maximum load At Fracture HT 0.1 778 855 2.7 24.7 34.5 1.5 6.2 1.3 11.9 HT 0.1 757 846 3.1 15.2 33.3 1.7 6.3 1.8 12.8 HT 5 839 903 1.5 16.5 36.9 1.3 52.9 2.7 142.0 HT 5 842 911 1.6 18.2 35.4 0.1 48.1 0.7 130.8 HT 5 825 902 1.9 19.1 36.0 0.3 57.5 2 140.9 PST 0.1 808 981 4.2 15.2 13.4 1.5 3.8 1.5 5.9 PST 0.1 788 981 5.1 16.8 20.1 1.7 4.3 1.8 4.8 PST 1 829 993 4.4 14.0 13.8 4.7 22.5 12.0 30.3 PST 1 842 1009 4.6 15.3 14.8 4.9 23.4 10.4 29.1 PST 2.5 848 1006 4.5 11.3 15.5 5.4 29.4 21.0 46.1 PST 5 854 1030 4.3 12.5 17.7 1.9 29.6 17.2 59.8 PST 5 842 1031 3.9 14.1 17.2 1.9 46.3 15.6 74.2 PST 5 848 1024 4.5 12.5 13.3 1.6 25.2 19.3 62.0 PST 5 791 1025 3.9 14.0 20.6 1.9 39.5 14.4 67.1 PST 5 832 1014 4.2 13.1 15.2 1.3 41.0 15.5 67.9 PST 5 850 1018 4.2 10.9 17.1 1.3 22.7 13.4 28.6 PST 10 869 1036 3.5 10.9 15.0 2.4 28.2 25.7 73.6 PST 10 806 1032 3.5 12.5 20.4 0.9 37.5 21.8 84.7
Table 1: Mechanical results and infrared camera measurements of the individual tensile tests performed (initial test temperature is 25 °C). Test type Strain rate (s-1) Number of tests
Mechanical results Infrared camera measurements
σy0.2 (MPa) σu (MPa) (%) (%) (%) (°C) (°C) At maximum load At fracture At maximum load At Fracture HT 0.1 2 768±15 851±6 2.9±0.3 25.0±0.4 33.9±0.8 1.6±0.1 6.3±0.1 1.6±0.4 12.4±0.6 HT 5 3 835±9 905±5 1.7±0.2 17.9±1.3 36.1±0.8 0.6±0.6 52.8±4.7 1.8±1.0 137.9±6.2 PST 0.1 2 798±14 981±0 4.7±0.6 16.0±1.1 16.8±4.7 1.6±0.1 4.1±0.4 1.7±0.2 5.4±0.8 PST 1 2 836±9 1001±11 4.5±0.1 14.7±0.9 14.3±0.7 4.8±0.1 23.0±0.6 11.2±1.1 29.7±0.8 PST 2 1 848 1006 4.5 11.3 15.5 5.4 29.4 21.0 46.1 PST 5 6 836±23 1024±7 4.2±0.2 12.9±1.2 16.9±2.5 1.7±0.3 34.1±9.5 15.9±2.1 63.3±8.8 PST 10 2 838±45 1034±3 3.5±0.0 11.7±1.1 17.7±3.8 1.7±1.1 32.9±6.6 23.8±2.8 79.2±7.8
Table 2: Mechanical tests and infrared camera measurements averaged results. a. HT tests at 25 °C
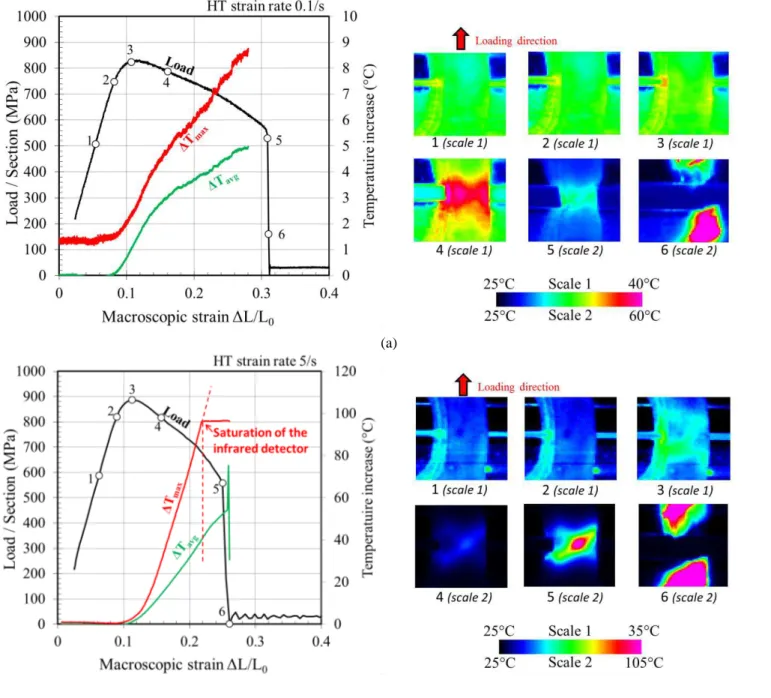
During HT tests at 25 °C, the temperature increase visible on the infrared frames was less localized at 0.1 s-1 than at 5 s-1 due to heat conduction (Figure 4). The infrared detector saturated at 125 °C (100 °C temperature increase). When the temperature increases at fracture were greater than 100 °C, for instance in HT test at 5 s-1 strain rate, the temperature increase evolution was extrapolated following the linear trend of the temperature increase observed since the maximum load. The maximum temperature increase at fracture reached 142 °C at 5 s-1 strain rate, while it was limited to 12 °C at 0.1 s-1. This high local temperature
enhanced the material ductility: the thickness reduction at fracture increases slightly when the strain rate increased from 0.1 to 5 s-1 (Table 2). On the other hand, the heterogeneous temperature field enhanced strain localization in the gauge section: the plastic elongation at fracture ( ) decreased from 25% to 18% (-29%). The strain in the gauge section is clearly more localized at 5 s-1 than at 0.1 s-1 macroscopic strain rate (Figure 5). In addition, higher strain rates led to a steeper load decrease right after the load maximum (Figure 6).
(a)
(b)
Figure 4: Load-displacement evolution and infrared frames in a HT test at (a) 0.1 s-1 and (b) 5 s-1 strain rate. Several temperature scales were used.
Figure 5 : Aspect of additional HT samples gauge length tested at 25 °C on the last frame prior to fracture (6250Hz). Prior to testing, samples surfaces were sputtered with black and white paint drops for digital image correlation purpose
(not detailed in the present paper).
Figure 6: Individual load-displacement in HT tests with the (a) average temperature and (b) maximum temperature evolution, and resulting average evolution.
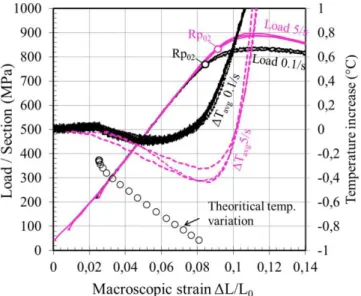
A zoom on the elastic phase of the HT tests showed a thermoelastic effect (Figure 7). The specimen temperature decreased during the tensile loading in the elastic regime. Under adiabatic conditions, the theoretical temperature decrease can be calculated with the following equation:
(eq. 4)
with α the expansion coefficient (K-1), calculated as a weighting of the expansion in zirconium < a > and <c> directions [12]:
(eq. 5) (eq. 6)
with the typical Kearns factors [7] for CWSR claddings equal to in the radial direction and in the circumferential one. The term T is the average temperature (room temperature in the present case, in K), E is the elasticity modulus (GPa), ρ is the material density (kg/m3), C is the specific heat (J/kg/K), Δε is the elastic strain variation. As expected, the measured thermoelastic effect was lower at 0.1 s-1 than at 5 s-1, which was itself lower than the adiabatic estimate due to heat losses by conduction (the elasticity contribution of the tensile machine and setup was assumed to be negligible). The discrepancy
between experimental measurements and the theoretical estimate might also be due to the non-uniform stress distribution in the specimen due to some bending up to 0.5% plastic strain [10]. The decrease in temperature at 5 s-1 was limited to -0.4 °C, which was negligible in comparison to the temperature increase due to plasticity. The good reproducibility of the measurement of the thermoelastic induced temperature variation demonstrated that the setup, procedures and temporal synchronization are sufficiently accurate to capture such a limited effect in a reproducible fashion.
Figure 7: Zoom on the elastic phase showing a thermoelastic phenomenon - load-displacement, maximum and average temperature evolutions during a HT test at 25 °C and 0.1 s-1 and 5 s-1 strain rates.
b. PST tests at 25 °C
During PST tests at 25 °C, similarly to HT tests, the temperature increase was less pronounced at 0.1 s-1 strain rates than at 5 s-1 (Figure 8). The temperature distribution measured at 5 s-1 was in agreement with the circumferential strain map measured by digital image correlation by Le Saux [10]: the circumferential strain is localized at the notches and in two bands that surrounded the central area (the central area is in plane strain).
The maximum temperature increase at fracture was 75 °C at 5 s-1 macroscopic strain rate, while it was about 5 °C at 0.1 s-1 strain rate (Figure 9). Some specimens failed on the opposite side to the one monitored by the infrared camera, the PST sample tested at 5 s-1 showed in Figure 8(b) for instance. The temperature increase was similar whatever the side on which the sample was fractured, as shown by the markers “front” and “back” in Figure 9, which identify the samples that failed in front of the camera or on the opposite side. The temperature increase was mainly located at the notches, where the stress biaxiality was low (uniaxial) while the central area in plane strain conditions showed limited temperature increase.
The fracture of the PST samples tested in the present study were consistent with the scenario described by Le Saux [10]. First, a through thickness plastic strain instability initiated on the inner side in the center of the gauge section and propagated in a plane at 45° to the radial direction. Secondly, the crack propagated axially toward the notches and bifurcated before the complete fracture of the sample. It was observed in the present study that the aspect of the fractured samples was identical whatever the strain rate. Thus, the fracture of PST sample was not initiated where the temperature increase due to plastic dissipation was the highest (at the notches), but were the stress triaxiality level was the highest (in the plane strain area). Consequently, the thickness reduction at fracture was independent of the strain rate. Similar observation was reported in [13] on PST samples when the strain rate was increased from 10-3s-1 to 102 s-1. On the contrary, the plastic elongation at fracture was affected by the temperature increase at the notches. It decreased in -20% when the strain rate was increased from 0.1 to 5 s-1.
As observed in HT tests, a higher strain rate led to a steeper load decrease after the maximum load (Figure 10). The magnitude of the slope was only 1.5 times steeper when the strain rate was increased from 0.1 to 5 s-1 while it was 2.1 times steeper in HT tests. The load maximum was 974 MPa at 0.1 s-1, increased up to 1020 MPa at 1 s-1, and increased up to 1029 MPa at 10 s-1.
(a)
(b)
Figure 8: Load-displacement evolution and infrared frames during a PST test at (a) 0.1 s-1 and (b) 5 s-1 strain rate. Several temperature scales were used.
Figure 9: Individual load-displacement in PST tests with the (a) average temperature and (b) maximum temperature evolution, and resulting average evolution.
Figure 10 : Zoom on the maximum load of individual load-displacement evolution in PST tests and resulting average evolution. The first arrow shows the load increase with strain rate. The second arrow shows the increase in slope of the
load-plastic strain evolution after the load maximum when the strain rate is increased.
The temperature distributions measured between the two notches for PST specimens tested at different strain rates, after the load maximum are reported in Figure 11. For the PST specimen tested at 0.1 s-1, the temperature distributions were homogeneous and showed almost no local heating. At 1 s-1, the temperature increased and heat conduction resulted in a relatively homogeneous distribution. When the strain rate was further increased to 2.5, 5 and 10 s-1, the thermal diffusion length decreased and the temperature increased sharply at the notches where high plastic strains were reached. Therefore, the temperature on the gauge section center first increased and then declined when the strain rate increased from 0.1 to 10 s-1. This is also visible in the evolution of the average temperature increase in Figure 9(a). The studied strain rate range turned out to be a double transition from almost no local heating to important temperature increase and from significant heat conduction to nearly adiabatic conditions.
Figure 11: Temperature at 0.32 plastic elongation, soon after the maximum load, along a line joining the two notches of a plane strain specimen.
c. HT at higher temperature: 350 °C and 480 °C
Infrared measurements were also performed at higher temperatures, but the black coating cracked before reaching the maximum load. Thus, the heating due to plasticity dissipation was estimated theoretically at 350 °C and 480 °C at 5 s-1 strain rate in HT tests. The procedure consisted in computing the ratio of the density K in kg/m3 [9] times the specific heat [12] in J/kg/K and times the average temperature increase divided by the integral of the macroscopic stress times the plastic strain ∫ , as shown in the following equation:
∫ ∫ ∫ (eq. 7)
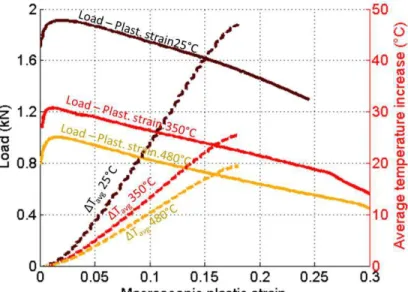
The subscript 25, 350 and 480 correspond to 25 °C, 350 °C and 480°C, respectively. Additional tensile tests were performed at 350 °C and 480 °C, and then were used to determine the evolution of ∫ and ∫ in function of the plastic elongation. The only unknown parameters were the temperature increases at high temperature ( and ). The equation 7 was deduced from the two following assumptions: the β coefficient remained constant with the strain level and the temperature, and heat losses are small compared to the heat production. The estimate obtained using equation 7, showed in Figure 12, gave an average temperature increase at fracture equal to and , while it was during room temperature testing at a 17.5% plastic elongation (close to the strain at fracture at 25 °C). This lower average temperature increase during higher temperature tests was mainly due to the lower stress level for a given plastic strain.
Figure 12: Experimental Load-plastic strain curves of HT tests at 25°C, 350°C and 480°C, experimental average temperature increase (ΔTavg)-plastic strain curve at 25°C and calculated at 350 and 480°C.
DISCUSSION: CONSEQUENCES OF THE LOCAL TEMPERATURE INCREASE ON THE ANALYSIS OF MECHANICAL TESTS AT RIA-PCMI PHASE REPRESENTATIVE STRAIN RATES
Le Saux et al. [14] analysis of the PROMETRA database [15] showed that the stress strain sensitivity ̇ , which represents the material capability to resist to strain localization, increased from 0.013 at 25 °C to 0.022 at 400 °C and then rose steadily to about 0.24 at 800 °C. In addition, the thermal conductivity increases in 30% from 25 °C to 480 °C for Zircaloy alloys [12], thus limiting the localization of the temperature increase. These two last statements together with the lower temperature increase at high temperature indicate that the magnitude of the elongation at fracture reduction due to material auto-heating would likely be lower at 350 °C than at 25 °C, and even lower at 480 °C.
The cladding circumferential strain rate in RIA conditions is about 1 s-1. Therefore, limited local heating (<25 °C) due to plastic dissipation may occur after the maximum load and the increase in temperature should not be strongly localized due to significant heat conduction. Nonetheless, a limited localized temperature increase could enhance strain localization. Now that the general trend and magnitude of the temperature increase is known in the strain rate range from 0.1 to 10 s-1, further studies should focus on strain rates close to 1 s-1, at RIA representative temperatures. Due to heat conduction, an accurate estimate of the local temperature cannot be done assuming adiabatic conditions and would require a coupled thermal-mechanical calculation scheme.
Concerning the interpretation of previous experimental results, the present study showed the local temperature increase becomes significant after the maximum load is reached. Thus, the parameters such as the maximum load and uniform strain would not be significantly affected. On the other hand, the plastic elongation at fracture should not be used to quantify the material ductility at strain rate greater than 0.1 s-1 because of the local temperature increase induced by the plastic heat dissipation. Indeed, the -29% reduction in the plastic elongation at fracture measured during HT tests at 0.1 and 5 s-1 was not due to a material ductility sensitivity to strain rate. It was due to the strain localization induced by the heterogeneous thermal field, which depends on the geometry of the tensile test sample.
This last point should be reminded of, when the elongation at fracture obtained by uniaxial ring testing is converted to higher stress biaxialities using correction factors [16]. The present study showed that this method is not directly applicable for strain rate greater than 0.1 s-1 (and a fortiori for strain rate higher than 1 s-1). A more local measurement of the fracture strain, such as the thickness reduction or full field techniques such as Digital Image Correlation should be used instead of the plastic elongation at fracture.
CONCLUSION
Infrared measurements of the local heating due to plastic dissipation were performed during tensile tests at 25 °C in the strain rate range from 0.1 to 10 s-1 with two different tensile tests on CWSR Zircaloy-4 cladding tubes. Limited temperature increase
was measured at 0.1 s-1 strain rate, while it reached 142 °C at 5 s-1 strain rate in uniaxial ring tests. Local temperature increase was observed between 0.1 and 1 s-1. Nevertheless, the temperature increase was limited in magnitude (< 25°C in PST tests at 1 s-1 at fracture) and was not strongly localized due to thermal conduction. At strain rate greater than 1 s-1, the local temperature increase induced heterogeneous temperature fields. It induced a plastic elongation at fracture reduction. The local thickness reduction measurement showed this was not due to a drop in material ductility. Thus, fracture strains of mechanical tests at strain rates equal or greater than 1 s-1 should be measured at a local scale to assess the material intrinsic fracture behavior.
ACKNOWLEDGMENTS
The authors are grateful to Abdennour Meddour and Jean-Christophe Teissedre from MinesParistech for technical assistance and Herve Louche from Université Montpellier 2 for enlightening advices.
REFERENCES
1. NEA, Nuclear fuel behaviour under reactivity-initiated accident (RIA) conditions. 2010: OECD.
2. Taylor, G.I. and H. Quinney, The latent energy remaining in a metal after cold working. Proceedings of the Royal Society of London, 1934. Serie A: p. 307 - 326.
3. Quinney, H. and G.I. Taylor, The emission of the latent energy due to previous cold working when a metal is heated. Proceedings of the Royal Society of London. Series A, Mathematical and Physical Sciences, 1937. 163: p. 157 - 181. 4. Macdougall, D., Determination of the Plastic Work Converted to Heat Using Radiometry. Experimental mechanics,
2000. 40(3): p. 298-306.
5. Vivier, G., H. Trumel, and F. Hild, On the stored and dissipated energies in heterogeneous rate-independent systems. Continuum Mechanics and Thermodynamics, 2009. 20(7): p. 411-427.
6. Padilla, H., et al., Spatiotemporal Thermal Inhomogeneities During Compression of Highly Textured Zirconium. Experimental Mechanics, 2011. 51: p. 1061–1073.
7. Murty, K.L. and I. Charit, Texture development and anisotropic deformation of Zircaloys. Progress in Nuclear Energy, 2006. 48: p. 325-359.
8. Papin, J., et al., {Summary and interpretation of the CABRI REP-Na program}. Nuclear Technology, 2007. 157(3): p. 230-250.
9. IAEA, Thermophysical properties of materials for nuclear engineering: a tutorial and collection of data. 2008: IAEA. 10. Le Saux, M., Comportement et rupture de gaines en Zircaloy-4 détendu vierges, hydrurées ou irradiées en situation
accidentelle de type RIA. 2008, Ph.D. Ecole supérieure des Mines de Paris: Paris, France.
11. Poncelet, M., Multiaxialité, hétérogénéités intrinsèques et structurales des essais d’auto-échauffement et de fatigue à
grand nombre de cycles. 2007, Ph.D. Ecole Normale Supérieure de Cachan: Cachan, France.
12. IAEA, Thermophysical properties database of materials for light water reactors and heavy water reactors. 2006, IAEA. 13. Link, T.M., D.A. Koss, and A.T. Motta, Failure of Zircaloy cladding under transverse plane-strain deformation.
14. Le Saux, M., et al., A model to describe the anisotropic viscoplastic mechanical behavior of fresh and irradiated
Zircaloy-4 fuel claddings under RIA loading conditions. Journal of Nuclear Materials, 2008. 378: p. 60-69.
15. Cazalis, B., et al., The PROMETRA program: Fuel cladding mechanical behavior under high strain rate. Nuclear Technology, 2007. 157: p. 215-229.
16. Jernkvist, L.O., A.R. Massih, and P. Rudling, A strain based clad failure criterion for reactivity initiated accidents in