HAL Id: hal-02187899
https://hal.archives-ouvertes.fr/hal-02187899
Submitted on 18 Jul 2019
HAL is a multi-disciplinary open access
archive for the deposit and dissemination of
sci-entific research documents, whether they are
pub-lished or not. The documents may come from
teaching and research institutions in France or
abroad, or from public or private research centers.
L’archive ouverte pluridisciplinaire HAL, est
destinée au dépôt et à la diffusion de documents
scientifiques de niveau recherche, publiés ou non,
émanant des établissements d’enseignement et de
recherche français ou étrangers, des laboratoires
publics ou privés.
Commissioning of the ACtive TARget and Time
Projection Chamber (ACTAR TPC)
B. Mauss, P. Morfouace, T. Roger, J. Pancin, G.F. Grinyer, J. Giovinazzo, V.
Alcindor, H. Álvarez-Pol, A. Arokiaraj, M. Babo, et al.
To cite this version:
B. Mauss, P. Morfouace, T. Roger, J. Pancin, G.F. Grinyer, et al.. Commissioning of the ACtive
TARget and Time Projection Chamber (ACTAR TPC). Nucl.Instrum.Meth.A, 2019, 940, pp.498-504.
�10.1016/j.nima.2019.06.067�. �hal-02187899�
Commissioning of the ACtive TARget and Time Projection Chamber (ACTAR TPC)
B. Maussa,1,∗, P. Morfouacea, T. Rogera,∗, J. Pancina, G.F. Grinyera,b, J. Giovinazzoc, V. Alcindora, H. ´Alvarez-Pold, A. Arokiaraje,
M. Babof, B. Bastina, C. Borceag, M. Caama˜nod, S. Cerutie, B. Fern´andez-Dom´ınguezd, E. Foulon-Moreta, P. Gangnanta, S.
Girauda, A. Laffoleyh, G. Mantovanii, T. Marchii, B. Monteagudoj, J. Pibernatc, O. Poleshchuke, R. Raabee, J. Refsgaarde,
A. Revela,j, F. Saillanta, M. Stanoiug, G. Wittwera, J. Yange
aGrand Acc´el´erateur National d’Ions Lourds (GANIL), CEA/DRF-CNRS/IN2P3, Bvd Henri Becquerel, 14076 Caen, France bDepartment of Physics, University of Regina, Regina, SK S4S 0A2, Canada
cCentre d’ ´Etudes Nucl´eaires de Bordeaux Gradignan (CENBG) - UMR 5797, CNRS/IN2P3 - Universit´e de Bordeaux, Chemin du Solarium, F-33175 Gradignan,
France
dDpt. de F´ısica de Part´ıculas Univ. of Santiago de Compostela and IGFAE, E-15758, Santiago de Compostela, Spain eKU Leuven, Instituut voor Kern- en Stralingsfysica, 3001 Leuven, Belgium
fInstitut de Physique Nucl´eaire, CNRS/IN2P3, Universit´e Paris-Sud, Universit´e Paris-Saclay, F-91406 Orsay, France gIFIN – HH, str. Reactorului 30, P. O. Box MG – 6, Bucharest-Magurele, Romania
hDepartment of Physics, University of Guelph, Guelph, ON N1G 2W1, Canada iINFN — Laboratori Nazionali di Legnaro, 35020 Legnaro, Italy
jLPC Caen, Normandie Universit´e, ENSICAEN, Universit´e de Caen, CNRS/IN2P3, F-14050, Caen, France
Abstract
The ACtive TARget and Time Projection Chamber (ACTAR TPC) is a novel gas-filled detector that has recently been constructed at GANIL. This versatile detector is a gaseous thick target that allows the tracking of charged particles in three dimensions and provides a precise reaction energy reconstruction from the vertex position. A commissioning experiment using resonant scattering
of a 3.2 MeV/nucleon18O beam on an isobutane gas (proton) target was performed. The beam and the heavy scattered ions were
stopped in the gas volume, while the light recoil left the active volume and were stopped in auxiliary silicon detectors. A dedicated tracking algorithm was applied to determine the angle of emission and the length of the trajectory of the ions, to reconstruct the
reaction kinematics used to built the excitation functions of the1H(18O,18O)1H and1H(18O,15N)4He reactions. In this article, we
describe the design of the detector and the data analysis, that resulted in center of mass reaction energy resolutions of 38(4) keV FWHM and 54(9) keV FWHM for the proton and alpha channels, respectively.
Keywords: Active target, Time projection chamber, micromegas, Resonant scattering
1. Introduction
The study of nuclear matter far from the valley of stability has led to significant changes in terms of techniques used to study exotic nuclei when compared to studies of stable nuclei. The dramatic decrease in intensity for radioactive ion beams, and the inherent need to work in inverse kinematics (the beam is the heavy particle, as no target can be made with short lived ra-dioactive nuclei), has to be compensated with the use of thicker targets. This, unfortunately, decreases the overall resolution that can be obtained on the determination of the final state pa-rameters, such as the excitation energy. To cope with these chal-lenges, active targets were developed a few decades ago as sum-marized in a recent review article [1]. These detectors are usu-ally based on the concept of Time Projection Chambers (TPC). Using the detection medium as a target for nuclear reactions, they are used to track charged particles, extract reaction vertices
∗
Corresponding authors
Email addresses: benoit.mauss@riken.jp (B. Mauss), roger@ganil.fr (T. Roger)
1Present address: RIKEN Nishina Center, 2-1, Hirosawa, Wako, Saitama
351-0198, Japan
and thus correct the energy lost by charged particles inside the target. The first active target built for nuclear physics experi-ments was the IKAR setup at GSI [2], which was constructed to study exotic light-ion matter distributions. Since then, more versatile instruments were developed such as the active target MAYA at GANIL [3] that was used to study transfer reactions on light exotic nuclei [4, 5, 6] and giant resonances in Ni iso-topes [7, 8]. At about the same time, the CENBG TPC [9] was developed to investigate exotic radioactivity modes, such as two proton radioactivity [10]. With the advent of new digital elec-tronics developments, such as the General Elecelec-tronics for TPCs project (GET) [11], next generation active targets and time pro-jection chambers with more precise volume sampling have been constructed or are planned worldwide [1, 13, 12, 14, 15].
The ACtive TARget and Time Projection Chamber (ACTAR TPC) is a state-of-the-art detector developed by a collabora-tion of European laboratories and built at GANIL. It has a charge projection plane segmented in 128×128 square pads of
2×2 mm2 connected to the GET system. With GET, the
sig-nal can be digitized at several user-specified frequencies in 512 time cells per channel, sampling the active volume in 8 Mega voxels. This article presents the performances of ACTAR TPC
using the 1H(18O,18O)1H and 1H(18O,15N)4He resonant reac-tions performed during a 20-hour commissioning experiment at GANIL.
2. Experimental set-up 2.1. Detector description
The ACTAR TPC detector, shown schematically in Figure 1, follows the construction of two 8-times smaller
demonstra-tor [16, 17] using different technologies for the pad wiring.
The internal skeleton of ACTAR TPC chamber measures 606 mm × 606 mm × 335 mm. The gas input and output are po-sitioned on opposite corners of the chamber to ensure a good overall homogeneity of the gas or gas mixtures. All flanges around the structure are made with 1.5 cm thick aluminum in
order to sustain up to one bar differential pressure with
mini-mum deformation. In order to put the 6 µm thick Mylar beam-entrance window as close as possible to the wire field cage, the front flange is equipped with a cylindrical nose with a diameter of 80 mm. This design reduces the distance from the entrance window to the active volume of the detector to only 60 mm, as shown in Figure 1. The bottom and top flanges are used to me-chanically support the drift cage and provide the necessary con-nections to the pixelated anode, respectively. The side flanges can be used to hold auxiliary detectors, depending on the needs of the particular physics experiments.
The active volume is surrounded by a
295 mm × 295 mm × 255 mm double-wire field cage that
is attached to the cathode and is fed via a 20 kV high voltage feedthrough on the bottom flange. The field cage consists of 20 µm diameter wires with a 1 mm pitch on the inner plane and a 2 mm pitch on the outer plane, connected through 4.7 MΩ
resistors. As explained in Ref. [16], the use of two field
degradation planes ensures a good homogeneity of the drift field by preventing the electric field between the drift cage and the auxiliary detectors to leak into the drift region.
With the drift electric field, ionization electrons produced in the active region drift towards the anode that is highly segmented into 128×128 square pads, each with a side
edge of 2 mm. The resulting high density of channels (25
channels/cm2, 16384 total pads) was therefore a challenge for
designing the mechanics and pad connections while ensuring minimal mechanical deformation of the flange when applying
up to 1 bar differential pressure. Typical experiments are
per-formed with pressures ranging from a few tens of mbar up to one bar. Our solution was to build the anode from a metal-core printed circuit board (PCB) with a direct connection through the circuit from the pads to a connector with a 2 mm pitch (size of a pad), as described in Ref. [17].
Based on the demonstrator detector design [16], the pad plane for ACTAR TPC was equipped with a ' 220 µm gap bulked micromegas amplification system [18, 19] made by the CERN PCB Workshop. Usually, the amplification gap in mi-cromegas is about 100 µm, which is the optimum gap for atmo-spheric pressure operation. Here, the large amplification gap was chosen based on the study in Ref. [20] where good ampli-fication was achieved even at low pressures (below 300 mbar).
Figure 1: 3D computer-aided drafting (CAD) drawing of ACTAR TPC. See text for details.
The 16384 pads are connected through flex Kapton spark-protection circuits (ZAP) to the 64 ASIC and ADC (AsAd) boards of the GET system. The AsAd are arranged perpen-dicular to the beam axis in order to minimize the amount of channels per AsAd board hit by the beam, hence reducing the dead time as explained in Ref. [11]. The AsAd boards are
con-nected to 8+8 Concentration Boards (CoBo) cards held in two
Micro Telecommunications Computing Architecture (µTCA) crates. Two Multiplicity, Trigger and Time (MuTanT) modules (one master and one slave) are used to distribute the 100 MHz clock to the CoBo boards, and distribute the trigger to GET. The µTCA crates carrier hubs (MCH) are connected through their 10 Gb interface to a PowerEdge R730xd Dell acquisition server equipped with two Intel Xeon E5-2630 v4 central processing units (CPU).
For the present study, as seen in Figure 1, the downstream
flange of ACTAR TPC was covered with twenty 5 × 5 cm2and
700 µm thick silicon detectors (Si) that were used to detect the scattered protons escaping the active volume. They were
each equipped with 10 mV/MeV charge-sensitive preamplifiers
that fed CAEN N568 amplifiers with 3 µs shaping time and ×32 gain. The shaped output of the module was connected to GANIL VXI peak-sensing ADCs. The fast output of the am-plifiers was discriminated in CAEN N844 modules and used to trigger the GAMER VXI trigger module. The VXI electronics coupling to the GET system was made using the CENTRUM protocol [21] with the GAMER VXI used as master trigger for the whole electronics setup.
2.2. Settings of the commissioning
The ACTAR TPC commissioning experiment was performed at GANIL. The goal was to estimate the capabilities of the de-tector for performing resonant scattering studies. A low-energy
18O beam was chosen to benchmark the resolution of the
detec-tor based on the reconstruction of the excitation function of the
1H(18O,18O)1H and1H(18O,15N)4He reactions.
An 18O beam was accelerated to 6.6 MeV/nucleon in the
CSS1 cyclotron and was sent to the G3 experimental hall where ACTAR TPC was mounted on the beam line. The beam was slowed down using a 63 µm thick aluminum degrader and 2
Y (pad)
40 60 80
100 collected charge (arb. units)
0 1000 2000 3000 4000
X (pad)
0 50 100
projected charge (arb. units) 102 3 10 4 10 max Q /5 max Q max X R
Figure 2: (color online) Upper panel, example of an event with the shaded polarization zone below the beam. Lower panel, projection of the beam particle along the X axis. The track stopping point R of the beam, plus the scattered heavy particle if there is a reaction as it is the case here, is defined as a fifth of the Bragg curve maximum charge deposit. The polarization could not be applied for some pads, due to connection problems, resulting in a significantly higher charge compared to their neighbours (around X=10 pad and X=50 pad), which results in the peaks shown in the reconstructed Bragg curve. These pads were discarded in the analysis.
reached the beginning of the active volume with an energy of
3.2 MeV/nucleon. This lower energy allowed states in 19F to
be populated between 8 and 11 MeV in excitation energy. The incoming intensity was monitored using a collimated multiwire proportional counter (MWPC) that was placed in front of the entrance window of ACTAR TPC. During the 20 hours of data
taking, the average 18O beam intensity was 1.5×10⁴ particles
per second. The proton target used to study the1H(18O,18O)1H
and 1H(18O,15N)4He reactions was isobutane (iC
4H10) gas at
100 mbar pressure that filled the ACTAR TPC volume. At this
pressure, the18O beam was stopped inside the active volume,
just above column number 98 (out of 128 total) of the pad plane. The maximum energy of the scattered protons was about
12 MeV, at 0◦ in the laboratory frame. The corresponding
en-ergy deposited in the gas was dEdx = 1 keV/mm (2 keV/pad),
which is the minimum energy deposit in the experiment. With the micromegas mesh voltage set to -450 V, the gain was pre-viously measured to be 5000 in Ref. [16]. Hence, all proton tracks can be recorded with a transverse multiplicity of three pads. This is necessary to achieve an optimal angle reconstruc-tion, and a good signal-to-noise ratio using the 120 fC GET preamplifier dynamic range, which corresponds to a gain of
180 mV/MeV Si equivalent. However, the difference in energy
deposit between18O ions stopping in the active volume (about
100 keV/mm) and the recoiling protons was up to a factor 100.
As shown in Ref. [16], a single dynamic range of the GET
preamplifiers is not sufficient to record the track of the beam
ions and the track of the protons at the same time without
satu-Table 1: Beam and detector settings used during the ACTAR TPC18O
com-missioning experiment.
Parameter Value Units Beam energy at active volume entrance 57.6 MeV Beam emittance 18.56π mm·mrad Average beam intensity 1.5×10⁴ pps
Cathode potential -3500 V Mesh potential -450 V Polarized pads potential -100 V Drift velocity (measured) 3.8 cm/µs Isobutane gas pressure 100 mbar Proton target density 2.5×10¹⁹ protons/cm3
Clock frequency 50 MHz GET dynamic range 120 fC GET readout threshold 5.3 fC GET peaking time 1024 ns
rating the electronics. In order to extend the effective dynamic
range, the pads located below the beam path were polarized to -100 V, locally reducing the gain of the micromegas from about 5000 to about 250. This follows the work described in Ref. [22].
With a beam emittance of about πσxσθ = 18.56π mm·mrad,
obtained by tracking the beam upstream from the reaction point, the width of the polarized zone was set to 12 rows of pads (24 mm) and was 100 columns (200 mm) in length, as shown in the upper panel of Figure 2. Due to connection problems, some of the pads from this zone could not be correctly polar-ized. As a result, the micromegas has a higher gain above those pads, which produces the peaks on the Bragg profile shown in the lower panel of Figure 2. The GET system was set to par-tial readout mode, so that only pads with a signal exceeding a certain threshold were read. This readout threshold was set to
5.3 fC, which corresponds to 3.27×10⁴electrons. With the
mi-cromegas gain of 5000, this threshold is about 6.6 ionization electrons, or about 0.2 keV energy deposited per pad.
The cathode voltage was set to -3500 V, so that the drift
ve-locity of the ionization electrons was about 3.6 cm/µs. The total
time window required to observe the full height of the active volume was therefore 6.7 µs. The sampling frequency of the GET system was set to 50 MHz, which provided a time window of 10.24 µs over 512 samples for detecting the ionization elec-trons. Following the definition of Ref. [23], the samples will be later referred to as time cells. The test experimental conditions are summarized in Table 1.
For later discussions on the analysis, we introduce the fol-lowing terms:
• Electronic events are defined as the full window of 512 time cells over the whole pad plane.
• Physical events are defined as the grouping of tracks
cor-related in time/space.
• Beam events are defined as unreacted events, forming physical events only consisting of a beam track.
• Pileup events are defined when there are several physical events in an electronic event.
X (pad) 0 50 100 time cell (20 ns) 300 350 Beam particle Recoiling hydrogen
Figure 3: (color online) Example of pileup event observed in ACTAR TPC, two beam tracks are seen and only one recoil, corresponding to a reaction. The beam tracks that reacted has a shorter track. The beam track above corresponds to a beam event happening at a later time than the physical event below. The color scale indicates the charge deposit.
3. Data analysis 3.1. Particle tracking
To extract the voxel information (the charge collected and the electron arrival time on each pad), the signal baseline was first treated using the methods described in Ref. [23]. After baseline treatment, the physical pulse was fit with a generic pulse shape as described in [24]. The timing information was translated into a vertical position using the electron drift velocity in the gas. By correlating the Si detector hit with the recoil nuclei tracked, the impact matrix on each Si detector can be reconstructed. The drift velocity is adjusted to match the reconstructed vertical size
of the Si detector to 5 cm. The determined value of 3.8 cm/µs
is in agreement with the magboltz [25] calculated velocity of
3.6 cm/µs.
A typical event contains the beam track and the track of the heavy scattered ion that stops in the active volume. Given that the maximum scattering angle of the heavy ion does not
ex-ceed 15◦for (p,α) reactions at the lowest measured reaction
en-ergy, the tracks directions are very close and are almost always confined to the polarized (low gain) region of the pad plane. For this reason, we consider in the analysis and define in the following that beam tracks are continuous tracks in the polar-ized beam region (Figure 2), meaning unreacted beam or the incoming beam plus the scattered heavy-ion, without distinc-tion. Scattering events also contain the track of the light recoil particle that is observed in the unpolarized (high gain) zone. As seen in the upper panel of Figure 2, the pad plane can thus be separated into two areas: the polarized zone, that contains the tracks of the heavy ions, and the unpolarized zone that con-tains the tracks of the light recoils. Following this division, the tracking analysis is performed in each area independently. The track fitting procedure is adapted from the orthogonal distance regression presented in Ref. [26].
Due to the high beam intensity, the probability to record two incident beam particles in the same acquisition window of 10.24 µs is significant. A pileup separation technique was there-fore developed and applied to the polarized zone. Pileup events
arrive at different times and are thus separated into different
time cells, as shown in the example of Figure 3, which displays
pileup per event
2 4 6 8 10 occurrence (%) 0 20 40 60 80 low_Ip
pileup per event
2 4 6 8 10 occurrence (%) 0 20 40 60 high_Ip
Figure 4: Occurrence of pileup events. A total of 12% of the events at 104pps
were piled up in ACTAR TPC (left). When the beam intensity was doubled this increased to 27% (right). Most of these events were recovered in the analysis by correlating the timing between the light recoil to one of the incident beam tracks (see text).
the charge projection of three particle tracks in the X-Z plane (X is the axis of propagation of the beam and Z the vertical axis along which the electrons drift). Comparing the recoiling parti-cle timing (the track going down in Figure 3) and timing of the two separate beam tracks (horizontal tracks) in a single elec-tronic event, the recoil and one beam track can be regrouped in a correlated physical event. In Figure 4, the amount of pileup per electronic event is plotted as a function of the beam
inten-sity. For example, at a beam intensity of 104particle per second
(pps, left panel of Figure 4), only 12% of the electronic events recorded more than one beam track. When the beam intensity
was doubled to 2 × 10⁴pps (right pane of Figure 4), 27% of the
events were piled up. This is consistent with the expected Pois-son time distribution of the beam. Using the pileup separation technique, close to 100% of these pileup events were recovered
in the analysis. The separation limit is given by the time di
ffer-ence between two beam tracks compared to the beam track time width, due to the longitudinal straggling of the electrons as they drift toward the micromegas. In this commissioning, this width was consistent with the magboltz calculation, that depends on the gas used and the magnitude of the drift electric field applied. 3.2. Particle identification
After tracking particles in the TPC, the second step of the analysis consisted in identifying the light recoil. This identifi-cation was performed by correlating the energy recorded in the
silicon detectors ESi with the energy loss in the gas per
mil-limeter, averaged over the last 15 columns of pads. However,
the measurement of the energy deposition in the gas is affected
by attachment due to O2 molecules. Indeed, during the
exper-iment, a small air leak on the pad plane flange was detected. In order to estimate the proportion of air in the detector, several short runs were taken using the MWPC in front of ACTAR TPC as trigger, allowing the selection of unreacted beam events by looking at events without energy deposit in the Si. The range of
the beam particles was compared to LISE++ calculations [27]
using the energy loss tables of Ref. [28]. A 2% air pollution was deduced and was found to be constant over the 20-hour
experi-ment. Drift electron attachment to the O2molecules caused the
charge recorded over the pad plane to depend exponentially on the position (height above the anode) in which the ionization 4
(MeV)
Si
E
10 20 30 40
dE/dx (arb. units)
0 50 100 (cm) pad plane d 0 10 20 30
dE/dx (arb. units)
0 20 40 60
Figure 5: (color online) Particle identification using the energy deposit over the pad plane versus the energy lost in the silicon detectors after correction of the height dependence. The energy deposit is averaged over the last 15 columns of pads. The identification lines observed correspond to hydrogen and helium. In the inset, the correlation of the energy deposit over the pad plane with respect to the distance between the pad plane and the hit position on the Si detector extracted from the track fit is plotted for ESi = 25 ± 1 MeV. The solid red line
corresponds to the applied correction function.
electrons were produced. The information on the energy de-posited had to be corrected for this effect by applying a factor that varied exponentially with the drift distance. With the sili-con trigger, the number of time cell can be directly transformed into a drift distance for the trigging event. Then, the exponential correction parameters were determined from the correlation be-tween the energy loss measured over the pad plane of 25 MeV α particles recorded in the silicon detectors, and the known mean drift distance of their tracks. α particles are identified by the fact that the proton punch-through is at 10 MeV and only negli-gible amount of other particles are expected to reach the silicon detectors. The correlation is shown in the inset of Figure 5, with the exponential fit (correction factor) drawn through the data points. The attachment parameter extracted from a fit of
this 2D plot reaches λa = 0.126 cm−1, about a factor 10 above
the value deduced with magboltz. After applying this correc-tion, the identification plot presented in Figure 5 was obtained. Without the correction factor, the identification lines width in
dE
dx would spread about four times more.
3.3. Reaction channel selection
In the present experiment, four reaction channels are open.
Two of them have a proton and an 18O in the final state: the
elastic channel and the inelastic channel to the first excited state
of18O in the highest energy part of the excitation function. Two
other reactions have an α in the final state together with a15N
either in its ground state or in its first excited state. If the par-ticle identification can be achieved with the classic thick solid target in inverse kinematics method [29, 30], active targets of-fer a unique possibility to select the excitation energy in the final state. This is achieved through the tracking of the heavy particle, or more precisely, by the determination of the total path of the beam plus scattered heavy particle after reaction in the active volume R. This can be extracted by projecting the
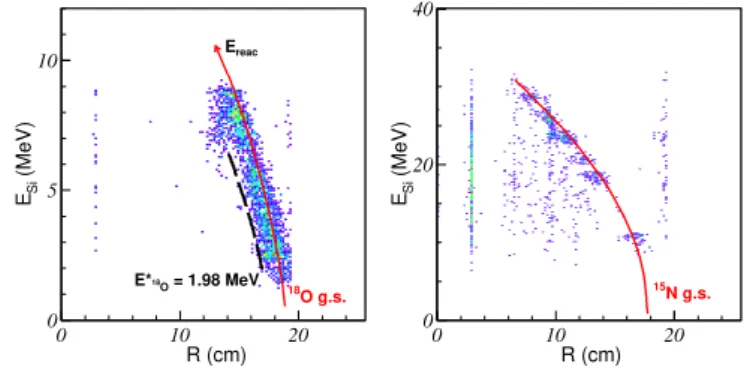
R (cm) 0 10 20 (MeV) Si E 0 5 10 = 1.98 MeV O 18 E* O g.s. 18 reac E R (cm) 0 10 20 (MeV) Si E 0 20 40 N g.s. 15
Figure 6: (color online) Identification of the kinematic line corresponding to the ground state of the beam like particle, at θcm= 160 ± 5◦. The total energy
left in the Si detector ESiis plotted as a function of the total path R (Figure 2).
charge collected on the pad plane polarized area along the X-axis (Figure 2). The beam energy-loss profile along the X-X-axis is constructed and the beam-like particle stopping point is deter-mined. As defined in the lower panel of Figure 2, it corresponds to the point where the charge value has decreased to a fifth of the Bragg peak maximum charge, which corresponded best to the SRIM energy loss tables [31].
As explained in [32, 33], if the center-of-mass angle of the
reaction is fixed, there is a unique relationship between ESiand
Rto the reaction energy and the excitation energy in the final
state. Correlation plots for1H(18O,18O)1H and1H(18O,15N)4He
are presented in Figure 6 for 160 ± 5◦center-of-mass, selected
with the proton or α-particle laboratory angle. This angle was chosen for comparison with the measurements of Ref. [34]. The zero of the abscissa corresponds to the start of the pad plane. The events corresponding to the population of the ground state
of18O and15N can be identified on the figure. Though
energet-ically allowed, no events corresponding to the population of the
first excited state of18O and15N were observed. This is
con-sistent with the measurement of Ref. [34]. The vertical lines observed in Figure 6 come from pileup events when R ' 20 cm. Below 20 cm, they come from the information lost due to the unpolarized pads described previously and shown in Figure 2. On the right of Figure 6, points can also be observed below
the15N ground state line. Most of these correspond to fusion
reactions with12C in the iC4H10 gas and evaporation of an
α-particle. They can be partially identified because the Bragg
peak maximum of 26Mg is about 80% larger than 15N. This
identification can be tentatively performed for reactions before pad 50. Beyond that point, the reaction energies are below 20 MeV. At the center-of-mass angles used in the analysis, this
corresponds to26Mg with an energy below 2.5 MeV, beyond
the Bragg peak. The energy deposited by26Mg is then
indistin-guishable from15N. In this case, identification of the heavy
par-ticle before pad 50 is not performed because of the unpolarized pads in the beam area (Figure 2). As fusion-evaporation is not
kinematically allowed above the1H(18O,15N)4He ground state
kinematic line, these reactions provide a source of background
that can be largely suppressed by selecting the15N ground-state
3.4. Construction of the excitation function
After selecting the reaction channel, the reaction energy was reconstructed using an iterative procedure. The reaction kine-matics was used to calculate the reaction energies. Having the
energy deposited in the Si detectors ESiand the track angle θlab
fitted from the TPC voxels, the reaction energy Ereacwas
deter-mined using the formula: Ereac,i=
m18O(mH/m18O+ 1)2EH,i
4mHcos2(θlab)
(1) for the case of the (p,p) channel, with i the iteration number.
mH and m18O are the proton and 18O atomic masses,
respec-tively. EHis the total energy of the recoiling proton. At the first
iteration, EH,0 = ESi. With the calculated Ereac,0, and assuming
the known initial beam energy Ebeam, the vertex position was
calculated using energy-loss tables [31]. From the measured vertex position, it is possible to determine the energy lost by
the light particle in the gas, dE0, before it arrives at the silicon
detector. Ereac,1 is calculated using EH,1 = ESi+ dE0and θlab,
leading to another vertex position. The recoil energy is
cor-rected again : EH,i+1 = ESi+ dEi. This procedure is repeated
until | dEi− dEi−1|< 1 keV. The entire procedure takes between
2 and 4 iterations. The same procedure was performed for the (p,α) channel with the corresponding kinematic formula. The
excitation functions at θcm= (160 ± 5)◦for both (p,p) and (p,α)
channels are presented in Figure 7. The absolute normalization of the data used the MWPC counter after correcting the data
by the detection efficiency of the ACTAR TPC. The latter was
determined using a Monte Carlo simulation that includes the geometry of the pad plane and the position of the silicon
detec-tors. At θcm = 160◦, the efficiency was found to vary between
90 % and 100 % depending on the center-of-mass energy.
4. Results and Discussion
In order to estimate the resolution of ACTAR TPC on the center-of-mass energy reconstruction, the data were fit with a theoretical model convoluted with a Gaussian function to rep-resent the experimental energy resolution. In the case of the (p,p) channel, the theoretical model is an R-matrix calculation performed with the AZURE2 code [35]. All resonance ener-gies and widths that are available on ENSDF [36] were consid-ered in the calculation. For the case of the (p,α) channel, the lack of data on ENSDF led us to use a different approach. The data obtained in a previous study [34] were used as the theo-retical model. The uncertainty on the center-of-mass energy in Ref. [34] are much smaller than in our experiment, hence the model was considered as having perfect resolution. The result of the fits are presented in Figure 7. The resonances available on ENSDF or Ref. [34] are indicated by the arrows on the plot. Resolution on the center-of-mass energy for the (p,p) and (p,α) channels were found to be 38(4) keV FWHM and 54(9) keV FWHM, respectively.
In order to better understand where this resolution was
com-ing from, the uncertainties on the different experimental
param-eters were propagated to the center-of-mass energy
determina-Table 2: Propagation of the parameter resolution to the excitation function. All values are given in FWHM. θlabhas the largest contribution to the resolution.
Details on the parameter resolutions are given in the text.
Parameter Resolution Propagation to Ecm(keV)
(p,p) channel (p,α) channel Ebeam 1.5 MeV 8.5 17.4 ESi 60 keV 16.5 21.1 θlab 2◦ 22.3 34.8 Total simulation 29 45 Experimental 38(4) 54(9)
tion by a Monte-Carlo calculation. From section 3.4, the pa-rameters used to reconstruct the excitation function are:
• the beam energy at the entrance of ACTAR TPC Ebeam;
• the energy deposited by the light recoil in the silicon
de-tectors ESi;
• the light recoil diffusion angle θlab.
The resolution on Ebeamprimarily comes from the energy
strag-gling produced by the 63 µm thick aluminum degrader and the 6 µm Mylar entrance window. This was estimated using unre-acted beam events triggered by the MWPC as explained pre-viously. The distribution of the beam reconstructed stopping
point position had a lateral spread of σ = 6 mm that was
translated using SRIM tables into an energy spread of 1.5 MeV
FWHM. The resolution on ESiwas determined using a239Pu+
241Am+244Cm mixed alpha-particle source. It was assumed to
vary linearly with the energy. The resolution on ESiwas found
to be 60 keV FWHM at 5.5 MeV. The resolution on θlab was
measured using the shape reconstruction of the central Si detec-tors. This was achieved by tracking particles that hit the central silicon detector, and extrapolating the track to the plane of the
silicon detector. The θlabresolution had a maximum value of 2◦
FWHM. The measured resolution was estimated to be mostly due to the straggling of the recoils in the gas. For comparison, protons recorded with an energy of 3 MeV in the Si detectors travelled at least through 175 mm of gas based on the reaction
kinematics. When calculated with LISE++, the associated
an-gular straggling is 1.8◦ FWHM for the proton. This is in
rea-sonable agreement with the measured angular resolution. From
the LISE++ calculations, the recoiling α should have a better
angular resolution of 0.84◦ FWHM for a 25 MeV recorded α
traveling 284 mm of gas. The statistics on α particles was too small to measure the angular resolution in the same way. Since this factor has the greatest influence on the center-of-mass
res-olution, it was taken as 2◦for the (p,α) channel as well so as to
not underestimate its effect. A summary of the parameter
res-olutions and the propagation on the final simulated resres-olutions are given in Table 2. The propagated uncertainties are consis-tent with the experimental result.
5. Conclusion
We have characterized the performance of a novel active tar-get and detection system that does not rely on a magnetic spec-trometer. The next generation active target ACTAR TPC was 6
’
(MeV)
F 19E*
9
9.5
10
10.5
(mb/sr)
Ω
/d
σd
100
200
300
400
/ ndf 2 χ 107.3 / 83 p0 0.01614 ± 0.001626 / ndf 2 χ 107.3 / 83 p0 0.01614 ± 0.001626 1/2+ 8.795 3/2+ 9.666 1/2+ 9.889 1/2+, 10.162 1/2+, 10.232 3/2+, 10.254 3/2+, 10.308(MeV)
F 19E*
9
9.5
10
10.5
(mb/sr)
Ω
/d
σ
d
0
20
40
60
/ ndf 2 χ 44.16 / 50 p0 0.02315 ± 0.003685 / ndf 2 χ 44.16 / 50 p0 0.02315 ± 0.003685 1/2+ 8.795 3/2+ 9.666 1/2+ 9.889 1/2+, 10.162 1/2+, 10.232 3/2+, 10.254 3/2+, 10.308 3/2+ 10.498Figure 7: Excitation energy of19F from the (p,p) channel on the left and from the (p,α) channel on the right projected for θ
cm= (160 ± 5)◦. The black dots with
statistical uncertainties are the experimental points and the red curve is the result of the R-matrix calculation convoluted with a Gaussian function that was fit the data (see text for details). Resolutions were found to be 38(4) keV FWHM and 54(9) keV FWHM, respectively.
commissioned at the GANIL facility with a 3.2 MeV/nucleon
18O beam with an average beam intensity of 1.5×10⁴ pps on
isobutane gas. The challenge of the energy loss discrepancy by a factor 100 between the stopping heavy-ions and the light re-coils was met with the polarization of the pads below the beam. It was successful in producing two gain regions with an inci-dent beam intensity of 20 kHz without degrading the charge
measurement. The1H(18O,18O)1H and1H(18O,15N)4He
chan-nels were open and could be distinguished with the scattered heavy-ion identified as being in its ground state. The excita-tion funcexcita-tions in both channels were reconstructed and fit to obtain the center-of-mass energy resolutions. Resolutions of 38(4) keV FWHM for the (p,p) channel and 54(9) keV FWHM for the (p,α) channel were achieved. According to simulations, the resolution is dominated by the angular resolution, which it-self is dominated by the straggling of the ions in the gas. The latter could be decreased by replacing the isobutane gas tar-get by pure hydrogen. The present resolution is comparable to the 45 keV center-of-mass energy resolution achieved with the Active-Target Time Projection Chamber (AT-TPC) from
Michi-gan State University that was measured for the1H(46Ar,46Ar)1H
reaction [13, 37]. This resolution was obtained with a factor 10
less beam intensity for center-of-mass angles between 30◦and
65◦, and with a direct measurement of the reaction point in the
active target. Using the reaction kinematics, as performed in the present work, the AT-TPC has an expected resolution of 84 keV
derived from simulations of the1H(46Ar,46Ar)1H [13].
Unfor-tunately, no experimental measurement was made with the AT-TPC to confirm this result due to challenges associated with the experimental data obtained in Ref. [13].
The new technological developments for active targets have
opened up new possibilities to perform challenging reactions for nuclear structure and astrophysical studies. The results of the present study show that ACTAR TPC holds considerable promise in this respect.
Acknowledgments
The research leading to these results have received fund-ing from the European Research Council under the European Union’s Seventh Framework Program (FP7/2007-2013)/ERC
grant agreements n◦335593 and 617156, and from the Research
Foundation Flanders (FWO, Belgium).
[1] S.Beceiro-Novo et al., Prog. in Part. and Nucl. Phys. 84 (2015) 124 [2] G. D. Alkhazov et al., Phys. Rev. Lett. 78 (1997) 2313
[3] C.-E. Demonchy et al., Nucl. Instr. and Meth. A 583 (2007) 341 [4] M. Caama˜no et al., Phys. Rev. Lett. 99 (2007) 062502 [5] I. Tanihata et al., Phys. Rev. Lett. 100 (2009) 192502 [6] T. Roger et al., Phys. Rev. C 79 (2009) 031603(R) [7] C. Monrozeau et al., Phys. Rev. Lett. 100 (2008) 042501 [8] M. Vandebrouck et al., Phys. Rev. Lett. 113 (2014) 032504 [9] B. Blank et al., Nucl. Instr. and Meth. A 613 (2010) 65 [10] P. Ascher et al., Phys. Rev. Lett. 107 (2011) 102502
[11] E.C. Pollacco et al., Nucl. Instr. and Meth. A 887 (2018) 81-93 [12] S. Ota et al., J. Radioanal. Nucl. Chem. 305 (2015) 907–911 [13] J. Bradt et al., Nucl. Instr. and Meth. A 875 (2017) 65–79 [14] T. Furuno et al., Nucl. Instr. and Meth. A 908 (2018) 215–224 [15] J. Hooker et al., arXiv:1903.01402
[16] T. Roger et al., Nucl. Instr. and Meth. A 895 (2018) 126-134 [17] J. Giovinazzo et al., Nucl. Instr. and Meth. A 892, (2018) 114 [18] I. Giomataris et al., Nucl. Instr. and Meth. A 376, (1996) 29 [19] I. Giomataris et al., Nucl. Instr. and Meth. A 560, (2006) 405 [20] J. Pancin et al., Nucl. Instr. and Meth. A 735, (2014) 532
[21] G. Wittwer , “Clock Event Number Transmitter Receiver Universal Mod-ule”, User’s Manual , GANIL July 2004
[23] J. Giovinazzo et al., Nucl. Instr. and Meth. A 840 (2016) 15-27 [24] G. Jhan, Workshop on Active Targets and Time Projection Chambers for
High-intensity and Heavy-ion beams in Nuclear Physics(2018) [25] magboltz.web.cern.ch/magboltz/
[26] T. Roger et al., Nucl. Instr. and Meth. A 638, (2011) 134-142 [27] O.B. Tarasov, D.Bazin, Nuclear Physics A 746, (2004) 411c-414c [28] J.F. Ziegler, J.P. Biersack, U. Littmark, The stopping and range of Ions in
Solids, Pergamon, New York, 1985
[29] K. Artemov et al., Sov. J. Nucl. Phys. 52, 408 (1990)
[30] V. Z. Goldberg and A. E. Pakhomov, Phys. At. Nucl. 56, 1167 (1993) [31] J. Ziegler , http://www.srim.org/
[32] C.-E. Demonchy, PhD. Thesis, Universit´e de Caen (2002) https:// tel.archives-ouvertes.fr/tel-00004117
[33] T. Roger, PhD. Thesis, Universit´e de Caen (2009) https://tel. archives-ouvertes.fr/tel-00424010
[34] R.R. Carlson et al., Physical Review 122, 607-616 (1961) [35] R. Azuma et al., Phys. Rev. C 81, 045805, (2010) [36] ENSDF, http://www.nndc.bnl.gov/ensdf/ [37] J. Bradt et al., Phys. Lett. B 778, 155, (2018)