HAL Id: halshs-01832318
https://halshs.archives-ouvertes.fr/halshs-01832318
Submitted on 2 Oct 2018HAL is a multi-disciplinary open access archive for the deposit and dissemination of sci-entific research documents, whether they are pub-lished or not. The documents may come from teaching and research institutions in France or abroad, or from public or private research centers.
L’archive ouverte pluridisciplinaire HAL, est destinée au dépôt et à la diffusion de documents scientifiques de niveau recherche, publiés ou non, émanant des établissements d’enseignement et de recherche français ou étrangers, des laboratoires publics ou privés.
From hierarchy to networking: the evolution of the
“twenty-first-century Maritime Silk Road” container
shipping system
Liehui Wang, Yan Zhu, César Ducruet, Mattia Bunel, Yui-Yip Lau
To cite this version:
Liehui Wang, Yan Zhu, César Ducruet, Mattia Bunel, Yui-Yip Lau. From hierarchy to networking: the evolution of the “twenty-first-century Maritime Silk Road” container shipping system. Transport Reviews, Taylor & Francis (Routledge), 2017, 38 (4), pp.416-435. �10.1080/01441647.2018.1441923�. �halshs-01832318�
From hierarchy to networking: the evolution of the “twenty-
first-century Maritime Silk Road” container shipping system
Liehui Wanga,b, Yan Zhua,b, César Ducruet c, Mattia Buneld and Yui-yip Lau e,faCenter for Modern Chinese City Studies, East China Normal University, Shanghai, People’s Republic of China; bSchool of Urban and Regional Science, East China Normal University, Shanghai, People’s Republic of China; c
Centre National de la Recherche Scientifique (CNRS), Paris, France; dCOGIT, Institut Géographique National (IGN), Saint Mandé, France; eDivision of Business, Hong Kong Community College, The Hong Kong Polytechnic
University, Hong Kong, People’s Republic of China; f
Transport Institute, University of Manitoba, Winnipeg, MB, Canada
This article is the pre-final version of the work published in Transport Reviews, Vol. 38, No. 4, pp. 416-435
Abstract
Container shipping gives a rise of international trade since the 1960s. Based on navigation data start from the mid-1990s to 2016, this paper empirically analyses the spatial pattern of China’s international maritime linkages along the “twenty-first-century Maritime Silk Road”. We interpret such evolutionary dynamics in terms of growth, hierarchical diffusion and networking phases. Networking is a new stage of the evolution of the port system, which is approached based on the graph theory, complex network methods and geomatics, the paper discusses the networking’s basic characteristics: multi-hub spatial agglomeration, the connection of the network develops across space, functional differentiation and a division of labour appear among ports. Our results show that, while the scope of China’s maritime linkages had expanded overtime, more foreign ports become connected to the “Maritime Silk Road”. In addition, the external linkages of domestic ports tend to be dispersed, reflecting upon the decline of Pearl River Delta ports and the rise of Yangtze River Delta ports, with mixed evidence for the Bohai Rim region. Lastly, the analysis underlines the emergence of a polycentric shipping system, from the Hong Kong dominance to the more diversified Shanghai/Ningbo/Shenzhen configuration. Academic and managerial implications are included.
Keywords:Maritime Silk Road; shipping system; spatial pattern; networking 1. Introduction
“The Belt and Road” is referred to the “Silk Road Economic Belt” and “twenty-first century Maritime Silk Road” (hereafter called “Maritime Silk Road” or MSR). The Belt and Road is aimed at borrowing the historical legacy of the Ancient Silk Road, in order to actively develop economic partnerships with countries along it. The MSR is a sea channel for econ- omic and cultural exchanges between China and other parts of the world. The MSR not only limits to the ASEAN, but also aims to enhance exchanges with other neighbouring countries and regions, to develop a strategic cooperative economic zone facing the South China Sea, the Pacific and India oceans, and to focus on the integration of economy and trade with Asia, Europe and Africa as a long-term development goal. MSR covers more than 60 countries, now accounting for more than 35% of the world’s merchandise trade and around 30% of global GDP. MSR would contribute 80% of global GDP growth by 2050 (HKTDC, 2017). In principle, the Belt and Road has demonstrated 5 core areas of
cooperation pertaining to policy coordination, network connectivity, trade and invest- ment, financial integration and cultural exchange. Regional cooperation and competitive- ness will be significantly enhanced (HKTDC, 2017).
The proposed paper takes the so-called MSR strategy proponed by the Chinese govern- ment as an opportunity to push further the understanding of China’s changing maritime position globally. Although Chen and Hu (2016) analysed the shipping networks of South- east-Asian route along MSR, while Zhang, Huang, and Hu (2017) evaluated the hub pos- ition of the East Asian port under MSR. A significant contribution was provided by Tran and Haasis (2014) in their empirical analysis of liner shipping networks along the so- called East–West corridor between 1995 and 2011 even if their studies considered connec- tivity patterns between main regions as nodes, not port nodes. Overall, other previous studies of the MSR are primarily based on qualitative analyses published either in media reports or other press releases, to such an extent that a more objective and quantitative overview remains a seriously ignored. In addition, several reports published by either inter- national or local organisations as well as the press well covered and developed the signifi- cance of the MSR concept for Western countries and ports. Yet, a comprehensive, quantitative analysis of the spatial evolution of the MSR before, during, and after its official announcement remains missing in the literature. Chinese companies such as COSCO Ship- ping, China Merchants Group, SIPG are increasingly involved in port projects of MSR. It is important to find out which ports and routes are vital to China over the past 10–20 years and which ports will generate good development potential in the future. Pushing further our understanding of the current patterns and challenges of the emerging MSR, we can provide a theoretical and empirical basis upon which a better overview can be provided in order to enhance cooperation and integration along such a key twenty-first century trunk line.
This paper is split into six main sections. To begin with, an introduction is given in Section 1, Section 2 conducts a literature review about existing academic works having looked at the MSR through various quantitative methods. After that, Section 3 shows the data and methodology. We are based on shipping linkages among world ports to analyse a network within the MSR region. Main results are to describe evolutionary stages and characteristics of such a network and spatial pattern in Sections 4 and 5, respectively. Finally, a brief discussion and conclusion are provided in Section 6.
2. Literature review
In the 1950s, researches on shipping systems still remained at an infant stage, as port geo- grapher mainly focused on individual ports, port cities and countries without paying much attention to formalised inter-port relationships (Rimmer, 1967). Since the late 1960s, con- tainer shipping has been achieved important milestones such as intermodalism, techno- logical innovations and international trade facilitation (Lau, Ng, Fu, & Li, 2013). Yet, both Chinese and foreign scholars gradually improved their understanding of shipping systems from different perspectives. Some theoretical aspects were outlined by pioneer- ing models of port system evolution in developing countries (Taaffe, Morrill, & Gould,
1963), giving birth to a six-stage model leaning towards concentration on one main gateway. Later on, Hayuth (1981) updated such a model through five stages based upon the evolution of U.S. container ports. At the more local level, other models were pro- posed, such as those of Bird (1971)’s Anyport model, Hoyle (1989)’s evolutionary model of the port-city interface, and Notteboom and Rodrigue (2005) updated the original model by incorporating dry ports and offshore hubs. Throughout Western studies, most empirical researches paid attention to the geographic distribution of specific ocean carriers (e.g.
Fremont, 2007), to the partial overlap between carrier networks and terminal operator net- works (Parola & Veenstra, 2008), and to the topological features of regional and global shipping networks (e.g. Ducruet, Lee, & Ng, 2010; Ducruet & Notteboom, 2012). Another approach had been to provide a supply chain approach to shipping networks (Lam & Yap, 2011), with useful and concrete discussions about the design, logistical and time con- straints of such networks (Imai, Shintani, & Papadimitriou, 2009; Karsten, Pisinger, Ropke, & Brouer, 2015, 2016) in the more “operations research” field. Yet, one central question of the proposed paper is whether such global approaches apply to the particular case of China, Chinese ports, and their related shipping networks in a context of gradual expansion in the last decades and in the near future.
China’s container shipping activity began in the late 1970s. Domestic scholars con- ducted relevant research since the 1990s and mainly in the mid-2000s to unravel China’s container transportation network, its position in the global shipping networks (in terms of physical flows), and within the networks of global transport firms (in terms of company organisations). The first group of studies takes China as the core subject of investigation, questioning its maritime connectivity in various ways (Comtois & Wang,
2003; Rimmer & Comtois, 2005).
Some studies have provided an analysis of the whole Chinese port system in terms of port throughput dynamics (Pan, Cao, Liang, & Wei, 2014; Wang & Ducruet, 2013). Song and Cui (2014) believed that the big jump of China’s container throughput has resulted mainly
from massive investment in terminal infrastructure and significant improvement in their operation and management. Some scholars focused on port integration mechanisms (Wang, Ducruet, & Wang, 2015). Some researchers also studied about the regional port systems or individual ports, sometimes shifting the focus towards the whole container transport network or the relationships between ports and their hinterlands in various regions, such as the Bohai Rim, the Yangtze River Delta, and the Pearl River Delta (Cao, Jiang, Chen, Wei, & Shuangbo, 2015; Liu, Wang, & Yip, 2013; Wang, 2007; Wang, Wang, & Ducruet, 2012; Wang & Hong, 2016; Wang, Zhang, & Ye, 2017). Pioneer works at the local level include more qualitative analyses of the vital role of Hong Kong for in South China’s port modernisation and connectivity (Song, 2002; Wang, 1998).
Other scholars preferably insisted on the influence of global shipping networks con- figurations on mainland Chinese ports at the level of large world regions (Xu, Li, Shi, Zhang, & Jiang, 2015). Ducruet, Cuyala, and El Hosni (2018) underlined barrier effects in the global maritime network linking cities of the world in the case of China.
The above studies have demonstrated the influence of global shipping networks on the development of local ports, mainly concentrating on the spatial pattern of port systems, shipping networks and the location and function of main hub ports. However, as far as
China is concerned, the existing research in this area is far from sufficient. Studies of the container handling industry, using the latest data from individual terminals, is still scarce up to date, especially when it comes to the precise understanding of the position of indi- vidual Chinese ports at the global or regional (transnational) level, except from the study by Wang and Ng (2011) about the maritime forelands of Chinese ports.
Lau, Ducruet, Ng, and Fu (2017) reviewed 294 research papers to highlight the emer- gence of maritime network design has placed the importance of contemporary research in the past two decades. Maritime network analysis from a quantitative perspective, and especially about the MSR region, still remains much limited and fragmented across the academic spectrum (Ducruet, 2015). Ducruet and Notteboom (2012) used the single linkage analysis method to reveal the changing spatial pattern of the so-called “nodal regions” composing the global container shipping network. They particularly showed that Hong Kong was at the centre of the largest nodal maritime region in 1996, expanding across the Pacific and up to the African and European shores, while it expanded dramati- cally in 2006 as it comprised nearly the whole of Africa. Other quantitative works on the global container shipping network hinted at a number of trends but with large regions as the unit of analysis, such as in the works of Lau et al. (2017), Xu et al. (2015) and Li, Xu, and Shi (2015), confirming the growing importance and centralisation upon East Asia. Providing a more detailed overview of the evolution of this particular MSR shipping system is thus the main objectives of our research.
3. Data and methodology
3.1. Data
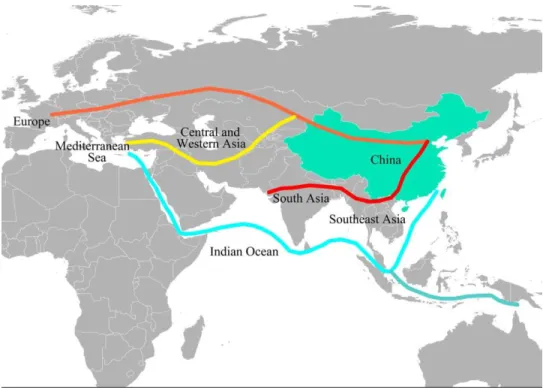
The countries and regions composing the MSR represents a key part of China’s inter- national maritime transport. Since the MSR is an open and cooperative networks, it shows no precise spatial definition and geographic delineation (Figure 1). It is often described as a corridor starting at China’s coastal ports and further extending up to Europe through the South China Sea and the Indian Ocean. This study thus includes all ports belonging to border countries and regions along this route (see Figure 2; Wang & Hong, 2016).
The data used in this paper are collected from China Shipping Weekly and Lloyd’s List Intelligence (LLI). China Shipping Weekly gives a comprehensive container flows between China (including Taiwan except in 1995) and the rest the world. This weekly magazine was founded in 1993 as the authoritative shipping information source. Also, it was managed by the National Development and Reform Commission and sponsored by the China Communications and Transportation Association. Key information includes con- tainer ship’s destination port, departure and arrival time, vessel name and voyage, to name but a few. Based upon this source, it was possible to construct a container shipping system composed of nodes (ports) and edges (routes). It includes a total of 133, 117, 145 container ports in 1995, 2005, 2015, respectively.
The same methodology was applied to a complementary source obtained from LLI, which condenses most of the world containerships’ daily movements for the last decades. A good example of using such data is the recent study by Ducruet and Wang (2018) of China’s global shipping connectivity since the late nineteenth century. We
Figure 1. Maritime Silk Road geographical map. Source: HKTDC (2017).
extracted the flows that occurred between China and all the ports situated along the MSR up to North Europe in order to map these flows at different points in time, namely 1997, 2001, 2005, 2009, 2013 and 2016. It is important to notice that LLI flow data had been incorporated into a geovisualisation tool made by the authors to map their volume and distribution by link and by port (for more information about this tool, see Ducruet & Bunel, 2017). The cartography of the MSR is provided in this article based on a new Geo- graphic Information System entitled Geoseastems, which recently allowed mapping the spatial patterns of mega-ship traffic around the globe (Ducruet & Berli, 2018). It results
in a collection of maps capable of grasping the essential spatial features of this spatially embedded object between 1997 and 2016. Based on vessel movement data obtained from the world’s leading marine insurer Lloyd’s List, we assigned weighted inter-port flows to a virtual maritime grid with Twenty-foot Equivalent Units as the unit of analysis. The underlying port-to-port matrix only comprises mainland China ports and Hong Kong, together with their overseas linkages with the ports of the MSR region, based on 2 aggre- gated months of daily movements each year (i.e. May–June). Domestic flows were ignored but international dynamics were recognised. The port hierarchy as well as the density of flows exhibit both stability and change over the study period. The number of connected ports evolved between 76, 96, 100, 125, 131 and 92 for the last year. In 2016, there was a decreasing number of connected ports due to a shorter time coverage of the data and the time series ends on June 22 instead of June 30.
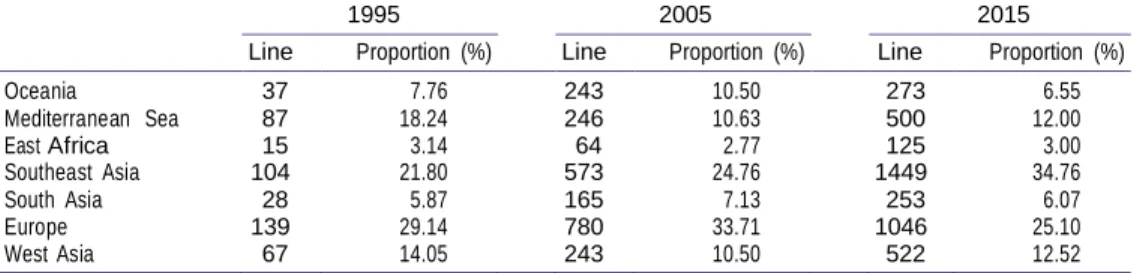
From the perspective of the route proportion changes between China and MSR area in 1995–2015 (see Table 1), the routes’ proportion between China and Southeast Asia and
Europe was over 50%. Southeast Asia and Europe are important forelands of China.
3.2. Methodology
3.2.1. Graph-theoretical tools
In the study of spatial flows, the concept of the hub is characterised by the functions of cen- trality and intermediacy (Fleming & Hayuth, 1994) as well as by processes of agglomeration, diffusion and the integration of the latter two. Since U.S. geographers introduced mathemat- ical tools in the early 1960s, Graph theory is widely used in research studies of spatial net- works and flows occurring across space, especially in transport geography (Ducruet & Beauguitte, 2014), especially in transport geography. This paper uses Origin-Destination mar- itime flow data to identify international maritime hubs and their position in the network by means of several calculations and algorithms. The main steps of the analysis are as follows: (1) Build the O-D matrix. Build the O-D matrix X according to the flows between domestic
and foreign ports, O as the departure port, D as the terminal port, xij as the actual number of shipping lines from port i to j. Then, the new matrix Y is obtained by a stan- dardisation process according to the maximum value of xij :
yij = xij /max (xij ), (1) 0 ≤ yij ≤ 1(i, j = 1, 2, . . . , n),
Table 1. The route proportion changes between China and MSR area, 1995–2015.
1995 2005 2015
Line Proportion (%) Line Proportion (%) Line Proportion (%)
Oceania 37 7.76 243 10.50 273 6.55 Mediterranean Sea 87 18.24 246 10.63 500 12.00 East Africa 15 3.14 64 2.77 125 3.00 Southeast Asia 104 21.80 573 24.76 1449 34.76 South Asia 28 5.87 165 7.13 253 6.07 Europe 139 29.14 780 33.71 1046 25.10 West Asia 67 14.05 243 10.50 522 12.52
X
(2) Calculating process. xij and yij both reflect the direct relation between ports in matrix X and Y. In fact, there is an indirect connection between ports. Indirect contact is con- tained in the node level and needs to be modelled. First, the adjacency matrix Y is con- structed, the indirect relation among nodes is weakening with n value is increasing. The indirect connection matrix A is derived according to the following formula:
aij =
kyik ykj (k = 1, 2, . . . , n), (2) In formula: aij is the element of the matrix Yn, yik is the connection load between node i
and k, ykj is the connection load between node k and j. The above formula combines
the indirect relation of n terms.
(3) Calculating equation. Define the element bij in matrix B is the sum of direct and indirect con-
nections between port i and j, let I as the unit matrix, since the initial data does not have a directed circle, the matrix (I–A) is invertible, that is, there exists an inverse matrix (I−Y )−1
that represents the number of paths from node i to j, the matrix is calculated by Matlab7.1:
B = (I − Y )−1 − I. (3)
3.2.2. Herfindahl-Hirschman index
Concentration, concentration ratio, Herfindahl-Hirschman index (HHI), Lorenz curve and Gini coefficient are commonly engaged in measuring the degree of concentration and dis- persion. HHI can accurately reflect the relative size of the major ports in the port system (Pan, Cao, Liang, & Wei, 2013). HHI has the advantages of considering both absolute and relative concentration, while avoiding their respective shortcomings. Although this index is widely employed in the research on container ports, it has some defects such as the influence of sample size on the results. Therefore, this paper adopts a HHI modified by Pan et al. (2013) to measure the concentration and dispersion degree of domestic and international container ports along the MSR. Thus, it can lower the effect of sample size on the calculation results. Its formula is as follows (Pan et al., 2013):
H∗ = n 2 ij i=1 n 2 Xij i=1 1 1 − n 1 − n . (4)
The calculation is according to route data in this paper. In the formula, n as the number of ports in the port group or port system, Xij as the number of routes of port i in port group j
or port system j, H* as modified concentration dispersion index for the port group j or port system j. 0<H*<1. On the one hand, H* → 1 implies the routes distribution of the port group or port system tends to be concentrated. On the other hand, H* → 0 explains the routes distribution of the port group or port system tends to be dispersing.
4. The evolution of the MSR shipping system
Economic factors, complex shipping networks design and diverse geographical location are the driving forces for the generation and evolution of container ports, notably
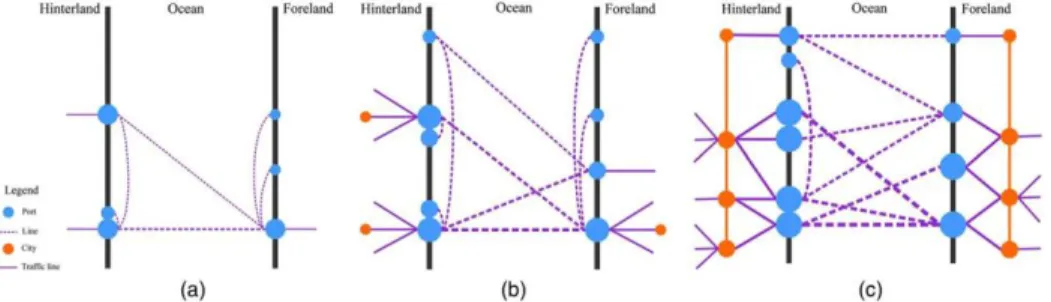
international trade patterns (Zheng, Zhang, & Huang, 2017). In accordance with early port system evolutionary models (Hayuth, 1988; Notteboom & Rodrigue, 2005; Rimmer, 1967; Robinson, 1998; Taaffe et al., 1963), the evolution and development of the shipping system along the MSR area can be summarised by the following stages: growth, hierarchy and networking (Wang & Zhu, 2017).
4.1. Growth stage (1980s–1990s)
In this stage, the whole system structure is growing, but the number of ports in the system remains relatively small. A few container ports were gradually became the largest and most central ports after the adoption of the new container technology. Main linkages between central ports and the MSR remained stable, notwithstanding an increase in the number of scheduled links. Linkages between secondary ports and the MSR often occurred through the already established major central ports. The so-called “preferential attachment process” is specific to scale-free networks (see Barabási & Albert, 1999). In the growth stage, domestic routes were mainly concentrated on the Pearl River Delta, with marked differences between North and South in terms of traffic levels and connec- tivity. Hong Kong was nearby Southeast Asia where it has received benefits from a favour- able geographical position, a sound ship registration system and more relaxed and preferential tax policies. To this end, Hong Kong enhanced its main role as a main connec- tor between China and the rest of the world (Wang & Cheng, 2010; Wang & Ducruet, 2013). Most major container seaports in China act as feeder ports towards the Hong Kong hub, while other large mainland Chinese ports had not yet developed and independent from ocean routes. Yet, Shanghai benefitted from its unique geographical advantages such as the interconnection between seaports and Yangtze River ports, and the development and opening of the new Pudong area in Shanghai in 1990. Shanghai has gradually forming a dual system with the Pearl River Delta (Wang & Ducruet, 2012).
4.2. Hierarchical stage (2000s–2010s)
In this stage, a small number of central ports became hub ports according to their initial advantages and pursued economic growth in their hinterland. The number and scale of the secondary hubs grew rapidly, but the gap between them and major hub ports were also expanded. Port competition continued to develop through a division of functions between various ports, for examples, the hub-and-spoke or hub-and-feeder configuration within main Chinese port clusters, such as the Pearl River Delta and the Yangtze River Delta. In foreign countries, the position of the hub port in each sub region is consolidated, with multiple shipping hubs in the shipping system. Intertwined layers of centrality tend to emerge and articulate with each other, as in the generic model of Robinson (1998) in his seminal paper on hub-feeder networks in Asia. External hub ports such as Singapore and Busan maintained their dominance upon a number of Mainland Chinese ports (Ducruet, Lee, & Ng, 2011).
4.3. Networking stage (2010s–)
Networking is a spatial structure supported by the tangible and virtual network with multi centres and nodes. It is a functionally integrated shipping networks in which new links
develop beyond spatial proximity. There are interdependencies and sustainable develop- ment dynamics among multiple hubs, as well as co-opetition with each other, but also within China itself (Song, 2003). Each of them have comparable traffic shares and partici- pate in local networks, while connecting with the global network.
The networking shipping system has the following basic characteristics.
Firstly, it exhibits multi-hub spatial agglomeration. There are a number of hub ports within the region, but without a dominant position in either a size or function. Basically, the spatial organisation is not a hierarchical system, but a more flat and flexible network organisation.
Secondly, the connection of the network develops across space. There is a relatively close spatial relationship between multiple hubs and secondary ports. Spatial linkages are not limited to vertical linkages (i.e. one-way connection from larger ports to smaller ports, ports in different sizes may assume different port functions). Therefore, there is a high dependence on each other. The functional connection of each other creates multi-directional and networking, which differs from the traditional hub-feeder system.
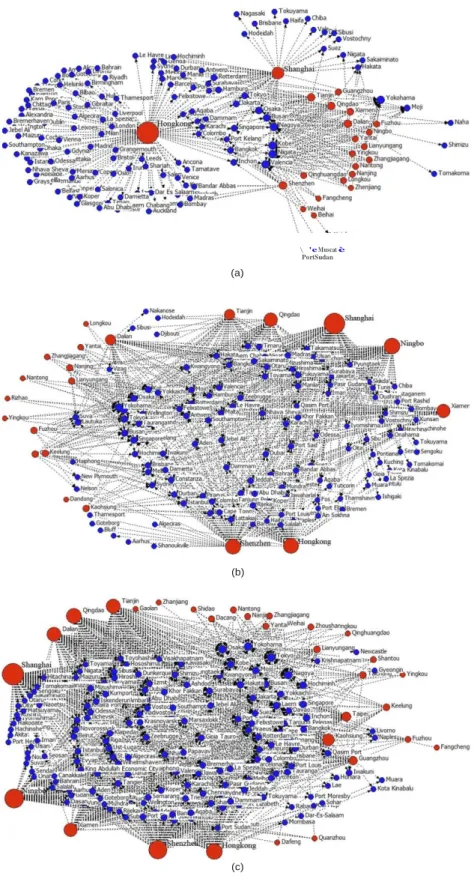
Thirdly, functional differentiation and a division of labour appear among ports. Some ports developed into logistics centres while others increased their container traffic volume (see Figure 3).
Session 5, focuses on the empirical analysis of the characteristics of the port container system in the networking stage.
5. The characteristics of MSR shipping system in networking stage
5.1. Multi-hub spatial agglomeration
In this stage, the Peripheral Port Challenge Mechanism (Hayuth, 1981) began to emerge, the development of a small number of major hub ports is restricted by the limitations of the dock and the increasing cost on the cargo handling and port dues. As a result, its devel- opment speed is obviously slowing down. The position of secondary ports situated at the periphery of central hubs are further improved because of their development speed is faster than the latter. The mechanism of competition and cooperation between ports have been fully developed. The shipping system has been improved continuously from a hierarchical structure to network. Ports adjacent to each other form a dual hub port
Figure 3. Evolution of the MSR shipping system, 1980s– (a) Growth stage, (b) Hierarchical stage and (c)
model in the Pearl River Delta and the Yangtze River Delta region (see Cullinane, Teng, & Wang, 2005; Wang & Ducruet, 2012). Physical cargo handling operations are partly trans- ferred from Hong Kong to Shenzhen. Ningbo port changed from a secondary node to a central hub port along the MSR, and the development of the Bohai region leans towards large-scale traffic and improved network connectivity. More and more foreign ports are embedded in the MSR shipping system. The challenge of the peripheral port on central hub port is becoming more and more obvious as well as the gap of the port scale began to narrow.
The Chinese port system has transformed into multiple shipping centres. Based on
Table 2, the number of Chinese ports connected with the MSR area remains rather few, namely 10, 15 and 19 ports in 1995, 2005 and 2015, respectively, including 10, 13 and 15 mainland Chinese ports. Based on routes data between ports, construct the O-D matrix and calculate the matrix data using Matlab7.1 software according to graph-theor- etical tools, we classify Chinese seaports by using the K-means classification method. Three classification results are obtained: major hub ports, secondary hub ports and general ports. According to Table 2, we counted 3 major hub ports, 4 secondary hub ports and 12 general ports in 2015. Among those ports, all major hub ports have maintained their linkages with the MSR area and enjoyed the largest foreland scope from 1995 to 2015. Secondary hub ports have demonstrated a narrower foreland and general ports only maintain strong ties with Southeast-Asian regions.
From the change of hub port, Hong Kong is the only hub port of China connected to the MSR area in 1995. Hong Kong has a wide range of connectivity and acted as a transit port, it plays significant transshipment and re-export functions (Wang, 1998). As already dis- cussed by Wang and Ng (2011), Pearl River Delta ports are close to Southeast and South Asia, and actively connect the MSR as a reflection of the economic vitality of their hinterlands, and their millenary role as gateways of the ancient MSR in modern times. In 1978, China implemented the open door policy. The Pearl River Delta region is the fore- runner of the open door policy in China. It is an important economic centre which plays a leading role and an important strategic position in the national economic development. In addition, the gradual spread of container technology across the world in the 1960s first benefited Hong Kong followed by other Pearl River Delta ports in the late 1970s. This “early mover” advantage became gradually redistributed to other regions such as the Yangtze River ports.
In 2005, the status of Shanghai and Shenzhen ports rose rapidly and became hub ports. They even surpassed Hong Kong in terms of port status. In 2015, Ningbo also became a hub port and Hong Kong stepped out of this category to become a secondary hub port. The decline of Hong Kong’s connectivity suggests that China’s international maritime transportation along the MSR area has changed from indirect relation to direct relation.
At the same time, according to Table 2, the spatial extent of the transportation network shifts from south to north. Southwest seaports such as Beihai and Fangcheng left the MSR shipping network while central Bohai ports increased their connectivity in that system. Initially, main hub was in Hong Kong and the secondary hub port was in Shanghai (1995), both in the south of the Yangtze River Estuary. Beihai and Fangcheng kept shipping links with Haiphong, Singapore and Bangkok in 1995, but such linkages disappeared from 2005 onwards. The north ports, such as Qingdao, Tianjin and
Table 2. International maritime transport hubs of China to MSR area.
1995 2005 2015
Hub port Secondary hub port General port Hub port Secondary hub port General port Hub port Secondary hub port General port
Hong Kong Shanghai Shenzhen Shanghai Ningbo Dalian Shenzhen Hongkong Tianjin
Tianjin Shenzhen Xiamen Kaohsiung Shanghai Qingdao Dalian
Beihai Hongkong Qingdao Guangzhou Ningbo Xiamen Guangzhou
Qingdao Tianjin Keelung Kaohsiung Taipei
Guangzhou Lianyungang Fuzhou
Xiamen Dandong Keelung
Dalian Fuzhou Quanzhou
Fangcheng Nanjing Lianyungang
Shantou Taichung
Yingkou Zhoushan Notes: K-means algorithm uses Euclidean distance as similarity measure to find the optimal classification of an initial clustering centre vector V, which makes the evaluation index J minimum. First,
choose k objects as the initial cluster centre from the n data objects, other objects were assigned to the most similar clustering according to the similarity of these objects and cluster centres (distance), and then calculate each new cluster centres (the mean of all objects in the cluster), repeatedly, until the standard measure function converges.
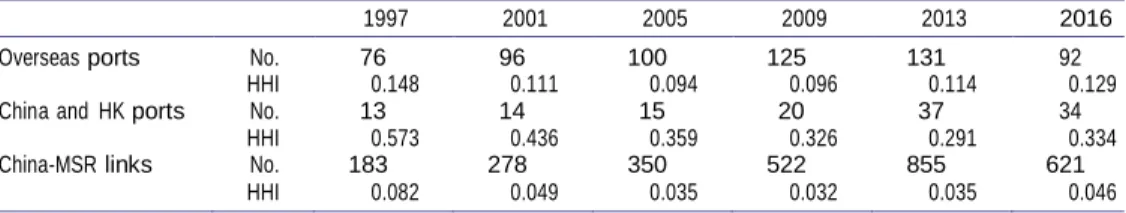
Table 3. Concentration indices for Chinese and foreign ports and links in the MSR area, 1997–2016.
1997 2001 2005 2009 2013 2016
Overseas ports No. 76 96 100 125 131 92
HHI 0.148 0.111 0.094 0.096 0.114 0.129
China and HK ports No. 13 14 15 20 37 34
HHI 0.573 0.436 0.359 0.326 0.291 0.334
China-MSR links No. 183 278 350 522 855 621
HHI 0.082 0.049 0.035 0.032 0.035 0.046 Source: own elaboration based on Lloyd’s List Intelligence, 1997–2016.
Dalian built more routes with the MSR area after 2005 and their status became more important in MSR networks.
The HHI calculation results show that HHI of domestic ports along the MSR area reduced from 0.573 in 1997 to 0.334 in 2016 (see Table 3), which underlines a process of decentra- lisation during the study period.
The evolution of concentration indices of overseas ports (Table 3) witnesses two major phases: de-concentration and re-concentration. Such a process suggests that the MSR overseas ports went through a dispersion stage (1997–2005) with the inclusion and devel- opment of additional nodes and a centralisation stage (2009–2016). Due to a consolidation dynamic around fewer major nodes or hub ports, the evolution of concentration indices for China and Hong Kong ports as well as China-MSR links experienced a dispersion stage (1997–2013). In 2016, the indices presented the number of ports and links are less than before.
Notably, the connection of the top three ports (Hong Kong, Shanghai and Shenzhen) reached 89.5% in 1995. However, this share (Shenzhen, Shanghai and Ningbo) has been decreased to 60.6% in 2015. The proportion of the top three ports has been declining which shows the characteristics of diversification. One of the reasons of Chinese port decentralisation is policy issues. Ports have become an engine of local economic develop- ment. Under the mode of port management localisation, the port investment and con- struction are the common means to promote regional economic development and improve performance. And open investment to foreign country is based on the catalogue for the guidance of foreign investment of 2002 can make up the short of domestic invest- ment. Guangzhou, Xiamen, Qingdao, Tianjin ports received the foreign investment and the other small ports such as Quanzhou, Lianyungang, Taicang port obtained the investment from COSCO and local government. The second reason is that in the process of port devel- opment, the increasing throughput and limited resources of port resulted in short supply of port cargo. Hubport, such as Hong Kong began to show the scale inefficiency and supplies were diverted to the surrounding port. Chinese ports began to appear diversifica- tion (Wang, Yeo, & Ng, 2014).
5.2. Connection of the network develops across space
Route is a vector index of direction. The orientation and concentration can reflect the direction of the external connection of a port (Wang, 2012). The distribution of routes in foreign ports provides the connection of the network across space.
As mentioned in Table 2, there are 12 general ports in 2015. Half of them (i.e. Quanzhou, Shantou, Taibei, Taichung, Yingkou, Zhoushan) were subsumed into the MSR firstly. The six
Table 4. The number of general ports’ routes in 1995, 2005, 2015.
Port Year Oceania Med East Africa Southeast Asia South Asia Europe West Asia Total
Dalian 1995 0 0 0 3 0 0 0 3 2005 9 4 0 14 2 53 0 82 2015 0 15 1 47 10 57 29 159 Tianjin 1995 0 1 0 6 1 6 4 18 2005 11 4 1 35 10 52 8 121 2015 11 11 6 49 18 54 24 173 Guangzhou 1995 0 0 0 0 0 6 0 6 2005 13 0 0 3 0 0 0 16 2015 3 16 7 40 6 17 2 91 Fuzhou 2005 8 0 1 3 0 0 0 12 2015 0 0 4 16 0 0 0 20 Keelung 2005 3 2 0 5 0 2 2 14 2015 5 0 1 8 0 0 0 14 Lianyungang 2005 2 2 0 2 0 8 0 14 2015 0 0 0 8 0 0 0 8 Quanzhou 2015 0 0 0 14 0 0 0 14 Shantou 2015 0 0 0 7 0 0 0 7 Taichung 2015 0 0 0 4 0 0 0 4 Taipei 2015 0 3 0 17 5 13 14 52 Yingkou 2015 0 0 0 4 0 0 0 4 Zhoushan 2015 0 0 0 1 0 0 0 1
Source: China Shipping Weekly, 1995–2015.
ports mainly built routes with the ports in Southeast Asia (see Table 4). Dalian port is located in the North China where it is the greatest distance from MSR. In 1995, it only had 3 routes to connect with the ports in MSR. However, it built 159 routes in 2015, especially with the ports in Europe and Southeast Asia. Tianjin port is the largest artificial port in China in winter, Tianjin port area will face an obstacle due to different sea ice levels. But Tianjin port had established 173 routes which covered all the navigating zones in MSR. Guangzhou port is situated in Pearl River Delta and its condition is worse than Shenzhen port and Hong Kong port. It had no deepwater wharfs before Nansha port area launched in 2004. It also faced stiff competition with Shenzhen port and Hong Kong port. In 2015, it built 91 routes with MSR. Except the hub ports and secondary hub ports, the general ports have created more and more linkages with the ports in MSR. As the Belt and Road is an important strategy, it is a good opportunity for the small ports to get the support from central government. Thus, the local governments and ports are eager to develop the close relationships with MSR.
In 1997, the MSR mainly consisted in a main corridor concentrating flows between Hong Kong and Singapore (see also Ducruet et al., 2011). The “heart” of the MSR and
the rest of the region being connected through secondary linkages. As mentioned above, an expansion and densification of the corridor still with Hong Kong as the major hub but with stronger connexions with Taiwan and North Europe (Benelux) in 2001. This pattern reinforced over time in 2005, but a significant expansion of the MSR towards Shanghai and Northern China is clearly visible from 2009 onwards. In 2016, fewer overseas ports are connected with Hong Kong/China, especially remote ones, but the volume of flows had witnessed rapid growth across the whole MSR (see Figure 4). This confirms China’s MSR policy succeeded and resulted in a much heavier activity than in the past. It also implies that major carriers serving this route and region had increasingly rationalised their services, especially with the advent of mega-ships and slow steaming, resulting in a drastic port selection process.
Figure 4. Spatial patterns of maritime transport linkages between China and other countries along the MSR area. (a) 1997, (b) 2001, (c) 2005, (d) 2009, (e) 2013 and (f) 2016. Source: own elaboration based on Lloyd’s List Intelligence, 1997–2016.
5.3. Functional differentiation and division of labour appear among ports
According to the aforementioned classification, China’s major hub ports have devel- oped from the single nodal system centred upon Hong Kong to a tripartite system including Shanghai and Shenzhen in 2005, and then to a more polycentric system com- prising Shenzhen, Shanghai and Ningbo in 2015. Such an evolution, based on degree centrality, using UCINET software for mapping, is well depicted in Figure 5. Among them, the size of the node indicates the contact area of the port, that is, the impor- tance of the port.
(a)
(b)
(c)
\ 'e Muscat è
PortSudan
Figure 5. A growing polycentricity of the Chinese port system in (a) 1995,(b) 2005 and (c) 2015. Source:
The growth rate of Shenzhen port has exceeded the one of Hong Kong from 1995 to 2015, as Shenzhen became China’s major hub in 2005. Hong Kong’s status declined in container transport was stemming from partial container operators has transferred to Shenzhen. And Hong Kong evolved towards a value chain centre (Wang & Cheng,
2010). Although the respective forelands of Shenzhen and Hong Kong are now overlap- ping, independent routes were gradually established from Shenzhen overtime. Thanks to open door policy in China, the manufacturing base has shifted from Hong Kong to China. The lower operating cost including labour cost, trucking fee and terminal handling charge has forced logistics companies intend to use Shenzhen as their consolidated logistics centre. The status of Hong Kong is largely determined by the transit function of its inter- national trade goods and the rapid development of mainland ports. This has made Hong Kong cost advantage is further weakened since the twenty-first centuries, resulting in the decline of Hong Kong’s position. After entering into WTO, more and more containers are selected from the local ports with more foreign investment diverted to the Pearl River Delta. With foreign equity restrictions lifted, more terminal operators will focus on invest- ments from Hong Kong to mainland ports, for example, Hutchison Whampoa invests intensively on Yantian terminal, Modern Terminals Limited invests heavily on Dachanwan port etc. The growth rate of Shenzhen port far exceeds Hong Kong. More than 60% of the goods directly ship out from the port of Shenzhen without passing through Hong Kong (Cheng & Wang, 2015).
Ningbo’s container port developed rapidly and the function of the international con- tainer hub port was becoming apparent increasingly (Cullinane, Teng, et al., 2005). Shang- hai’s connectivity surpassed that of Ningbo’s, the latter became closer to the former. However, geographically speaking, the foreland of Ningbo demonstrated much overlap- ping with the one of Shanghai even for some minor foreign ports. In fact, Ningbo exhibits very few independent and specific connections compared with Shanghai. But as the func- tion of port, Shanghai is eager to develop the high-end shipping service, such as shipping finance, shipping insurance, shipping registration and shipping legal service. The general goal of the construction of Shanghai international shipping centre is that by 2020. It will enter the forefront of the world shipping centres to deploy global shipping resources. Ningbo’s port conditions are better than Shanghai. Ningbo intends to ship more contain- ers through sea-rail intermodal transport and 13 dry ports in Zhejiang and Jiangxi pro- vinces. Also, it can tranship oil and ironstone based on its deep water. So, Ningbo and Shanghai ports are able to cooperate with each other to achieve diversified development.
6. Conclusion
From the 1970s–2000s, hub-feeder networks emerged in Asia (Robinson, 1998). Based on complementary and original shipping data sources, this paper analysed China’s overseas connectivity along the MSR and its evolution overtime, concluding to the successive emer- gence of development stages. Among them, networking has been identified in our research as a new stage in such an evolution. Compared with previous studies that touched directly or indirectly the MSR region through maritime network analysis, this paper demonstrated in-depth changes of port system development, such as a peripheral port challenge mechanism, a narrowing gap between ports, hinterland expansion through inland traffic nodes and a closer relationship between foreland and hinterland. This paper
proposes the shipping system development stage of networking in order to provide a theoretical basis for further study on the development of the port system, as claimed by early geographers (Rimmer, 1967). A port system development consists of various com- ponents to prepare for maritime logistics and transport hub under MSR. The elements of a port system development contain: new technology, safety, offshore Renminbi hub and liquidity pool, management know-how, the integration of port operators, intermodal trans- port with an extensive use of railway networks, availability of logistics services, sound ship registration system, deregulation, maritime forum, professional education and training.
Within the overall MSR strategy, China is eager to strengthen the partnership with Central and Eastern European countries so as to maintain regional growth and stability and enlarge the infrastructure networks. Chinese-based carriers like COSCO invested term- inal facilities in Piraeus (Greece) not only develops the maritime economies, but also main- tains security and peace in the Central and Eastern European regions (The European Union Academic Programme Hong Kong, 2017). In the future, Central and Eastern European regions will be the new emerging container shipping market in the world. The new con- tainer shipping routings among China, Central and Eastern European regions will be explored under MSR.
Port system’s networking not only represents a new form of spatial organisation, but also carries a new concept of development, emphasising the specialisation and cooperation of every connected port. It is necessary to coordinate their respective interests in order to strengthen their efficient cooperation and connectivity. Hence, an innovative institutional framework is needed to support it, which was designed relatively broadly by the MSR vision. The MSR spans across many countries, which is a port system composed of countries and regions with different interests, facing complex regional coordination and governance issues.
Network shipping systems will be dispersed various functions of the shipping hub and secondary hub port. Also, it keeps spatial contact through the network which provides equal development opportunities for each centre. The co-competition avoids high cooperation management cost between the governments and blind development with a lack of coordination.
Acknowledgements
This work was supported by the Research Grant of the National Natural Science Foundation of China [grant number 41371140], Major program of National Social Science Fund of China [grant number 16ZAD016], the MOE Project of Key Research Institute of Humanities and Social Sciences at Univer- sities [grant number 17JJD790007], the European Research Council under the European Union’s Seventh Framework Programme [FP/2007-2013]/ERC grant agreement n. [313847] World Seastems. Fundamental Research Funds for the Central Universities [grant number 2017ECNU-HWFW048].
References
Barabási, A. L., & Albert, R. (1999). Emergence of scaling in random networks. Science, 286, 509–512. Bird, J. (1971). Seaports and seaport terminals. London: Hutchinson University Library.
Cao, Y., Jiang, Z., Chen, H., Wei, W., & Shuangbo, L. (2015). The evolution course and mechanism of the port system along the Yangtze River. Progress in Geography, 34(11), 1430–1440.
Chen, F., & Hu, Z. (2016). Analysis of shipping network of Southeast-Asian route along Maritime Silk Road based on complex networks. Journal of Shanghai University(Natural Science), 22(6), 804–812. Cheng, J., & Wang, C. (2015). Evolution and dynamic mechanism of container port system in the Pearl
River delta. Acta Geographica Sinica, 70(8), 1256–1270.
Comtois, C., & Wang, J. J. (2003). Géopolitique et transports: Nouvelles perspectives stratégiques dans le détroit de Taiwan. Etudes Stratégiques, 34(2), 213–227.
Cullinane, K., Teng, Y., & Wang, T. F. (2005). Port competition between Shanghai and Ningbo. Maritime Policy and Management, 32(4), 331–346.
Ducruet. C., Cuyala, S., & El Hosni, A. (2018). Maritime networks as systems of cities: The long-term interdependencies between global shipping flows and urban development (1890–2010). Journal of Transport Geography, 66, 340–355.
Ducruet, C. (2015). Maritime networks: Spatial structures and time dynamics, Routledge studies in trans- port analysis. London: Routledge.
Ducruet, C., & Beauguitte, L. (2014). Spatial science and network science: Review and outcomes of a complex relationship. Networks and Spatial Economics, 14(3–4), 297–316.
Ducruet, C., & Berli, J. (2018). Mapping the globe. The patterns of mega-ships. Port Technology International, 77.
Ducruet, C., & Bunel, M. (2017). GeoSeastems: An innovative tool to map global shipping flows. Application to the Mediterranean region. Portus, 33. Retrieved from http://portusonline.org/en/ geoseastems-an-innovative-tool-to-map-global-shipping-flows-application-to-the-mediterranean- region/#
Ducruet, C., Lee, S. W., & Ng, K. Y. A. (2010). Centrality and vulnerability in liner shipping networks: Revisiting the northeast Asian port hierarchy. Maritime Policy and Management, 37(1), 17–36. Ducruet, C., Lee, S. W., & Ng, K. Y. A. (2011). Port competition and network polarization at the East
Asian maritime corridor. Territoire en Mouvement, 10, 60–74.
Ducruet, C., & Notteboom, T. (2012). The worldwide maritime network of container shipping: Spatial structure and regional dynamics. Global Networks, 12(3), 395–423.
Ducruet, C., & Wang, L. (2018). China’s global shipping connectivity: Internal and external dynamics in the contemporary era (1890–2016). Chinese Geographical Science, 28(2), 202–216.
The European Union Academic Programme Hong Kong. (2017). Retrieved from http://euap.hkbu. edu.hk/main/about/history/
Fleming, D. K., & Hayuth, Y. (1994). Spatial characteristics of transportation hubs: Centrality and inter- mediacy. Journal of Transport Geography, 2(1), 3–18.
Fremont, A. (2007). Global maritime networks the case of Maersk. Journal of Transport Geography, 15, 431–442.
Hayuth, Y. (1981). Containerization and the load center concept. Economic Geography, 57(2), 160– 176.
Hayuth, Y. (1988). Rationalization and deconcentration of the U.S. container port system. The Professional Geographer, 40(3), 279–288.
HKTDC, Belt and Road. (2017). Retrieved from http://beltandroad.hktdc.com/en/about-the-belt-and- road-initiative/about-the-belt-and-road-initiative.aspx
Hoyle, B. S. (1989). The port-city interface: Trends, problems and examples. Geoforum; Journal of Physical, Human, and Regional Geosciences, 20, 429–435.
Imai, A., Shintani, K., & Papadimitriou, S. (2009). Multi-port vs hub-and-spoke port calls by container- ships. Transportation Research Part E, 45, 740–757.
Karsten, C. V., Pisinger, D., Ropke, S., & Brouer, B. D. (2016). Time constrained liner shipping network design. Transportation Research Part E, 3, 1–11.
Karsten, C. V., Pisinger, D., Ropke, S., & Brouer, B. D. (2015). The time constrained multi-commodity network flow problem and its application to liner shipping network design. Transportation Research Part E, 76, 122–138.
Lam, J. S. L., & Yap, W. Y. (2011). Dynamics of liner shipping network and port connectivity in supply chain systems: Analysis on East Asia. Journal of Transport Geography, 19(6), 1272–1281.
Lau, Y. Y., Ducruet, C., Ng, A. K. Y., & Fu, X. (2017). Across the waves: A bibliometric analysis of con- tainer shipping research since the 1960s. Maritime Policy & Management, 44(6), 667–684.
Lau, Y. Y., Ng, A. K. Y., Fu, X., & Li, K. X. (2013). The evolution and research trends of container shipping. Maritime Policy and Management, 40(7), 654–674.
Li, Z., Xu, M., & Shi, Y. (2015). Centrality in global shipping network basing on worldwide shipping areas. Geojournal, 80(1), 47–60.
Liu, L., Wang, K. Y., & Yip, T. L. (2013). Development of a container port system in Pearl River delta: Path to multi-gateway ports. Journal of Transport Geography, 28, 30–38.
Notteboom, T. E., & Rodrigue, J. P. (2005). The port regionalization: Towards a new phase in port development. Maritime Policy & Management, 32(3), 297–313.
Pan, K., Cao, Y., Liang, S., & Wei, H. (2013). A study on formation and mechanism of multi-port gateway regions in the China’s container port system. Progress in Geography, 32(2), 214–222.
Pan, K., Cao, Y., Liang, S., & Wei, H. (2014). New tendency of Chinese container port system: 1998–
2010. Geojournal, 79(3), 373–384.
Parola, F., & Veenstra, A. W. (2008). The spatial coverage of shipping lines and container terminal operators. Journal of Transport Geography, 16, 292–299.
Rimmer, P. J. (1967). Recent changes in the status of seaports in the New Zealand coastal trade. Economic Geography, 43, 231–243.
Rimmer, P. J., & Comtois, C. (2005). China’s extra- and intra-Asian liner shipping connections, 1990–
2000. Journal of International Logistics and Trade, 3, 75–97.
Robinson, R. (1998). Asian hub/feeder nets: The dynamics of restructuring. Maritime Policy & Management, 25(1), 21–40.
Song, D. W. (2002). Regional container port competition and co-operation: The case of Hong Kong and South China. Journal of Transport Geography, 10(2), 99–110.
Song, D. W. (2003). Port co-opetition in concept and practice. Maritime Policy and Management, 30(1), 29–44.
Song, B., & Cui, Y. (2014). Productivity changes in Chinese container terminals 2006–2011. Transport
Policy, 35, 377–384.
Taaffe, E. J., Morrill, R. L., & Gould, P. R. (1963). Transport expansion in underdeveloped countries: A comparative analysis. Geographical Review, 53(4), 503–529.
Tran, N. K., & Haasis, H. D. (2014). Empirical analysis of the container liner shipping network on the east-west corridor (1995–2011). Netnomics, 15(3), 121–153.
Wang, C. (2012). The formation and evolution of container port network and its development mechan- ism. Beijing: The Science Publishing Company.
Wang, J. (1998). A container load center with a developing hinterland: A case study of Hong Kong. Journal of Transport Geography, 6(3), 187–201.
Wang, L. (2007). The port spatial relationship between Shanghai and Ningbo. Geographical Research, 26(6), 1209–1220.
Wang, J., & Cheng, M. (2010). From a hub port city to a global supply chain management center: A case study of Hong Kong. Journal of Transport Geography, 18(1), 104–115.
Wang, C., & Ducruet, C. (2012). New port development and global city making: Emergence of the Shanghai-Yangshan multilayered gateway hub. Journal of Transport Geography, 25, 58–69. Wang, C., & Ducruet, C. (2013). Regional resilience and spatial cycles: Long-term evolution of the
Chinese port system (221BC-2010AD). Tijdschrift Voor Economische en Sociale Geografie, 104(5), 521–538.
Wang, C., Ducruet, C., & Wang, W. (2015). Port integration in China: Temporal pathways, spatial pat- terns and dynamics. Chinese Geographical Science, 25(5), 612–628.
Wang, L., & Hong, Y. (2016). Spatial structure of container port systems across the Taiwan straits under the direct shipping policy: A complex network system approach. Acta Geographica Sinica, 71(4), 605–620.
Wang, J. J., & Ng, A. K. Y. (2011). The geographical connectedness of Chinese seaports with foreland markets: A new trend? Tijdschrift voor Economische en Sociale Geografie, 102(2), 188–204. Wang, C., Wang, J., & Ducruet, C. (2012). Peripheral challenge in container port system: A case study of
Pearl River delta. Chinese Geographical Science, 22(1), 97–108.
Wang, Y., Yeo, G. T., & Ng, A. K. Y. (2014). Choosing optimal bunkering ports for liner shipping com- panies: A hybrid Fuzzy-Delphi-TOPSIS approach. Transport Policy, 35, 358–365.
Wang, L., Zhang, S., & Ye, F. (2017). A study on the container shipping network of Shanghai and Ningbo ports. Resources and Environment in the Yangze Basin, 26(10), 1508–1516.
Wang, L., & Zhu, Y. (2017). The evolution of China’s international maritime network based on the “21st century mairtime silk road”. Acta Geographica Sinica, 72(12), 2265–2280.
Xu, M., Li, Z., Shi, Y., Zhang, X., & Jiang, S. (2015). Evolution of regional inequality in the global ship- ping network. Journal of Transport Geography, 44, 1–12.
Zhang, H., Huang, Y., & Hu, J. (2017). Evaluating the hub position of the East Asian port under the Maritime Silk Road. Journal of Central China Normal University, 51(2), 208–214.
Zheng, J., Zhang, Y., & Huang, X. (2017). Evolution of the Maritime Silk Road trade network structural characteristics in 2000–2014. Journal of International Trade, 3, 154–165.