RUGC 2021 AJCE, vol. 39 (1)
75
Influence of soil-structure interaction
parameters probability distribution law on
the transmission of ground movements to
structures
KRATZ Boris1, EL KAHI Elio1,2, DECK Olivier1, MEHDIZADEH Rasool1
1 Lorraine University, CNRS, CREGU, GeoRessources Laboratory, Mines Nancy, Nancy, France 2 Tractebel Engie, Gennevilliers, France
ABSTRACT Underground voids caused by tunneling or mining activity produce soil
movements and may expose structures to physical and/or functional damage. To assess structures vulnerability, soil-structure interaction (SSI) parameters are modeled using probability distribution laws to consider their complexity and their uncertainty. Therefore, the target of this paper is to evaluate the influence of the selection of distribution laws for each input SSI parameter on the structure response. Thus, continuous random variables are applied using Monte Carlo simulations, and two analytical models (elastic and elastoplastic) are considered to evaluate the transmission of ground movements to structures. Results reveal the significant influence of the choice of probabilistic laws of input parameters through a sensitivity analysis evaluated via Sobol variance-based method.
KEYWORDS Soil-structure interaction, probability distribution law, Monte Carlo simulations,
sensitivity analysis.
I. INTRODUCTION
Underground works have a significant role in establishing future urban cities based on a smart use of limited spaces. However, these works can significantly affect the soil and cause differential settlement under existing buildings which may lead to major damage (Bitarafan & Vahdani, 2020). Various approaches are used to predict the building deflection in response to ground movements (El Kahi et al., 2020). Among these approaches, only numerical methods offer great flexibility for considering the complexity of the SSI conditions (Franza et al., 2019); however, their use require long computation time for specific scenario cases which lacks the general application of their results. On the other hand, analytical methods, based on simple equations to represent the global trend of structural deflection, allow quick and effective calculations in the project proposal phase, and may be considered as a complementary tool to the numerical ones in the following phases. Therefore, to consider the complexity and the uncertainty of the phenomenon represented analytically by simplified assumptions, continuous random variables are applied. Thus, the SSI parameters are modeled using probabilistic distribution laws. The objective of this paper is to evaluate the uncertainty of analytical SSI models by assessing the influence of the choice of the statistical distribution of the input parameters.
RUGC 2021 AJCE, vol. 39 (1)
76
II. ANALYTICAL APPROACH
Analytically, to evaluate the transmission of ground movements to structures, the transmission rate (∆/∆0) may be used that compares the structure deformation (∆) to the free-field soil movement (∆0). This ratio depends upon the relative stiffness * evaluated via Eq. (2). When the soil has an elastic behaviour, ∆/∆0 is determined as follows (El Kahi et al., 2020):
(1)
(2) where EI represents the structure stiffness (E the Young's modulus, I its inertia), L its length, B its width, Es the soil Young's modulus and ν its Poisson's ratio. Considering an elastoplastic soil behaviour, a coefficient a is considered, where a depends upon the soil bearing capacity pult, the structure load q, the radius of curvature R, in addition to the elastic SSI parameters considered above (EI, L, Es, etc.)
(3) To study the analytical uncertainties, input parameters are usually considered as continuous random variables (Alén, 1998) that are usually distributed along a normal (Gaussian) or log-normal distribution. Thus, in this project, a symmetrical log-normal distribution (ND) is approached by an asymmetrical lognormal distribution (LND). In order to transform a ND into a comparable LND (similar mean ( or M) and standard deviation ()), a coefficient α has been introduced (Figure 1) to characterize the asymmetry of the LND.
When α decreases, the asymmetry of the LND increases. Figure 1 shows the formulas of the mean value, variance, mode (the most probable value: M0) and median (Me) of the ND, LND, and uniform distribution UD.
FIGURE 1.Normal distribution (ND) approached by UD and by LND.
III. METHODOLOGY AND RESULTS
To cover the spectrum of transmission rate values, numerous combinations of SSI parameters are carried out. These combinations involving, for each input parameter, different mean values, different coefficients of variation, different coefficients of asymmetry α and different statistical distributions (Table 1) that are based on previous SSI studies done by El Kahi et al., 2019 and
RUGC 2021 AJCE, vol. 39 (1)
77 Ching et al., 2016 that consider the uncertainties of evaluating the values of these input parameters.
TABLE 1. Models input parameters (N: Normal, LN: Log-Normal, U: Uniform).
Parameters
(Unit) values interval Parameters of variation Coefficient α values for Log-Normal approximation Distribution Function
L (m) [10,30] 5% 0.90 (2) / 0.995 (1) ND/LND/UD q (kN/m) [100,400] 10% 0.85 (2) / 0.90 (1) ND/LND/UD pult (kN/m) 1.5 q / / Constant EI (GN.m²) [20,500] 20% 0.85 (2) / 0.90 (1) ND/LND/UD Es (MPa) [40 ,500] 20% 0.85 (2) / 0.90 (1) ND/LND/UD R (m) [250,5000] 5% 0.90 (2) / 0.995 (1) ND/LND/UD
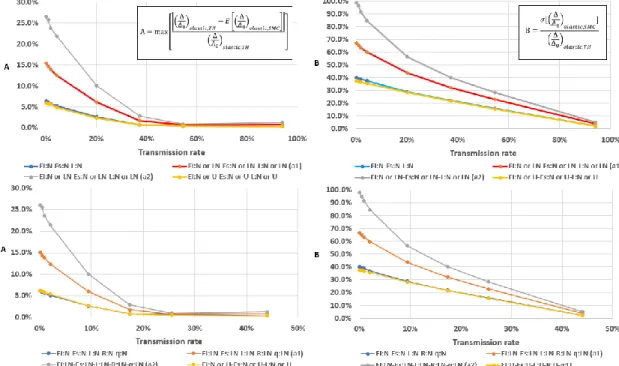
For each combination made, 100,000 simulations Monte-Carlo (SMC) are evaluated for each parameter. Thus, to assess the distribution choice on ∆/∆0, two factors (A and B) are defined (the maximum value of the relative deviation and standard deviation between deterministic theoretical (TH) and SMC calculated transmission rate).
FIGURE 2.Variability of the statistical distribution of transmission rate (evaluated via SMC in the elastic (figures above) and elastoplastic (figures below) models) compared to the deterministic transmission rate.
Figure 2 shows that the variability of the transmission rate decreases for high values of the theoretical transmission rate. Thereby, when the transmission rate increases, the sensitivity to model uncertainties decreases, regardless of the probabilistic law followed by the input parameters and the considered model (elastic or elastoplastic).
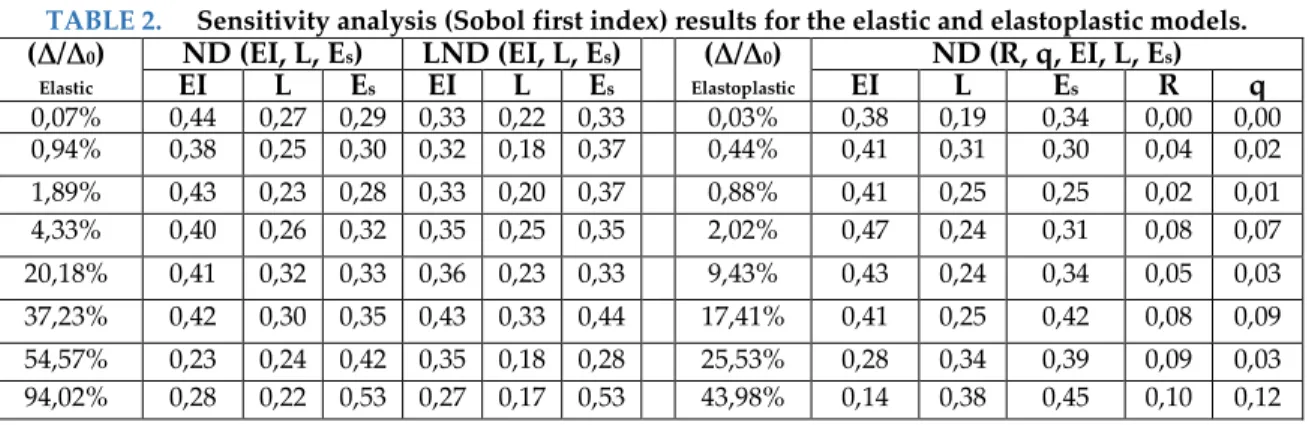
In order to evaluate the influence of the variability of every parameter, a sensitivity analysis is performed using Sobol indices considering that the input parameters are independent. The results of Sobol first index are shown in Table 2. Results show comparable influence each input parameter for ND and LND for the elastic model. Thus, for the elastoplastic case, only ND is
RUGC 2021 AJCE, vol. 39 (1)
78 considered for all parameters. Results show low sensitivity of the parameters q and R compared to others, considering a fixed value of pult depending on q (pult =1.5 q) which makes it possible to simplify the analytical expression of the elastoplastic model by neglecting them.
TABLE 2. Sensitivity analysis (Sobol first index) results for the elastic and elastoplastic models.
(∆/∆0) Elastic ND (EI, L, Es) LND (EI, L, Es) (∆/∆0) Elastoplastic ND (R, q, EI, L, Es) EI L Es EI L Es EI L Es R q 0,07% 0,44 0,27 0,29 0,33 0,22 0,33 0,03% 0,38 0,19 0,34 0,00 0,00 0,94% 0,38 0,25 0,30 0,32 0,18 0,37 0,44% 0,41 0,31 0,30 0,04 0,02 1,89% 0,43 0,23 0,28 0,33 0,20 0,37 0,88% 0,41 0,25 0,25 0,02 0,01 4,33% 0,40 0,26 0,32 0,35 0,25 0,35 2,02% 0,47 0,24 0,31 0,08 0,07 20,18% 0,41 0,32 0,33 0,36 0,23 0,33 9,43% 0,43 0,24 0,34 0,05 0,03 37,23% 0,42 0,30 0,35 0,43 0,33 0,44 17,41% 0,41 0,25 0,42 0,08 0,09 54,57% 0,23 0,24 0,42 0,35 0,18 0,28 25,53% 0,28 0,34 0,39 0,09 0,03 94,02% 0,28 0,22 0,53 0,27 0,17 0,53 43,98% 0,14 0,38 0,45 0,10 0,12 IV. CONCLUSIONS
This paper evaluates the influence of SSI parameters probability distribution law on the transmission of ground movements to structures. For low values of transmission rates, results reveal a significant influence for both, elastic and elastoplastic models. On the other hand, a sensitivity analysis is performed according to Sobol method; their results show that, by fixing the value of pult, the terms of q and R can be neglected using the elastoplastic analytical expression.
REFERENCES
C. Alén (1998). Random calculation models exemplified slope stability analysis and ground-superstructure interaction, On Probability in geotechnics. Chalmers University of Technology, 1, 17-29
Bitarafan, M., & Vahdani, R. (2020). Assessing the effect of soil-structure interaction on damage indices of reinforced concrete frames. European Journal of Environmental and Civil Engineering, 24(11), 1693–1708.
Ching, J., Tong, X.W., and Hu, Y.G. (2016). Effective Young’s modulus for a spatially variable elementary soil mass subjected to a simple stress state, Georisk, 10(1), 11-26. (ESCI)
El Kahi, E., Deck, O., Khouri, M., Mehdizadeh, R., & Rahme, P. (2020). Simplified probabilistic evaluation of the variability of soil–structure interaction parameters on the elastic transmission of ground movements. Engineering Structures, 213.
El Kahi, E., Deck, O., Khouri, M., Mehdizadeh, R., & Rahme, P. (2020). A new simplified meta-model to evaluate the transmission of ground movements to structures integrating the elastoplastic soil behavior.
Structures, 23, 324–334.
Franza, A., Ritter, S., & Dejong, M. (2019). Continuum solutions for tunnel-building interaction and a modified framework for deformation prediction. Géotechnique, 2019, 1–15.