HAL Id: hal-02948169
https://hal.inria.fr/hal-02948169
Submitted on 24 Sep 2020
HAL is a multi-disciplinary open access
archive for the deposit and dissemination of
sci-entific research documents, whether they are
pub-lished or not. The documents may come from
teaching and research institutions in France or
abroad, or from public or private research centers.
L’archive ouverte pluridisciplinaire HAL, est
destinée au dépôt et à la diffusion de documents
scientifiques de niveau recherche, publiés ou non,
émanant des établissements d’enseignement et de
recherche français ou étrangers, des laboratoires
publics ou privés.
Arnaud Le Bris, Sébastien Giordano, Clément Mallet
To cite this version:
Arnaud Le Bris, Sébastien Giordano, Clément Mallet. CNN semantic segmentation to retrieve past
land cover out of historical orthoimages and DSM: first experiments. ISPRS Annals of
Photogramme-try, Remote Sensing and Spatial Information Sciences, 2020, V-2-2020, pp 1013 - 1019.
�10.5194/isprs-annals-V-2-2020-1013-2020�. �hal-02948169�
CNN SEMANTIC SEGMENTATION TO RETRIEVE PAST LAND COVER OUT OF
HISTORICAL ORTHOIMAGES AND DSM: FIRST EXPERIMENTS
Arnaud Le Bris∗, S´ebastien Giordano, Cl´ement Mallet
LASTIG, Univ Gustave Eiffel, ENSG, IGN, F-94160 Saint-Mande, France (arnaud.le-bris, sebastien.giordano, clement.mallet)@ign.fr
KEY WORDS: Archival aerial images, Semantic segmentation, CNN, land cover, fusion
ABSTRACT:
Images from archival aerial photogrammetric surveys are a unique and relatively unexplored means to chronicle 3D land-cover changes occurred since the mid 20thcentury. They provide a relatively dense temporal sampling of the territories with a very high spatial resolution. Thus, they offer time series data which can answer a large variety of long-term environmental monitoring studies. Besides, they are generally stereoscopic surveys, making it possible to derive 3D information (Digital Surface Models). In recent years, they have often been digitized, making them more suitable to be considered in automatic analyses processes. Some photogrammetric softwares make it possible to retrieve their geometry (pose and camera calibration) and to generate corresponding DSM and orthophotomosaic. Thus, archival aerial photogrammetric surveys appear as being a powerful remote sensing data source to study land use/cover evolution over the last century. However, several difficulties have to be faced to be able to use them in automatic analysis processes. Indeed, surveys available on a study area can exhibit very different characteristics: survey pattern, focal, spatial resolution, modality (panchromatic, colour, infrared. . . ). Planimetric and altimetric accuracies of derived products strongly depend on these characteristics. Thus, analysis processes have to cope with these uncertainties. Another important gap states in the lack of training data. Deep learning methods and especially Convolutional Neural Networks (CNN) are at present the most efficient semantic segmentation methods as long as a sufficient training dataset is available. However, temporal gaps can be very important between existing available databases and archival data. In this study, two custom variants of simple yet effective U-net - Deconv-Net inspired DL architectures are developed to process ortho-image and DSM based information. They are then trained out of a groundtruth derived out of a recent database to process archival datasets.
1. INTRODUCTION
1.1 Archival photogrammetric campaigns: opportunuit-ies
Archival aerial photogrammetric surveys were initially acquired by mapping, cadastral or military agencies for topographic map generation. Stereoscopic configurations were adopted so as to offer 3D plotting capacities. These surveys have been a com-mon practice in many countries over the last century. Recently, several countries have digitised their film-based photos (e.g., >3 millions images in France), and facilitated their access through spatial data infrastructures and web services with basic metadata and visualisation capacities. These images are a unique yet un-explored means for long-term environmental monitoring and change analysis, as they chronicle Earth surface evolution in a comprehensive way. Their use in remote sensing workflows re-quires a fine georeferencing step so as to generate orthoimages sufficiently registered to be spatially compared across time. Some photogrammetric softwares make it possible to retrieve their geometry (pose and camera calibration) and to generate corres-ponding Digital Surface Models and orthophotomosaics (e.g. (Agisoft, 2016) or (Rupnik et al., 2017)).
Until now, satellite images and archival topographic maps have mostly been used to characterise land-cover dynamics. On the one hand, satellite images, such as Landsat and SPOT sensor families, are compatible with automatic analysis requirements: their radiometry and spatial resolutions are stable over time. For instance, Landsat images have been widely used in order ∗ Corresponding author.
to monitor urban land-cover change (Song et al., 2016). How-ever, the types of changes that can be described are very limited by their low spatial resolution (30-60 m), the length of the time series (30-40 years) and to 2D information (Hermosilla et al., 2015). On the other hand, topographic maps are available in many countries since the 18thcentury, but are difficult to ana-lyse automatically, especially because of varying representation issues. Thus, approaches that characterise land-cover evolution are heavily based on Volunteered Geographic Information (Per-ret et al., 2015) and their temporal resolution is very coarse: the objects that can be extracted (buildings, roads) are difficult to date precisely (Leyk et al., 2006, Herrault et al., 2013). In contrast, archival aerial images are perfectly tailored to char-acterise long-term land-cover changes (Giordano et al., 2017). The time series are (i) long (first images: 1920s), (ii) relatively dense temporally (every 2-5 years), (iii) acquired at very high spatial resolution (<1-2 m) and, (iv) more remarkably, the sur-vey conditions enable to generate 3D information.
1.2 Specificities and difficulties
However, such advantages are accompanied with potential dif-ficulties.
• Very heterogeneous data: Archival airborne campaigns are very heterogeneous. Indeed, surveys available on a same study area can exhibit very different characteristics: survey pattern, focal length, scale, scan parameters, spa-tial resolution (from 10 cm to 2m), modality (panchro-matic, colour, infrared. . . ) or even very different acquis-ition dates corresponding to different seasons (surveys all
over the year) leading to important seasonal changes or very different shadow configurations. Therefore, a classi-fication model learned for one epoch can not be directly applied to another.
• Poor radiometric information: Archival images can ex-hibit several spectral configurations: panchromatic, infrared, natural color images and color infra-red (infra-red, red, green channels). However, they are often composed of a unique panchromatic channel. Thus, their analysis will mostly rely on texture information or on generated DSMs. Besides, the state of conservation of the analog images and digitisation conditions can have caused noisy/blurry ra-diometry, that will affect the quality of generated orthoim-ages and DSMs.
• 2D and 3D geometric imprecision of the orthoimages and DSMs produced with noisy values The image pat-tern of the survey, its spatial resolution, as well as image quality have a strong impact on the level of details con-tained in the different ortho-images and DSMs.
• The lack of relevant semantic reference information (i.e. ground truth ) to train classifiers is another problem. Se-mantic reference information is also needed for informa-tion extracinforma-tion methods (learning). This is all the more true for deep learning methods. For recent images, cur-rent topographic, land cover and forest databases can be used for automatic land cover classification because this reference information is little affected by errors. However, these databases can hardly be used with vintage aerial sur-veys, especially when territories have undergone important evolutions.
To sum it up, archival images are often limited to a panchro-matic band. Thus, using them to perform land cover semantic segmentation requires to rely on their texture information or as-sociated DSM, even though they can be very smooth or noisy depending on image digitisation conditions and the geometric parameters of the survey. Compared to classic machine learning algorithms involving handcrafted features, deep learning (DL) methods have shown a better ability to use texture and context information. Thus they are adapted to semantic segmentation of archival data. However, they require important training dataset. Unfortunately, training reference ground truth data are miss-ing, because of the important temporal gaps between existing available land cover databases and archival data. Besides, due to the above mentioned important heterogenity of archival sur-veys, one single model will not necessarily be sufficient to cope with all surveys along a time series over a same study area.
1.3 Scope of the study
Nevertheless, in spite of these limits, this study aims at us-ing deep learnus-ing semantic segmentation to retrieve past land covers. Two variants of custom simple yet effective Unet -Deconv-Net inspired DL architecture are developed to process ortho-image and DSM. They are then trained out of a groundtruth derived out of a recent database to process archival datasets. More precisely, it is aimed at:
• assessing the robustness of the DL method to (very) noisy and partially false (asynchronous) training data to retrieve basic topographic classes.
• identifying the relevance of DSM information in addition to image information, and the best way to merge then it with image information.
2. SEMANTIC SEGMENTATION METHOD 2.1 Short overview of existing methods
Deep learning approaches and especially Convolutional Neural Networks (CNN) are at present the most efficient semantic seg-mentation methods as long as a sufficient training dataset is available (LeCun et al., 2015). Indeed, compared to more tra-ditional machine learning methods involving handcrafted fea-tures, such methods better cope with texture and context in-formation and show increased generalisation capacities. The most efficient CNN semantic segmentation architectures are fully convolutional encoder-decoder ones (Long et al., 2015). U-net (Ronneberger et al., 2015) is one such architecture. Compared to basic encoder-decoder, it involves skip connections between corresponding encoder and decoder layers to progressively re-introduce high frequency information in the decoder to better delineate objects. (Zhou et al., 2018) proposed a variant named U-net+ involving 1d convolution in the skip connections to keep only the most relevant high frequency information from the en-coder layers. More complex approaches as (Chen et al., 2017) exist but involve heavier architectures.
DL architectures were also proposed for remote sensing data fusion. They generally consist in as many encoders as data source. Most of them were dedicated to image-DSM fusion, e.g. (Audebert et al., 2018, Koppanyi et al., 2019), but Sentinel 2 (S2) time series and VHR image fusion has also been tackled (Benedetti et al., 2018).
Thanks to the availability of several benchmarks (such as IS-PRS Vaihingen and Postdam ones), many DL studies have been devoted to submetric VHR multispectral data (Volpi, Tuia, 2017, Marmanis et al., 2016), in particular when 3D information is also available (Paisitkriangkrai et al., 2016, Audebert et al., 2018). However, as explained earlier, archival images are quite different.
2.2 One input CNN architecture
The first considered model is a standard encoder-decoder CNN, with only one input image. In order to use both orthoimage and DSM information, both modalities will first be concaten-ated into one input tensor image.
For this study, a light yet efficient network is required. Indeed, a light architecture reduces the number of parameters to optimize, and is less training dataset greedy. To lower computing times, a fully convolutional network was preferred to the ones involving fully connected layers as (Gaetano et al., 2018).
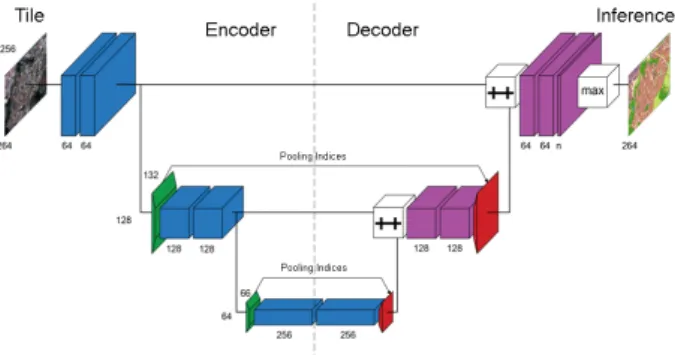
At the end, the U-net like CNN presented in figure 1 was adop-ted. It is slightly different from the original U-net (Ronneberger et al., 2015). First, its depth was reduced to take into account the resolution of the images (especially the one of the DSM here) in respect to the small size of targeted objects, but also to reduce the number of parameters to optimize, to be less sensit-ive to overfitting. Second, to improve spatial information, as in (Noh et al., 2015), transposed convolution is used in the decoder and Max pooling from the encoder transfer their max-indices to homologous Unpooling layers in the decoder.
composed of two block containing a 2D convolution, a Batch Normalization (Ioffe, Szegedy, 2015) and a ReLU activation. Both Max pooling and unpooling operations have a ratio of 2.
Figure 1. Proposed architecture based on Deconv-Net and U-Net. Blue : 3×3 convolution, green : 2×2 max pooling, red : 2×2 unpooling, Violet : 3×3 deconvolution, ++ : concatenation,
max : softmax.
2.3 Two inputs CNN architecture
The previous architecture is adapted to explicitely cope with two input modalities. It is extended to fusion, especially to merge a higher spatial resolution data (e.g. ortho-imagery) with a native lower resolution or at least smoother one (e.g. its cor-responding DSM). It is simply turned into a double entry CNN. The previous encoder branch was simply duplicated. The mer-ging point of these two encoding branches is set before the deepest layer. Skip connections and max pooling indices trans-fer, supposed to enhance spatial information flow are only kept for entry corresponding to high resolution data, as it is the main provider of spatial information. Both sensors are expected to have been resampled at a same GSD for reasons given in 3.2. Keeping the same encoding and decoding operations as in the previous mono sensor CNN also enables to fairly compare them. It can here be noted that this architecture can cope with fusion at different levels (early or late) as inputs can be raw images, classification probabilities or label maps.
Figure 2. Proposed architecture for fusion. Same color legend as figure 1
2.4 Implementation details
The forward operation is fed with image tiles of 264 × 256 pixels, which are normalized given the 2% and 98% quantiles of the radiometric distribution of the whole image. Training and evaluation is done out of a set of couples of images and ground truth tiles at the same size. Training, validation and test sets represent respectively 60%, 20% and 20% of the whole dataset. ”Xavier” initialization (Glorot, Bengio, 2010) and ”Adam” op-timizer (Kingma, Ba, 2014) are used for the learning step. The
latter follows a step decreasing learning rate from 10−2 with γ = 0.7each 50 epochs. The loss function is a weighted cross entropy. It aims at taking into account the strongly heterogen-eous class representation in the dataset. Each weight w[class] is calculated out of its class proportion p[class] as w[class] = 0 when p[class] = 0 or w[class] = 1
p[class]Pn i=1p[i]2
(with n the number of classes) else.
Both networks are implemented in pytorch framework (PyT-orch, 2019).
3. DATASET 3.1 Study area
The study area is located near Pezenas, in Southern France. Covering almost 260 km2, it is a mostly rural area with hills, but it also contains small cities for which urban sprawl has happened in an obvious way. An highway was also construc-ted on this area. Vegetation consists of vines, crops, moors and forests.
3.2 Archival aerial surveys
Archival surveys corresponding to 2 epochs (2001 and 1981) will be considered. For each of them, orthoimage and DSM were generated. Orthoimages native resolution is around 30 cm, while DSMs are computed for a 1.2 m GSD. In further experiments, orthoimages were downsampled at the DSM GSD to reduce computing times and to be less sensitive to image digitisation noise.
Height information from the DSM is intended to be used in the classification process. However, such information can take different forms:
• Raw DSM
• Normalized DSM, resulting from the difference between the raw DSM and a Digital Terrain Model (DTM). (Here, the DTM is extracted from the present national reference altimetric database.)
• Relief shading maps derived out of the raw DSM. Initially devoted to the visualization of the DSM, such maps are here computed at pixel level as a combination of the sky viewing factor and the shadow mask generated by a fict-ive Sun. Such shading map makes it possible for a human to better understand the 3D scene than the raw DSM. Be-sides, it is also generally less sensitive to clutter areas and compensates some height estimation errors. Thus, it is in-teresting to test whether the CNN can also ”understand” this map.
These different variants of 3D information can be seen on figure 3 will be tested in the two CNN architectures.
3.3 Training and validation land cover data
Training data are extracted from the current version of the na-tional reference topographic, agricultural and forest databases, last updated in 2018.
Considered classification nomenclature will involve 5 classes corresponding to basic topographic elements :
Figure 3. 1981 epoch : ortho-image and different height information representations (raw DSM, normalized DSM and
shading map). •
•
Water ••
Crops ••
Roads ••
Vegetation ••
BuildingsAn artificial
•
”around building buffer” class is added to help to enhance building delineation. Indeed, building surroundings are generally not described in the previous databases. This addi-tional class introduces constraints in such area preventing build-ing overdetection over their direct unlabelled neighbourhood. A 5m radius was used to create this buffer from the building ob-jects of the database.As one important phenomenon related to long term land cover evolution concerns urban sprawl, the present quantitative ana-lysis focuses on building and road detection. Besides, being able to retrieve construction dates of building objects present in topographic database is valuable to retrieve a fine history of the evolution of territories. That’s why the building and road databases were manually cleaned (reverse updating) for each epoch to be coherent with corresponding archival images. These cleaned datasets were mostly used to assess the quality of the obtained classification results. It can be seen from table 1 and figure 6 that the test area has undergone important changes in building layer.
epoch number of evolution building objects to current DB 2018 54502 / 2001 48605 -10.8% 1981 40786 -25.2%
Table 1. Statistics about the evolution of the building objects in the DB
4. EXPERIMENTS AND RESULTS 4.1 Presentation of experiments
To sum previous discussions, proposed experiments aim at
• assessing whether it is possible to train CNN models for historical epochs out of recent (but very asynchronous w.r.t. image epochs) ground truth.
• identifying the best way to use DSM information and im-age information.
As a consequence, for each epoch, different configurations were tested. They are denoted as Method:im+mod, where Method is the used CNN architecture (”UNet” for the mono input one, ”FuseNet” for the two inputs one), im is the ortho-image and mod is the used height information modality (”dsm” for raw DSM, ”sh” for the shading map). ”UNet:im” means that only the ortho-image is used by the CNN.
By default, classifiers are trained using a ground truth map gen-erated from the recent (but not coherent to historical image). When a configuration is trained out of the cleaned versions of the database, it is named Method:im+mod:clean.
4.2 Evaluation method
Obtained results are visually assessed for all classes. They also undergo quantitative (pixel based) evaluation out of cleaned databases but only for buildings and roads.
Generic quality metrics are considered, with global measures -Overall Accuracy (OA), mean FScore over all classes (mIoU), mean Intersection over Union over all classes (mIoU) - as well as per class FScores.
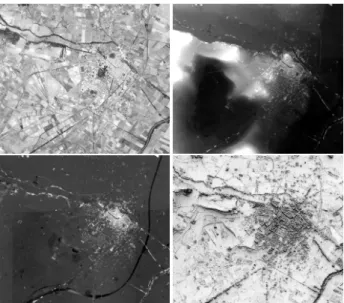
Figure 4. Top row from left to right: 1981 and 2001 images. Bottom row: ground truth generated out of current DBs
4.3 Results
Obtained results for both epochs can be seen in figures and in tables 3 and 2.
From a visual analysis, the classification object delineation is quite coarse, explaining some low scores, but, for instance, build-ing objects are generally correctly retrieved (few overdetection cases far from true building position). Roads and building buf-fers tend to be misclassified in (very) dense urban centres.
Applying the FuseNet CNN to orthoimage and shading map derived out the DSM led to the better results for building detec-tion. This can be explained by the fact such 3D representation is less sensitive to height estimation errors. Good results are also obtained using the mono-input UNet CNN to the tensor result-ing from the concatenation between image and shadresult-ing map. The method is quite robust to errors in the ground truth. When training out of cleaned ground truth map, results are better, but the difference is not so important. This can be both assessed visually and quantitatively.
5. CONCLUSION AND PERSPECTIVES This study aimed at testing CNN method in this difficult his-torical survey context. Even though obviously more difficult situations exist, these very first classification results are quite encouraging, as the model is quite robust to training errors. Besides, interdate DSM comparison and iterative classification process can help to automatically clean the training databases. Another interesting output of this study concerns the possible use of shading maps to represent height information.
Present classification is quite smooth. A way to alleviate this problem could consist in introducing 1d convolution in skip connections as in (Zhou et al., 2018). Besides, the considered CNN should probably be deeper to extend its receptive field and consider wider context (especially when using VHR images at native resolution instead of the one of the DSM). Dependence on training data could also be reduced exploiting multi-loss strategies, where one loss is dedicated to classification, and the other to generate one modality from the other one taken as in-put. Another observation was that validation and test tiles were generally better classified than training ones when using not time coherent training data. Thus co-training strategies could be envisaged to improve the model. At the end, transfer learn-ing should also be considered. Recent methods involvlearn-ing Gen-erative Adversarial strategies have already been proposed, e.g. (Fang et al., 2019).
FScore OA mFSc mIoU build. road UNet:im 95.9 71.7 59.9 66.7 50.5 UNet:im+dsm 96.3 71.1 59.3 64.8 50.4 UNet:im+sh 96.3 72.7 61.2 69.8 50.3 FuseNet:im+dsm 96.5 71.3 59.5 65.1 50.7 Fusenet:im+sh 95.8 72.2 60.9 72.1 46.8 FuseNet:im+sh:clean 96.2 74.0 62.4 71.3 52.5 Table 2. Quality metrics (in %) Results obtained for 2001 epoch
FScore OA mFSc mIoU build. road UNet:im 97.0 72.7 61.0 67.2 52.3 UNet:im+dsm 96.4 70.0 58.3 63.6 48.3 UNet:im+sh 96.9 72.9 61.4 69.5 50.7 FuseNet:im+dsm 96.2 69.0 57.4 63.0 46.1 FuseNet:im+sh 96.9 73.0 61.6 70.7 50.0 FuseNet:im+sh:clean 96.9 74.7 63.4 73.1 52.6
Table 3. Quality metrics (in %) obtained for 1981 epoch
ACKNOWLEDGEMENTS
This work was supported by the French National Research Agency under the grant ANR-18-CE23-0025.
REFERENCES
Agisoft, 2016. Agisoft photoscan. http://www.agisoft.com/. Accessed on September 5, 2016.
Audebert, N., Le Saux, B., Lef`evre, S., 2018. Beyond RGB: Very high resolution urban remote sensing with mul-timodal deep networks. ISPRS Journal of Photogrammetry and Remote Sensing, 140, 20–32.
Benedetti, P., Ienco, D., Gaetano, R., Ose, K., Pensa, R. G., Dupuy, S., 2018. M3Fusion: A Deep Learn-ing Architecture for Multi-{Scale/Modal/Temporal} satellite data fusion. CoRR, abs/1803.01945. http://arxiv.org/abs/1803.01945.
Chen, L.-C., Papandreou, G., Schroff, F., Adam, H., 2017. Rethinking atrous convolution for semantic image seg-mentation. arXiv preprint arXiv:1706.05587.
Fang, B., Kou, R., Pan, L., Chen, P., 2019. Category-Sensitive Domain Adaptation for Land Cover Mapping in Aerial Scenes. Remote Sensing, 11, 2631.
Gaetano, R., Ienco, D., Ose, K., Cresson, R., 2018. A Two-Branch CNN Architecture for Land Cover Classification of PAN and MS Imagery. Remote Sensing, 10(11), 1746. https://hal.archives-ouvertes.fr/hal-01931435.
Giordano, S., Le Bris, A., Mallet, C., 2017. Fully auto-matic analysis of archival aerial images current status and challenges. Joint Urban Remote Sensing Event (JURSE). Glorot, X., Bengio, Y., 2010. Understanding the difficulty of training deep feedforward neural networks. Proceedings of the thirteenth international conference on artificial in-telligence and statistics, 249–256.
Hermosilla, T., Wulder, M., White, J., Coops, N., Hobart, G., 2015. Regional detection, characterization, and attri-bution of annual forest change from 1984 to 2012 us-ing Landsat-derived time-series metrics. Remote Sensus-ing of Environment, 170, 121-132.
Herrault, P.-A., Sheeren, D., Fauvel, M., Paegelow, M., 2013. Automatic Extraction of Forests from Historical Maps Based on Unsupervised Classification in the CIELab Color Space. Springer International Publishing, 95–112. Ioffe, S., Szegedy, C., 2015. Batch Normalization: Accelerating Deep Network Training by Reducing Internal Covariate Shift. CoRR, abs/1502.03167. http://arxiv.org/abs/1502.03167.
Kingma, D. P., Ba, J., 2014. Adam: A method for stochastic optimization. arXiv preprint arXiv:1412.6980. Koppanyi, Z., Iwaszczuk, D., Zha, B., Saul, C. J., Toth, C. K., Yilmaz, A., 2019. Multimodal Scene Understanding - Algorithms, Applications and Deep Learning. Elsevier, chapter Multi-Modal Semantic Segmentation: Fusion of RGB and Depth Data in Convolutional Neural Networks. LeCun, Y., Bengio, Y., Hinton, G., 2015. Deep learning. nature, 521(7553), 436–444.
Leyk, S., Boesch, R., Weibel, R., 2006. Saliency and se-mantic processing: Extracting forest cover from historical topographic maps. Pattern Recognition, 39(5), 953 - 968. Long, J., Shelhamer, E., Darrell, T., 2015. Fully convolu-tional networks for semantic segmentation. CVPR.
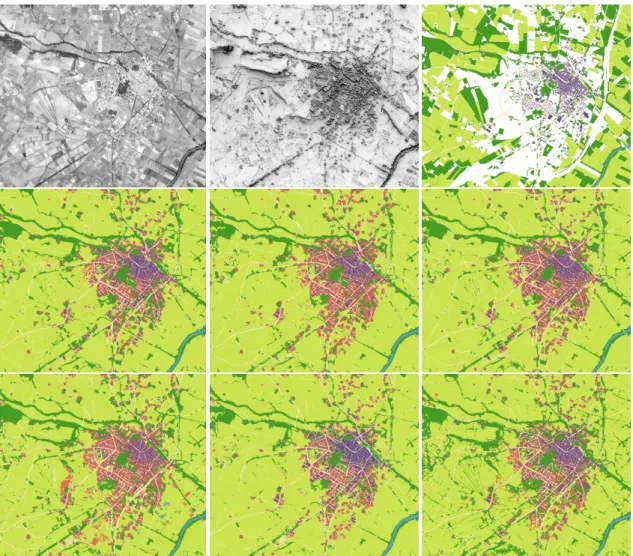
Figure 5. 1981: (from left to right) top row: ortho-image, shading map, cleaned ground truth; middle row: UNet:im, UNet:im+dsm, UNet:im+sh; bottom row: FuseNet:im+dsm, FuseNet:im+sh, FuseNet:im+sh:clean
Marmanis, D., Wegner, J., Galliani, S., Schindler, K., Datcu, M., Stilla, U., 2016. Semantic segmentation of aer-ial images with an ensemble of fully convolutional neural networks. ISPRS An. of Phot., Rem. Sens. and Spat. Inf. Sc., III-3.
Noh, H., Hong, S., Han, B., 2015. Learning Decon-volution Network for Semantic Segmentation. CoRR, abs/1505.04366. http://arxiv.org/abs/1505.04366.
Paisitkriangkrai, S., Sherrah, J., Janney, P., Van Den Hen-gel, A., 2016. Semantic labeling of aerial and satellite im-agery. IEEE JSTARS, 9(7).
Perret, J., Gribaudi, M., Barthelemy, M., 2015. Roads and cities of 18th century France. Nature Scientific data, 2. PyTorch, 2019. Pytorch site.
Ronneberger, O., Fischer, P., Brox, T., 2015. U-Net: Con-volutional Networks for Biomedical Image Segmentation. CoRR, abs/1505.04597. http://arxiv.org/abs/1505.04597. Rupnik, E., Daakir, M., Pierrot Deseilligny, M., 2017. MicMac – a free, open-source solution for photogram-metry. Open geospatial data, software and standards, 2(14). https://doi.org/10.1186/s40965-017-0027-2. Song, X.-P., Sexton, J., Huang, C., Channan, S., Town-shend, J., 2016. Characterizing the magnitude, timing and
duration of urban growth from time series of Landsat-based estimates of impervious cover. Remote Sensing of Environment, 175, 1-13.
Volpi, M., Tuia, D., 2017. Dense semantic labeling of sub-decimeter resolution images with convolutional neural net-works. IEEE TGRS, 55(2).
Zhou, Z., Siddiquee, M., Tajbakhsh, N., Liang, J., 2018. Unet++: A nested u-net architecture for medical image segmentation. Deep Learning in Medical Image Analysis and Multimodal Learning for Clinical Decision Support, Springer, 3–11.
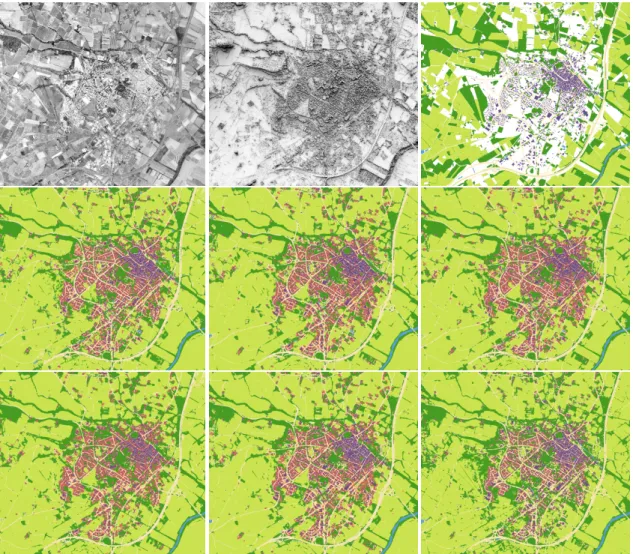
Figure 6. 2001: (from left to right) top row: ortho-image, shading map, cleaned ground truth; middle row: UNet:im, UNet:im+dsm, UNet:im+sh; bottom row: FuseNet:im+dsm, FuseNet:im+sh, FuseNet:im+sh:clean