HAL Id: hal-00876250
https://hal.archives-ouvertes.fr/hal-00876250
Submitted on 24 Oct 2013
HAL is a multi-disciplinary open access archive for the deposit and dissemination of sci-entific research documents, whether they are pub-lished or not. The documents may come from teaching and research institutions in France or abroad, or from public or private research centers.
L’archive ouverte pluridisciplinaire HAL, est destinée au dépôt et à la diffusion de documents scientifiques de niveau recherche, publiés ou non, émanant des établissements d’enseignement et de recherche français ou étrangers, des laboratoires publics ou privés.
P. Namour, P. Le Pimpec
To cite this version:
P. Namour, P. Le Pimpec. Simulation of hyporheic self -purification in rivers: the assimilative capacity of proteins. Water Science and Technology, IWA Publishing, 2001, 43 (5), p. 231 - p. 238. �hal-00876250�
Simulation of hyporheic self-purification in rivers : the
assimilative capacity of proteins
Ph. NAMOUR AND P LEPIMPEC
Cemagref, 3bis quai Chauveau, 69336 Lyon cedex 09, France
ABSTRACT
For the biochemical study of assimilation capacity (AC), 2 hypotheses were put forward (3 levels of response, the hyporheon being the main site of self-purification). A physical model was designed, simulating the hyporheon and its response to increasing inputs of proteins was studied. The analyses evidence: a low accumulation of proteins in the hyporheic biofilms for daily flows ranging from 0.1 to 20 mg/day; the percolation of proteins stimulates the proteolytic activity (increase in Vm) whereas the Km shows no significant change ; the assimilation capacities thus stimulated are vastly superior to the daily loads introduced into the system and explain the low accumulation of proteins; finally, this stimulation concerns only a shallow active zone < 2 cm. For the future, a method of localising zones of hyporheic infiltrations (micro-piezometry, tracing, etc.) should be developed to monitor in situ the action of inputs of organic matter (OM) to the estimate the AC of the waterway..
KEY WORDS
Proteins, assimilation capacity, enzymatic kinetics, hyporheon.
HYPOTHESES
The major organic disturbance in a river is caused by the disposal of household or urban waste (van Dijk et al., 1994). Rivers do, however, have a purification capacity enabling them to assimilate organic matter (OM)(Fontvieille, 1987). To obtain criteria for the assessment of the assimilation capacity (AC), we put forward two hypotheses: 1) a river responds to increasing inputs of OM in 3 phases (Figure 1) :
Figure 1 : hypothetical evolution of the systemic cost under an increasing input of OM. 1st) a phase of homeostasis with adjustments and without functional modifications : a phase of resistance (Webster et al., 1983) or of fluctuation (Blandin & Lamotte, 1985) ; 2sd) a phase of resilience sensu Webster et al.(1983) where the system is reorganised to counter the noxious effects of the inputs of OM : capacity of stabilisation (Blandin & Lamotte, 1985) ; 3th) finally, a change of state where the primary stabilisation system is destroyed ; 2) the zones with the highest assimilation are those where the immobilisation of OM is the greatest. Rivers develop underflows within the sediments (a hyporheic zone or hyporheon) acting as a filter for the OM la MO (Figure 2).
Figure 2 : conceptual model of a pool-riffle-pool sequence showing relationships of channel water, hyporheon and groundwater, according to White (1993). Arrows within the hyporheon represent theoretical underflow paths.
It is therefore within this filtering structure (sediments with high permeability) that areas of high heterotrophic capacity are to be found (Gibert, 1990). The hyporheic biofilms must therefore be the most effective self-purifiers in a waterway. To validate these working hypotheses, an experimental system was designed with 9 columns, simulating the hyporheic working. The objective is to evidence descriptors and quantifiers of the AC of a river. The preliminary analysis of 13 inputs from wastewater treatment stations and of their influent having evidenced the preponderance of the protein fraction (25 to 30% of the oxidizable OM), the study turned to examining the variation in the proteolytic activity developed by the biofilms in response to increasing inputs of proteins. The experiments were conducted on 2 substats : 1) glass beads to hypothesis validation and 2) coarse sediment for verification on natural sediment.
MATERIALS & METHODS
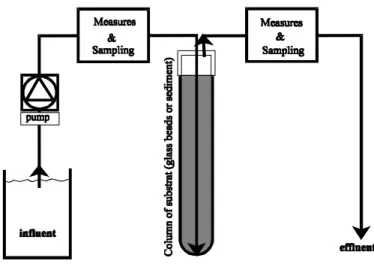
Physical modelThe hyporheon (Figure 3) is stimulated by a system of 9 glass columns (l=20 cm & ∅int.=22 mm).
Figure 3 : experimental model of the hyporheon.
The ends are capped with a silicone stopper (∅= 20 mm×12 mm) pierced with two Teflon catheters (∅=1.6 mm). The catheters are connected to the hoses of the pump feeding the 9 columns at a constant flow rate of ≈0.6mL/min., of influent filtered at 0.45 µm, according to the diagram in Figure 3. The columns are placed in a dark room at 20°C. In an initial, so-called colonisation phase, all the columns are fed for one month with water filtered over a glass fibre membrane (NF EN 872). The experimentation phase proper then follows : the columns are fed
with water doped with proteins for 15 days. At the end of the experimentation, the columns are cut into sections 2 cm long, and their proteolytic activity and organic composition measured.
Origin and characteristics of the substrata
1) The glass beads (∅=1 mm) are washed in a boiling sulfochromic mixture for 2 h and then rinsed in water, washed with the detergent RBS-35 (Pierce Chemical) for 1 h at 50°C and rinsed in Milli-Q water.
2) The sediment comes from the Chaudanne, a stream of the order 1 to the west of Lyon, a tributary of the Yzeron, which is in turn a tributary of the Saône. It drains a peri-urban catchment area of 283 hectares (700 acres), of an alterated granite and gneiss type, with predominantly sandy grits (500µm<46%<2mm, 200µm<39%<500µm, 50µm<7%<200µm, 8%<50µm). The samples are the mean of five samples taken using a metal grid, 10×10cm (100 cm2). Only the first two centimetres of sediment are taken, i.e. a volume of 200 cm3. The sediment is sieved at 2 mm and its <200 µm fraction removed using water from the Chaudanne. The sedimentary fraction obtained (2 mm>∅>200 µm) is stored in a polyethylene bottle at 4°C until reaching the laboratory (<1 h) where it is poured into the columns.
Synthetic influents
The influents consist of water from the Chaudanne, doped with known quantities of BSA. The water was collected in March 1998 (glass beads) and January 1999 (sediment), upstream of the stormwater spillway of the Barge bridge at Crézieu-la-Varrenne. The water was filtered at 0.45 µm and kept in the refrigerator at 5°C throughout the period of experimentation. A quantity of 2 L of influent was prepared each day to be added to the columns.
Analyses
The proteins were extracted by enzymatic attack (Mayer et al. (1995). Approximately 100 mg of ground sample were placed in 1.5 mL Eppendorf tubes, cleaned with RBS-35 (Pierce Chemical) for 1 h at 55°C and rinsed in Milli-Q water. A quantity of 1 mL of phosphate buffer (0.1 M, pH 8) poisoned with arseniate (0.1 M) and pentachlorophenate (1 mM), was added. After 1 h at 5°C, 100 µL of proteinase K (1 mg/mL in buffer) (Sigma P-8044) were added, and the tubes were incubated for 6 h at 60°C. Proteolysis was halted with 100 µL of TCA 100% (m/v). After 30 min. at 5°C, the tubes were centrifuged at 3000g/20min. The primary amines were quantified in the supernatant by fluorimetry (Udenfriend et al., 1972) : 1 mL of borate buffer (25 mM, pH 9.3) and 100 µL of fluorescamine (200 µL/mL) in acetone for spectrophotometry, were added to the 100 µL of supernatant. Fluorescence was measured at 487/390nm using a Jobin Yvon JY3D fluorimeter, calibrated with DL-Leucine. The acid hydrolysis (HCl 6 N, 24 h at 110°C) confirmed the absence of peptides in the incubates and even resulted, in the highly organic samples, in a decrease in the amine contents, probably by destruction or by condensation reactions
The proteolysis was modelled using the equation of Michaelis & Menten. This equation requires negligible or zero microbial growth. To prevent any growth, or assimilation, during incubation, the medium was poisoned with oxidative phosphorylation decoupling agents 1 h prior to the addition of the BSA. Approximately 10 to 100 mg of the sample were subjected to ultrasound (1 min at maximum power) in a 0.1 M phosphate buffer at pH 8 (arseniate 0.1 M + pentachlorophenate 1 mM). After a contact time of 1 h at 5°C, the samples were incubated in the presence of increasing concentrations of BSA (from 0 to 1.55 mM) for 45 min. at 55°C. The reaction was halted by the addition of 100 µL of TCA 100% (m/v), and the primary amines quantified as previously. The kinetic constants were calculated by optimisation of the Michaelis & Menten equations by non linear regression and minimisation of the sum of the square of differences between the experimental and theoretic values. All the analyses were performed in triplicate and the concentrations expressed for 1 g of beads or of dry sediments
RESULTS
The decrease in the flow rate, from its initial value of 0.50 mL/min, is small during the experiment. The interstitial velocity is 4.3 mm/min (25.8 cm/h), a plausible velocity in the natural environment. Hendricks & White (1995) measured a velocity of 46.8 cm/h in the hyporheon of the Maple river Maple (Michigan) and Findlay & Sobczak (1996), under Wappinger Creek (New York), measured velocities of between 3 and 13 cm/h.
For each column, the protein concentration is monitored before and after passage. As from the first day, the doped columns evidence a decrease of nearly 50%, probably due to an abiotic fixing of the BSA. The content subsequently falls regularly to reach a plateau on the 6th day. The period of the experiment was set as two weeks. On the one hand, that enables the installation of the heterotrophic film, and, on the other hand, this is the plausible period during which a sediment in situ is not re-suspended by a flood.
0,0 1,0 2,0 3,0 4,0 5,0 0 - 2 2 - 4 4 - 6 6 - 8 8 - 10 10 - 12 12 - 14 14 - 16 16 - 17,3
Depth of analysed layer (cm)
P ro te o ly ti c a ct iv it y (µ m o l/ g /h )
Figure 4 : distribution of proteolytic activity according to the depth of analysed layer.
As shown in Figure 4, the activity induced by the inputs of BSA are practically limited to the first two centimetres of the column. Subsequently, the activity falls off rapidly. The second section represents no more than 15% of the activity of the first. Consequently, only the deepest stratum of the columns, reached by the influent, will be analysed.
Table 1 shows the concentrations in organic nitrogen, the protein and the amino acid contents of the biofilms. The sediments reveal contents which are systematically higher than those of the glass beads. Moreover, these concentrations are lower by more than one order of magnitude with the daily input (0.43 to 1.23 mgN/L). There is no accumulation of proteins on the substratum, implying an intense proteolytic activity.
Table 1 : composition and kinetic constants measured in columns with increasing flow of proteins. Two substrata tested: glass beads and sediment. A C = assimilative capacity.
Influent Biofilm composition Kinetic constants Column substratum Flow of proteins mg/d Reduction mg/d Proteins µgN/g Amino acids µgN/g Norg µgN/g Nprot/Norg % Km µM Vm µ mol/g/h A C mg/d Spiralling length cm glass 2.67 0.37 8.3 3.3 80 10.4 120 0.7 2.7 2.0 ″ 3.65 1.37 7.6 4.0 21 36.2 330 2.1 5.9 1.2 ″ 5.24 2.24 10.4 4.8 37 28.1 154 7.7 15.3 0.7 sediments 3.58 0.91 24.8 3.4 204 13.8 42 1.5 4.6 1.7 ″ 5.95 3.93 30.5 8.8 274 14.4 48 4.2 9.9 1.2 ″ 7.65 5.03 34.3 10.0 267 16.6 78 6.7 13.8 1.1
The proteic nitrogen of the biofilms represents no more than 10 to 36% of the organic nitrogen. It should also be noted that the amino nitrogen contents account for up to one third of the total proteic nitrogen. By using the Arrhenius equation, it possible, taking the Vm measured, to
calculate the BSA metabolised in the first two centimetres of the columns at 20°C (Table 1). The AC is the speed for a saturating protein concentration. The drop represents the mean quantity of proteins eliminated, calculated by the difference between the influent and the effluent. The recycling depth is calculated, considering the section of column to be homogenous, with 5.75 g/cm in glass beads or 4.83 g/cm in sediments. The spiralling length is equal to the flow divided by the proteolytic activity at 20°C.
DISCUSSION
This high polarisation of the proteolytic gradient confirms the importance of the interface zones (ecotones) in the transfer of matter and energy between system. The remarkable narrowness of the hyporheic ecotones has already been reported by Romaní et al. (1998) who measured, in the Riera Major (Spain) β-glucosidic, β-xylosidic and respiratory activities than twice as high in the top sedimentary layer (0 to -1 cm) than in the deeper layer (-7 to -10 cm). This resulted in the abandonment of random or systematic sampling strategies in favour of a controlled strategy. In addition, the importance of the ecotone in OM dynamics requires precise delineation in the river of the zones of infiltration and of exfiltration. This requires a sound knowledge of the hydraulics within the sediment studied (micro-piezometric methods, tracings).
Kinetic constants
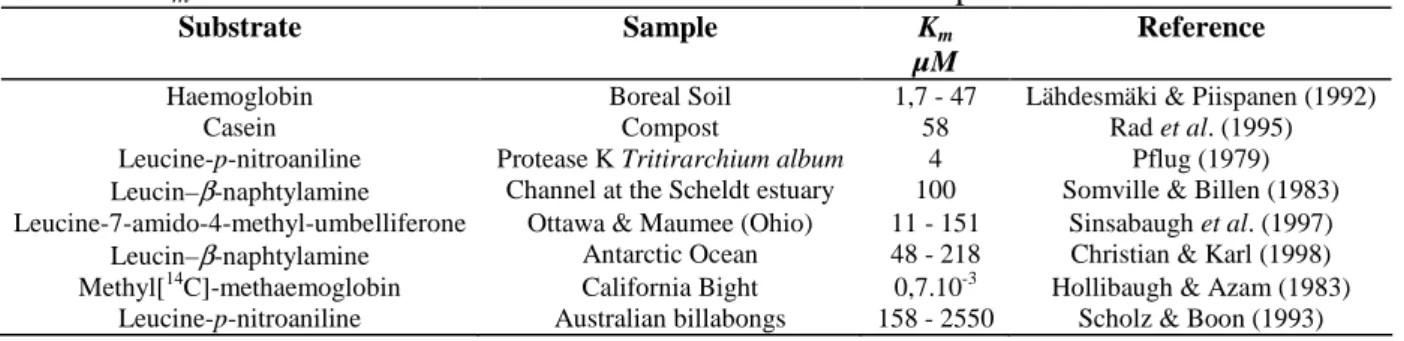
The comparison of our Km, with those published for other proteins or mono-amine synthetic
substrates (Table 2), evidence the good match of our values.
Table 2 : Km found in the literature for various substrates and samples
Substrate Sample Km
µM
Reference
Haemoglobin Boreal Soil 1,7 - 47 Lähdesmäki & Piispanen (1992)
Casein Compost 58 Rad et al. (1995)
Leucine-p-nitroaniline Protease K Tritirarchium album 4 Pflug (1979)
Leucin–β-naphtylamine Channel at the Scheldt estuary 100 Somville & Billen (1983) Leucine-7-amido-4-methyl-umbelliferone Ottawa & Maumee (Ohio) 11 - 151 Sinsabaugh et al. (1997) Leucin–β-naphtylamine Antarctic Ocean 48 - 218 Christian & Karl (1998) Methyl[14C]-methaemoglobin California Bight 0,7.10-3 Hollibaugh & Azam (1983)
Leucine-p-nitroaniline Australian billabongs 158 - 2550 Scholz & Boon (1993)
There would not appear to be any mobilisation of enzymes of different affinity according to the quantity of available substrate. The values of the columns of glass beads (Km = 120 and 154 µM)
and of sediment (Km = 48-78 µM) are supported by the bibliography. Only the value measured in
seawater by Hollibaugh & Azam (1983) is much lower : 0,7 nM. On the other hand, there are few publications reporting values for Km > 300 µM. Only Scholz & Boon (1993) calculated Km
values of 158 and 2550 µM, i.e. 0,64 g/L (L-leucine-p-nitro-aniline) in epixylons of Australian billabongs.
This relatively high Km value poses the problem of the analytical validity of certain
quantification protocols using substrate concentrations from 100 to 200 µM, i.e. concentrations more or less equal to the Km values. We are far from saturating concentrations. For a Km of
100 µM, and for a substrate concentration of 100-200 µM, we are at only 50-67% of the Vm !
Moreover, these relatively high Km values (BSA at 100 µM=6.45g/L) are barely physiological
given the low protein concentrations measure in the water (in the order of one mg/L). What is the explanation for the synthesis by organisms of a enzyme operating at only a low capacity of its possibilities in natural conditions ? From an energy viewpoint, that does not appear optimal.
Among the possible explanations : a) a barrier effect due to the presence of the sedimentary biofilm. From the work of Boczar et al. (1992) on activated sludge, and of Confer & Logan (1998) on wastewater, and of Hoillibaugh and Azam (1983) on seawater, it would appear that the proteases are in fact bound to the cellular walls and that consequently the proteins have to diffuse in the biofilm before reaching them. Albumin access (64 500 amu, ∅ 15 nm) would thus appear to be limited by its diffusion within the biofilm. The actual concentrations would appear to be lower than those calculated theoretically in the incubation medium. This vision of a compact biofilm, of the buttered bread type is currently abandoned in favour of a looser, filamentous type representation into which the macromolecules can easily penetrate (van Loosdrecht et al, 1995 ; Wimpenny & Colasanti, 1997). Moreover, our kinetics are driven on an extract of disintegrated biofilm, and this explanation is not therefore suitable ; b) adaptation of the proteases to a specific micro-environment : the biofilm, given its retention and storage capacity, would appear to be capable of concentrating the proteins at contents compatibles with the Km values measured ; c)
adsorption of the BSA on the particulate phase, which would decrease the concentration actually available for proteolysis. McLoughlin & Crombie-Quilty (1983) measured a BSA adsorption rate (1000 mg/L) of 25% in activated sludge, and Hollibaugh & Azam (1983) a rate of 25 to 40% for 1 mg/L concentrations of methyl-methemoglobine in the analysis of seawater. The effect of taking account of the actual concentration would be to shift the Km values to lower values. It has
been seen, however, that there is no accumulation of proteins on the substratum ; d) a selective advantage, such as a better stability of the enzyme, or a regulation of proteolysis by the substrate, thanks to kinetics of the first order over a wide range of concentrations. This has to effect of regulating the velocity in a linear fashion according to the protein concentration. These high Km
values (≈0.1 mM), in relation to the concentrations present in the medium (≈0.1 µM) give the system a high response dynamic : the velocities are of the first order (v≈k.[S]) because the
quantity Km+[S]≈Km. This property of the equation of Michaelis & Menten provides the system
with good resistance to the variations in the protein inputs. This final explanation appear to be the most plausible.
Bearing in mind the reservation expressed on the protocols for the measurement of the enzymatic activities (saturation conditions not met : [S] equal to or even less than Km), an attempt can be
made to compare our results with the proteolytic activities already published. Even our control columns evidence a marked proteolytic activity (0.7 to 7.7 µmol/g/h or 225 to 2554 µmol/cm2/h). Sinsabaugh & Linkins (1988) measured lower exoprotein activities in extracts of epilithons from the Saint Regis river (New-York) ranging from 0.1 to 3.00 nmol/cm2/h. Mayer (1989) reported exoproteolytic activities in estuary sediments (Damariscotta) ranging from 0 to 72 nmol/g/h. Whilst Jones & Lock (1989) failed to detect any "endopeptidase" activity on intact biofilms (glass beads ∅ 1.5 mm) from the oligotrophic Nant Wean river, in the Clywedog, on the other hand, an eutrophic river, activities reached 100 nmol/cm2/h for the highest values. Chappell & Goulder (1994) measured leucine-aminopeptidase activities from 143 to 170 nmol/cm2/h in the biofilms from Weighton Beck, collected respectively 200 m upstream 500 m downstream from the outfalls of Market Weighton (England). Only the activities in the undoped glass bead columns (225 nmol/cm2/h) gave levels of proteolytic activity matching these data. All our other values are high by more than one order of magnitude. Nevertheless, it should be remembered that our columns are subject to protein flow rates ranging from 2.67 to 7.65 mg/day. Moreover, our quantification method takes account of the totality of the proteolytic activities (endo- and exopeptidases, amino- and carboxypeptidases). Our high values can thus be explained by the presence of several forms of proteases, whereas the data in the literature concern only one type of activity, generally the aminopeptidase activity. These high values are therefore perhaps merely the reflection of reality.
Assimilation capacity
The AC of the first section of our columns is generally vastly superior to the daily loads in proteins. Despite that, the drops in the protein load never reach 100%. It would appear that there
is little assimilation of proteins (65% in the best case) during their passage in the columns, whereas the activities would enable it. There appear to be two superimposed phenomena : an intense assimilation as evidenced by the activities measured, and a release. Fiebig (1997) also found the same phenomenon : 99% of the amino acids (labelled with 13C) were immobilised in the first 1.5 cm of sediment, whereas the amino reduction was practically nil at the outlet from the column. Under such conditions, the spiralling length of the proteins (sensu Newbold et al., 1982) is less than or equal to 2 cm of column (resolution thickness of our system). It would thus appear that the flows of assimilated proteins are higher than one may suspect from the simple difference between the ingoing and outcoming quantities. This reinforces our opinion on the necessity of measuring flows and not simply measuring concentrations, if self-purification is to be properly understood.
Figure 5 shows the distribution of the proteolytic activities measured according to the influent protein load. The solid line curve models the linear response (r2=0.67) and the dotted line according to the logistic law (r2=0.79).
0 1 2 3 4 5 6 7 8 9 0 2 4 6 8 10
daily flux of proteins (mg/day)
V m ( µ m o l/ g /h )
Figure 5 : Vm variations versus daily flow of proteins, + glass beads, 1 sediment.
The proteolytic activity is essentially inductive. The regulation logistic model is very similar to that proposed in the hypothesis. Namely, an initial phase where the protein load has relatively little effect, followed by a phase of linear growth where the speed of hydrolysis is proportional to the protein load, and finally the phase of the order 0, where the Vm no longer increases and is
relatively insensitive to variations in the protein load, does not appear to be reached in our experiments.
CONCLUSION
Enzymatic essay is a powerful tool for studying OM cycling in river. These experiments on columns evidence the extremely limited local effect (<2 cm) of the input of proteins on the proteolytic activity, implying the abandonment of random or systematic strategies in favour of a controlled sampling of the coarse sediments, having circumscribed the contact areas between inputs and sediment. Hence the necessity of validating tools for the exploration and delineation of these areas.
The presence of proteins results in an increase of the Vm, whilst, if the Km appear little affected,
the nature of the substrate has a predominant influence.
We have identified two levels of regulation of the proteolytic activity according to protein input : a) a resistance phase, corresponding to the basal assimilation, modelled by the Michaelis & Menten equation; b) a resilience phase during which the system adjusts to larger flows of OM by a modulation of the Vm according to a logistic law. The AC is not therefore a constant of the
medium but evolves under the influence of organic inputs. A river adjusts its metabolism to the pollutant load.
REFERENCES
Blandin, P., Lamotte, M. (1985) Ecologie des systèmes et aménagement: fondement théoriques et principe
méthodologiques, in Fondements rationnels de l’aménagement d’un territoire, Ed Lamotte., Masson Paris, 139-162.
Boczar, B.A., Begley, W.M., Larson, R.J. (1992) Characterization of enzyme activity in activated sludge using
rapid analyses for specific hydrolases, Water Environment Research, 64, 792-797.
Chapell, K.R., Goulder, R. (1994) Enzymes as river pollutants and the response of native epilithic extracellular
enzyme activity, Environmental pollution, 86, 161-169.
Christian, J.R., Karl, D.M., (1998) Ectoaminopeptidase specificity and regulation in Antarctic marine pelagic
microbial communities, Aquatic Microbial Ecology, 15, 303-310.
Confer, D.R., Logan, B.E. (1998) Location of protein and polysaccharide hydrolytic activity in suspended and
biofilm wastewater cultures, Water Research, 32, 31-38.
van Dijk, G.M., van Liere, L., Admiraal, W., Bannink, B.A., Cappon,J.J. (1994) Present state of the water
quality of European rivers and implications for management, The Science of the Total Environment, 145, 187-195.
Fiebig, D.M. (1997) Microbiological turnover of amino acids immobilized from groundwater discharged through
hyporheic sediments, Limnology & Oceanography, 42, 763-768.
Findlay, S., Sobczak, W.V. (1996) Variability in removal of dissolved organic carbon in hyporheic sediments,
Journal of the North American Benthological Society, 15, 35-41.
Fontvieille, D. (1987) La circulation du carbone organique dans les écosystèmes lotiques : cas du phénomène
d’auto-épurtation, Thèse de doctorat d’Etat, Université Lyon I, 190 p.
Gibert, J. (1990) Behaviour of aquifers concerning contaminants : differential permeability and importance of the
different purification processes, Water Science & Technology, 22, 101-108.
Hendricks, S.M., White, D.S. (1995) Seasonal biogeochemical patterns in surface water, subsurface hyporheic and
riparian ground water in a temperate stream ecosystem, Archiv für Hydrobiologie, 134, 459-490.
Hollibaugh, J.T., Azam, F. (1983) Microbial degradation of dissolved proteins in seawater, Limnology &
Oceanography, 28, 1104-1116.
Jones, S.E., Lock, M.A. (1989) Hydrolytic extracellular enzyme activity in heterotrophic biofilms from two
contrasting streams, Freshwater Biology, 22, 289-296.
Lähdesmäki, P., Piispanen, R. (1992) Soil enzymology : role of protective colloid systems in the preservation of
exoenzymes activities in soil, Soil Biology & Biochemistry, 24, 1173-1177.
van Loosdrecht, M.C.M., Eikelboom, D., Gjaltema, A., Mulder, A., Tijhuis, L., Heijnen, J.J. (1995) Biofilm
structures, Water Science & Technology, 8, 35-43.
Mayer, L.M. Schick, L.L., Sawyer, Th., Plante, C.J., Jumars, P.A., Self, R.L. (1995) Bioailable amino acids in
sediments: a biomimetic, kinetics based approach, Limnology & Oceanography, 40, 511-520.
Mayer, L.M. (1989) Extracellular proteolytic enzyme activity in sediments of an intertidal mudflat, Limnology &
Oceanography, 34, 973-981.
McLoughlin, J., Crombie-Quilty, M.B., (1983) The kinetics of protein removal by activated sludge, Water
Research, 17, 161-166.
Newbold, J.D., Mulholland, P.J., Elwood, J.W., O’Neill, R.V. (1982) Organic carbon spiralling in stream
ecosystems, Oikos, 38, 266-272.
Pflug, W. (1979) Über die hemmung der Aminopeptidase K (aus Tritirachium album Limber) durch Huminstoffe,
Zeitschrift Pflanzenernahrung & Bodenkunde, 142, 290-298.
Rad, J.C., Navarro- González, M., González-Carcedo, S. (1995) Characterization of proteases extracted from a
compost of municipal solid wastes, Geomicrobiology Journal, 13, 45-56.
Romaní, A.M., Butturini, A., Sabater, F., Sabater, S. (1998) Heterotrophic metabolism in a forest stream
sediment: surface versus subsurface zones, Aquatic Microbial Ecology, 16, 143-151.
Scholz, O., Boon, P.I. (1993) Alkaline phophatase, aminopeptidase and β-D-glucosidase activities associated with billabong perophyton, Archiv für Hydrobiologie, 126, 429-443.
Sinsabaugh, R.L., Findlay, S., Franchini, P., Fischer, D. (1997) Enzymatic analysis of riverine bacterioplankton
production, Limnology & Oceanography, 42, 29-38.
Sinsabaugh, R.L., Linkins, A.E., (1988) Exoenzyme activity associated with lotic epilithon, Freshwater Biology,
20, 249-261.
Somville, M., Billen, G. (1983) A method for determining exoproteolytic activity in natural waters, Limnology &
Oceanography, 28, 190-193.
Udenfriend S., Stein S., Böhlen P., Dairman W., Leimgruber W., Weigele M. (1972) Fluorescamine : a reagent
for assay of amino acids, peptides, proteins and primary amines in the picomole range, Science, 178, 871-872.
Webster, J.R., Gurtz, M.E., Hains, J.J., Meyer, J.L., Swank, W.T., Waide, J.B., Wallace, J.B., (1983) Stability
of ecosystems, in : Application and testing of general ecological theory, Eds. Barnes, J.R. & Minshall, G.W., Plenum Press, New-York, 355-395.
White, D.S. (1993) Perspectives on defining and delineating hyporheic zones, Journal of the North American
Wimpenny, J.W.T., Colasanti, R. (1997) A unifying hypothesis for the structure of microbial biofilms based on