51
Psycho-social Problems and Causes Canadian Counsellor
Conseiller Canadien
1984, Vol. 18, No. 2, 51-71
PSYCHO-SOCIAL PROBLEMS AND CAUSES: INDEXES OF CHANGE
MYRNE B. NEVISON University of British Columbia
Abstract
Social scientists see a pervasive crisis in our society yet also sense now a new willingness to face our problems of rapid change. This study first examines the rate and direction of change in social problems by developing indexes (comparable to the Consumer Price Index) for major problem areas. These measures show a period of relative stability in the 1950's and early 60's then worrisome inflation accompanied by out-of-control financial costs. The data on family issues particularly raise questions of future trends. The author then discusses a major cause of our difficul-ties, our seeming lack of strength to survive, and identifies crucial life stages where help is required.
Résumé
Les chercheurs en sciences sociales voient notre société dans un état de crise et, en même temps, ils croient déceler une nouvelle volonté de faire face à nos problèmes occasionnés par des changements rapides. Sur la base d'indices comparables à celui des prix à la consommation, on trouve ci-après une analyse du taux et de la direction du changement enregistré quant à des aspects déterminants de la problématique sociale. Les mesures dénotent une période de relative stabilité au cours des années 1950 et au début des années 1960, suivie d'une inflation inquiétante qui correspond à des coûts financiers débridés. Les données sur les problèmes familiaux soulèvent de façon particulière des questions quant aux tendances à venir. L'auteur analyse une cause importante de nos difficultés - un manque apparent de force de survie - et identifie des étapes de vie cruciales pour lesquelles une aide s'avère nécessaire.
Introduction
This is a time of great discontent, of frustration and of anger. It is a time when people are even thinking that our society may well end in a nuclear holocaust.
Reprint requests should be sent to Myrne B. Nevison, Department of Counselling Psychology, University of Bribish Columbia. 2 125 Main Mall, University Campus, Vancouver. B.C.. V6T 1W6.
Yet, from this sense of despair there is emerging a new willingness to face our problems and to forge better answers — a recognition that a crisis can trigger an accep-tance of different realities and solutions. As a
society we are seeking a fresh consensus — a process that will involve our total community. As a social scientist, I welcome this debate and will focus on:
- Indexing the rate and direction of change of social problems.
M.B. Nevison - Exploring a major cause of our difficulties.
Identifying life stages where people need help.
The Problem
We are in the middle of three revolutions; our society is being catapulted into a new age — and we are not sure we will make the transition successfully. First, jobs are changing quickly as we move from the industrial to the techno-logical age. Work will demand more skill and less muscle, more intelligence and flexibility, more career changes. Many people are worried that it will mean fewer jobs and they may end up unemployed — or unemployable.
Secondly, we are moving from a sturdy pioneering orientation to a world of big busi-ness and big government — a world requiring that the two sides work together to further the economy and prevent disasters. And many people fear faceless management, bureaucratic power and indifference to them as individuals. Lastly, we are moving from a time when
women were considered property and were dependent to a society based on human rights and equality where women will have viable choices. And many fear a consequent break-up of the family.
There are massive, fundamental revolutions affecting everyone's self-concept and sense of direction. It is a period of confusion, of bewil-derment, of anger and there are worrisome signs of both economic and personal-social instability. However, it is difficult to gauge our level of functioning under these stresses; we lack a thermometer to tell us the reaction of our body-politic - a reassuring, mild fever or one raging out of control.
In the economic area we have some meas-ures that should tell us how we are doing — the Gross National Product, the Consumer Price Index, the Unemployment Rate — yet in the personal social area Statistics Canada does not provide comparable indexes. It is impera-tive that we develop such measures to indicate the rate and direction of change in people's reactions; we must find out the level at which people are coping and whether action is needed to counteract the trends. We need a psycho-social price index to tell us the cost of living in our society in a period of rapid transition. Indexing problem areas
Ability to Cope
When people are not dealing successfully with the issues they face, they tend to seek
escape routes or hit out at society. Logical areas where we might find useful data on these reactions would be in the alcohol, in suicide rates, in mental illnesses and in criminal behaviours.
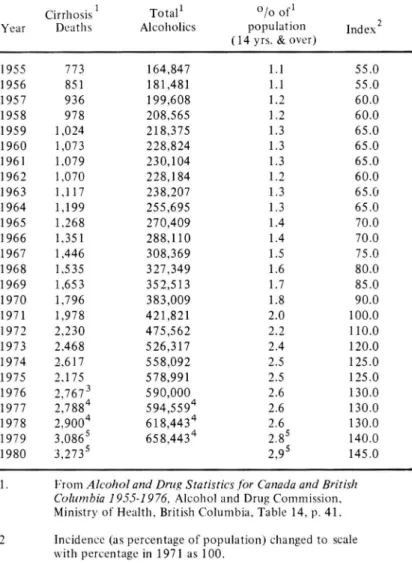
The Abuse of Alcohol. Canadians have always used alcoholic beverages socially and have resisted the thought that they might be harmful but we are now becoming aware that there are indeed problems. It is important that we measure the rate of alcohol abuse and the direction of change. Then, we must seek data on the effect of the level of consumption. Statistics Canada provides an estimate of the percentage of the population considered to be alcoholic; they start with the number of deaths from cirrhosis of the liver then use the Bellinek formula to estimate the number of alcoholics 14 years of age and over. This process seems to provide data that are both valid and reliable.
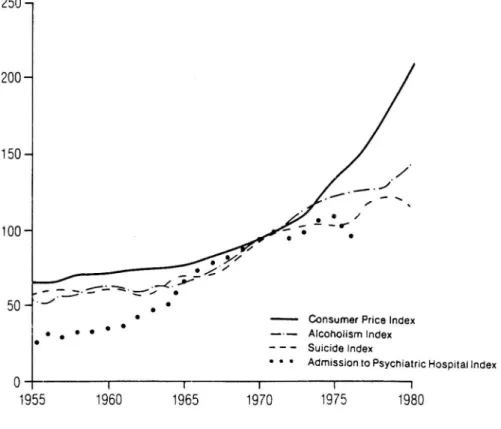
Table 1 gives the data on the number of deaths from cirrhosis of the liver from 1955. the estimated number of alcoholics, the per cent of the population involved and an index of change based on the comparison of the rate in any given year with the rate for 1971 which is 100. This comparison is the one used in the Consumer Price Index and it allows us to get a feel for the meaning of inflation in psycho-social areas as well. The Alcoholism Index and the Consumer Price Index are both shown in Figure 1.
After a period of relative stability from 1955 to 1965, there has been a steady increase in the rate of alcoholism and the number of alcoholics (as a percentage of the population) has doubled since the mid-sixties.
The rate is indeed increasing but one must now ask if the level is serious enough to be a drain on our psychic and financial resources. We find increasing anger in our society at the number of traffic fatalities where alcohol has been involved but how extensive is our use of alcohol? The data are disturbing. We start young - at an average age of 12— and by the mid-teens 60°/o of us use alcohol {Alcohol-Drug Education Service, December 1982. p. 6). By the time we reach our twenties, 90°/o are drinking and 40°/o have at least four drinks a week (MacGregor, 1978). When we are compared to other western countries, only the French and the West Germans drink more and we surpassed the American rate about ten years ago (Brown. 1978). The level
53
Psycho-social Problems and Causes
250-,
200-
150-
100-
50-— Consumer Price Index — Alcoholism Index • - Suicide Index
• Admission to Psychiatric Hospital Index
1955 1960 1965 1970 1975 1980
Figure 1. Ability to Cope Indexes for Alcoholism, Suicides and Admissions to Psychiatric Hospitals and The Consumer Price IndexRate of Change with 1971 = 100
of the use of alcohol is now worrying the World Health Organization which reported "Evidence suggests that alcohol-related problems may even constitute an important obstacle to socio-economic development and may well threaten to overwhelm the health services unless appropriate measures are taken" (Alcohol-Drug Education Service, October 1982, p. 5). The overuse of alcohol in Canada has now resulted in deaths from cirrhosis of the liver ranked third after heart disease and accidents for men in the 45-49 year age (Statistics Canada).
Hospital care is an important and costly component of our society and the abuse of alcohol drains our financial resources. Not only do we have hospitalization costs for people suffering from cirrhosis of the liver and from motor vehicle accidents involving drinking drivers, we also have people in psychiatric hospitals as a result of too much alcohol. In
1975 alcoholic psychosis and alcoholism accounted for 1 1,626 (19°/o) of first
admis-sions to in-patient psychiatric facilities in Canada (Canada Year Book, 1978-79, p. 216). The abuse of alcohol seems to cost us dearly in many areas — hospitalization cost, economic productivity levels, family tragedies — and an index for alcoholism provides useful data in gauging the level of our ability to cope.
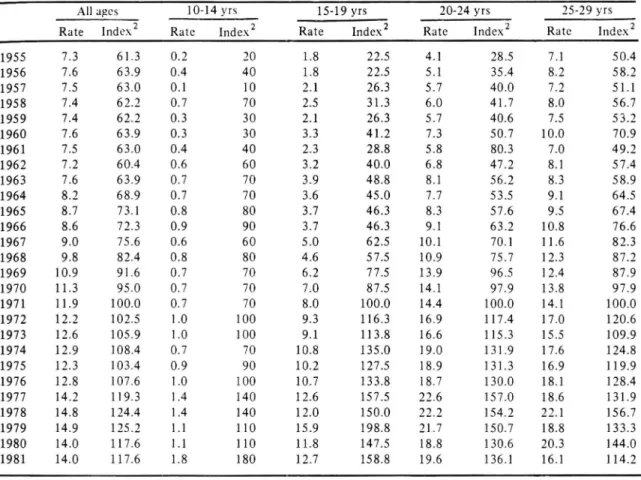
Suicides. We seem to be hearing more and more about suicides — the tragedy of a young person, the grief of an older person who is ill -but again, we need accurate data. Statistics Canada can provide figures on the deaths and from those we can gauge the rate and direction of change.
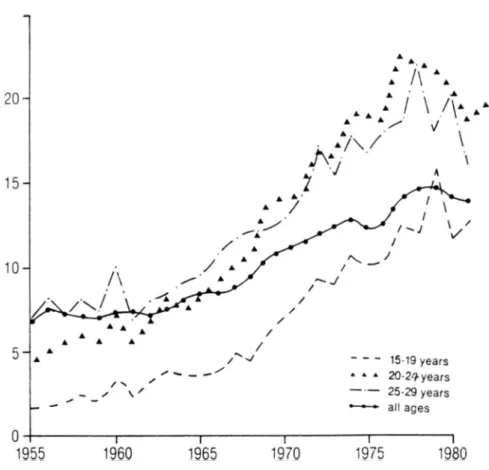
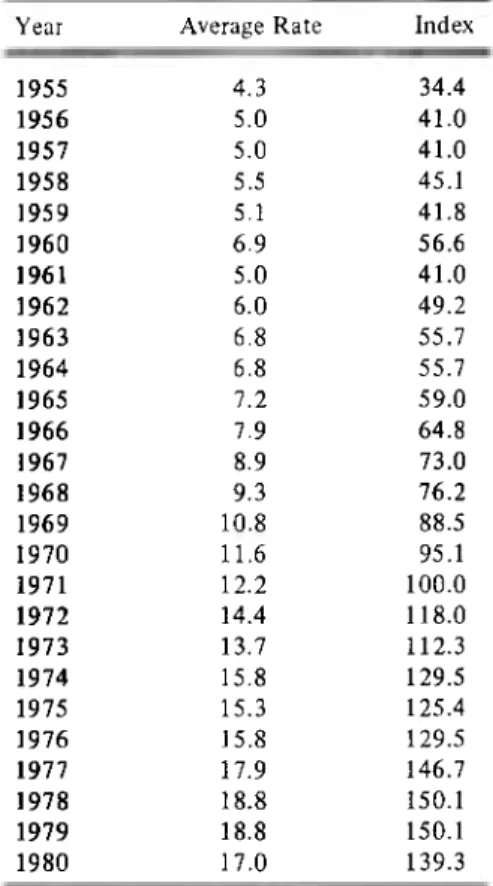
Table 2 includes the rate (per 100,000 of the population or age group) for all ages and for selected younger groups plus the index for the rate of change for each of these; Table 3 gives combined data for young adults aged 15-29. Figure 1 indicates the index for all ages and Figure 2 the actual rates for young people.
M.B. Nevison
Figure 2. Suicides in Young Adults Rates per 100.000 for Selected Age Groups
The suicide rate for all ages has doubled since 1955 but for the 15-19 year age group it has gone up seven times and is now 12.7 per
100,000 of people that age. Rates for the 10-14 age group have gone up by 40°/o and now stand at 1.8. In Figure 2 we can see that the rates for the 25-29 year olds reflect the relative stability from 1955-1965 that we found in the alcoholism and in the rates for suicides of all ages but the rates for the younger groups, 15-19 and 20-24, show a steady in-crease since 1955. Rates declined somewhat from their high peaks in the late 1970's but two have already started up in the 1980's. Any suicide brings sadness to family and friends but is the rate at a serious level for the society? In a joint publication of Statistics Canada and the Canadian Mental Health Association (1981), suicide was noted as the second most frequent cause of death among Canadians between the ages of 15 and 39. Additionally, it is generally believed that for
everyone who commits suicide ten try, and that some of the fatalities from motor vehicle accidents could also be suicides. People seem to consider the suicide rates too high, especially among young people facing high unem-ployment and uncertainty about the ability to get and hold a job now. The indexes for alcoholism and for suicides in the 15-29 year group are combined as the Trouble Index in Figure 6.
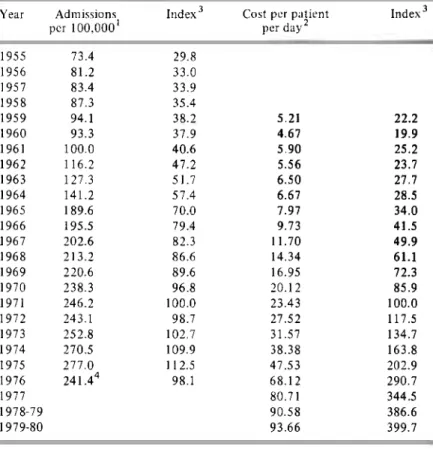
Mental Illness. The classification of mental illness covers a range of disorders, some with chemical implications, some with psycho-social determinants and some related to the abuse of alcohol. However, in this complex area there is a statistic that can give a measure of the rate of illness, that of admissions to psychiatric hospi-tals. Table 4 gives this data and also the per patient daily cost. Figure 1 shows the rate of change for admissions and Figure 7 for costs. From 1955 to 1976, the last date for
55
Psycho-social Problems and Causes
directly comparable figures (and the start of the emphasis on community care rather than hospitalization in large institutions), there was over a three-fold increase in admissions per 100,000 of the population, a steady rise since 1955. The daily cost per patient in public mental hospitals has increased eighteen times in the past 20 years (from $5.21 to $93.66) — at a rate faster than that of the Consumer Price Index (see Figure 7); it reflects an im-proved level of care but still a staggering cost increase.
But again, though the rates are rising quickly, is the level one of serious concern? It
seems yes. According to a joint Statistics Canada - Canadian Mental Health Association report (1981) based on 1978 figures, one in eight of us can expect to be hospitalized for a mental illness at least once during our lifetime and between 10 °/o and 30°/o of us have some form of mental illness (depending on the perceptions and definitions of the various disorders). By far the most frequent diagnosis for women hospitalized was neurosis; for men, alcoholism. It is essential to have a measure of the rate and direction of change for mental illnesses but the problem is so pervasive and ranges from crippling illness and ineffective behaviour of the so-called normal person that
I I I I I I 250 -, 200 - 150- 100- 50-criminal charges
cost of correctional services
1955 1960 1965 1970 1975 1980
Figure 3.Crime Indexes Criminal Charges and Cost of Correctional Services Rate of change with 1971 = 100
M.B. Nevison it is difficult to define clearly and to gather
objective data.
Crime. The level of crime is now touching most of us whether it is the cost of goods elevated by shop lifting, the breaking into of one's own home or the violence against people. Aggression against others is undoubtedly important and the rates of criminal charges do provide a usable measure over time. Rather than using data for juveniles and adults separately (Nevison, 1969), only the one measure, criminal charges, will be used: the data on juveniles from year to year lately are not comparable as age definitions have been changing. Table 5 contains the number of charges per 100,000 of the population and the total costs of correctional services plus the two indexes; Figure 3 compares the rates of change for these.
Comparable figures for criminal charges started in 1962-63 and rates increased over three hundred per cent by 1980; the costs for correctional services have gone from $8.4 million in 1955 to $374.7 million in 1980, an increase of 44 times.
But again, how serious is this level? In considering this, we must review the evidence of these costs but we must also try to look at the disturbing — and, as yet, not fully docu-mented — evidence of violence within the home.
The incidence and cost of crime so alarmed the Canadian Senate that their Standing Com-mittee on Health, Welfare and Science under-took study to determine what preventive action might be taken so that children could get a better and more constructive start in life and thus, hopefully, cut down on the number of criminals.
The report, Child at Risk (Standing Com-mittee on Health, Welfare and Science, 1980) noted "Crimes of violence are a source of great suffering to many individuals and their families, and pose a threat to the stability of our socie-ty... The cost of building and operating prisons and penitentiaries has become a serious charge on the taxpayer (p.X)."
It also pointed out that there has been an alarming increase in violent juvenile delinquen-cy — an increase probably related to the exposure of children in their formative years to
17,000 murders on television (p.44). And, most discouragingly, "Eighty percent of persons admitted to federal institutions have
been previously convicted. Our prison popu tion continues to grow in spite of improv training programs, psychiatric treatment, cou selling services and more permissive granting paroles (p. X)."
But the Senate report went on to open i the subject of violence and criminal acts with the family, acts usually unreported. "Violen in the home is a far more serious problem th violence in the streets, in the classrooms, anywhere else... Domestic violence is increasir Iy being recognized as the most dangero element in our society, with the potential f terrific disaster... Various studies have sho\ that a very high percentage of all murd victims are related to their assailants, mc frequently as husband and wife... Betwe
1968 and 1974... 60°/o of all female murd victims were killed within a family contex and "it has been recently estimated that eve year in Canada one in ten women who £ married or are living common-law is the vict: of a physical assault (p. 43)."
The Senators were also concerned abc the cost of building new penitentiaries: ' constant drain on public funds (for penitt tiaries) which are over-crowded, and what more important, do little to réhabilite successfully the offenders who are sent to the (p.XI)."
The ability to cope seems to be threatened f many, particularly among the younger adul according to these measures of problem are. It is now important to try to get a feel for wh is happening in the family - that basic soc unit in our society.
The Family
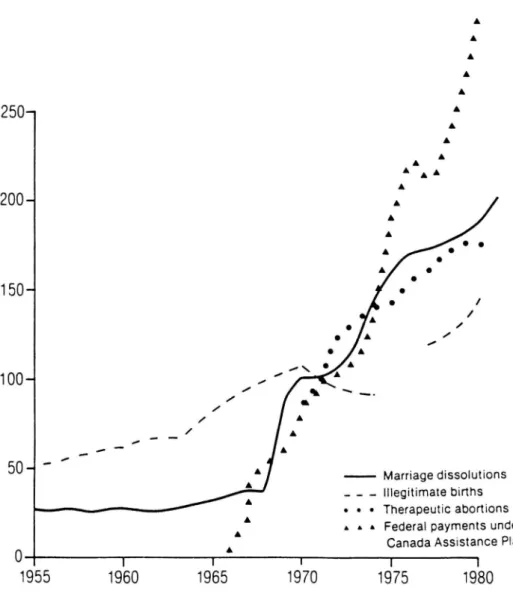
Questions concerning the family E difficult to answer — indeed, increasingly, pose. We can start with data from Statisti Canada on marriage dissolution, a centi concern in family stability, then consider de on seemingly related areas: therapeutic ab( tions. illegitimate births and federal paymer under the Canada Assistance Plan (started 1966 to help people in need, in special ca homes, for child welfare programs and f welfare services by paying half the costs every province). Several factors complica these data (in Table 6 and 8 and Figure 4) ai legislation in 1968 changed the bases f gauging divorce and therapeutic abortioi Also, in 1975 and 1976 one province did n ask new mothers for information on marii status thus making data for those two ye; unusable. Still, there is a pattern of rap increase in the rates of all four indicators ai
5 7
Psycho-social Problems and Causes
Figure 4. Family Indexes Marriage Dissolutions, Illegitimate Births, Abortions, Canada Assistance Payments
the only significant decrease, that in 1970 in the rate of illegitimate births, occurred when the legislation allowed more access to thera-peutic abortions.
In the past ten years when rates might have been expected to stabilize somewhat, the rates for divorce doubled, abortions in-creased fivefold and illegitimate births 50°/o. In that same ten years, payments under the Canada Assistance Plan (which now carries costs formerly borne in large measure by the extended family) have gone from S597.4 million to $2,205.6 million, an increase of 370°/o.
These indexes point to worrisome trends but they do not touch the core of the issues relevant to family stability and a satisfying social unit. We must look at the implications of the estimate mentioned in the Senate report that one woman in ten, married or living common-law, is the victim of physical assault each year. In addition, mental battering is a recognized problem (MacLeod, 1980) and in petitions for divorce 30°/o charged physical or mental cruelty (Statistics Canada). With this level of violence toward women in the home, if women do develop viable options we can expect increasing numbers of divorces.
M. B. Nevison
had any real option because they have not been economically independent. The Status of Women report (MacLeod, 1980) offered some historical perspective: there were two periods when women were not viewed primarily as property and dependents without rights, in ancient Rome during the Punic Wars and in France prior to Revolution. In both periods wife beating diminished and, in Rome, divorces initiated by women became more common (p. 28). In Rome during the wars the women managed the city and afterwards kept their new economic independence. For women to have viable options there must be a climate of respect for all people and opportunities for economic independence.
In Canada the conditions are now right. For a century we have had universal education, about 1917 women started to get a vote and a say politically and during both wars they demonstrated job skills. But more than these
250-,
fundamentals, in the new technological er; brains and skills have become more importan than brawn and, as a society, we have now accepted constitutionally the equality of mer and women.
If ten percent of married women an battered and if increasing members feel eco nomic independence is possible, then indeec we can expect the divorce rates to climb Already twice as many women as men petitior for divorce and, although as a group womer earn only 60°/o of the average wage for men already over half of women 15 years and ovei work outside the home. In 1967 it was 36.5°/o in 1976, 45.0°/o and now it is 51.2°/c (Statistics Canada and Canada Year Book 1978-79). The rate of therapeutic abortions i: considered serious by some people but ; comparison with rates in other countries i: important to get perspective on what mighi happen in Canada. Among the westerr
Figure 5, Consumer Price Index Psycho-Social Price Indexes Rate of Change with 1971 = 100
59
Psycho-social Problems and Causes
countries only the Norwegians, with 11.4 abortions per 1000 live births, have a lower rate than ours (17.7). The American rate is over twice as high (42.8) (Tietze, 1981) and we follow American patterns.
It seems that we can expect higher rates in both marriage dissolutions and therapeutic abortions but there is no agreement in our society on what these trends mean: a higher level of freedom and opportunity or the break-up of the family. Probably everyone will agree on the need for a stable social unit — and probably the family - and everyone will have reservations about its seeming difficulties but the challenge will be to build units that are more satisfying — not to bemoan the current statistics.
Psycho-social Indexes
To permit a more direct comparison of various indicators of difficulties resulting from living in a period of tumultuous change, the indexes for the rates of alcoholism, suicide, mental illness, crime and marriage dissolution are considered together in Table 7 and Figure 5; the Consumer Price Index is included to help convey the meaning of the increases.
In figure 6 the five indexes are grouped together (with equal weighting) as the Psycho-social Price Index. In addition, two indicators of self-destruction, alcoholism and suicide of yound adults (15-19), are combined together as a Trouble Index.
250 -I
Consumer Price Index Gross National Product Index
Psycho-Social Price Index (five areas of Figure 5) Trouble Index (Suicide and Alcoholism)
1955 1960 1965 1970 1975 1980
Figure 6. Gross National Product, Consumer Price Index and Psycho-Social Indexes, Rate of Change with 1971 = 100
M.B. Nevison To get a feel for the meaning of our affluence as a nation compared to the incidence of difficulties, the data for the Gross National Product (Table 8) are included. It is interesting to note that the indexes indicating problems started to rise after the measure of our affluence had been steadily increasing for some years.
Economic and Financial Concerns
Our society needs money to invest in
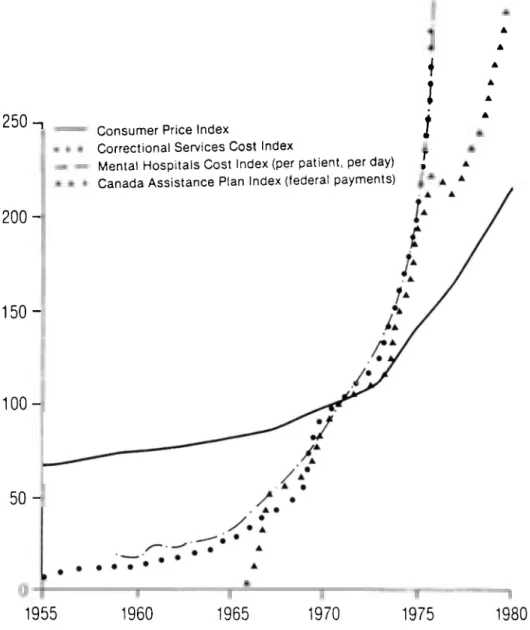
research and development and in job retraining in order to meet the challenges and the opportunities of the technological age with its global markets and we cannot afford un-necessary expenditures. The rate of increase in some of the costs associated with the mal-functioning of our society — prisons, mental hospitals and assistance — are shown in Figure 7 and Table 9. Some of these costs are inevitable and part of a human society but some appear to be a product of our inability to cope - and preventable. 250 -, 200 1 5 0 1 0 0 50
-Consumer Price Index
Correctional Services Cost Index
Mental Hospitals Cost Index (per patient, per day) Canada Assistance Plan Index (federal payments)
1 ! i r » A A A A A A 1955 1960 1965 1970 1975 1980
61
Psycho-social Problems and Causes
A Major Cause of our Difficulties The data and indexes indicate a drain on
both our psychic and financial resources and a level of trouble that is high and still rising. We must turn our attention to the prevention of these enormous costs.
In many respects we are still like the three fishermen (Nevison, 1969) who noticed a body floating in the stream toward them. While attempting to rescue it, another body and yet another appeared. Their frantic efforts at rescue became pitifully inadequate and one of the fishermen started upstream. When his companions asked why he was leaving when they needed him so, he replied he was going to find out what was pushing them in. The story usually stops there but it is incomplete as it assumes that we can prevent their being pushed in. We cannot, for it is the instability inherent in a society in rapid evolution — a pace never before experienced - that overwhelms the people without adequate strengths. The crucial question we must ask ourselves is why are they not stronger swimmers. The urgent task we must set ourselves is the development of people who can cope, who face life with confidence and who are willing to move ahead into the future.
Life Stages Where Help is Required As we take a broad view of our society we can start to understand where we have gone wrong. We used to be a pioneering society where the family was a working as well as a social unit. The extended family helped the young mother and taught the children the skills they would need as adults. The traditional ways of coping were handed down from genera-tion to generagenera-tion and the rate of change was slow enough that people learned to deal with it. At each stage of life there was help.
But not now. Our society is changing so quickly that we do not even know what jobs to prepare for. The choices are so many that we wonder if we are doing the right thing. Our mobility is so great that we have fewer family and lifetime friends nearby. As a result, we have not prepared people for each stage of life. Young mothers too often lack the experi-ence to nurture a baby successfully ; the Senate report, Child at Risk, documents our inade-quacy. Schools are expected to teach the skills we need yet the failure rates document their inability to fulfill their mandate. While we are aware of the anger among so many people we tend to forget that it often comes from a sense of inadequacy and we do not carefully examine
the degree of failure prevalent in our schools. Of the men about 35 — that crucial stage when one wonders about really making it — 39°/o of them have failed by the time they are in grade nine; for the women, 29°/o (Statistics Canada, 1965). These tend to be people who lack confidence and feel inadequate. All too often our adolescents use drugs, become pregnant, wreck cars — and themselves. We have failed to help them make a successful transition from dependence through the illusion of independence to interdependence and their tragedies document our inadequacy.
We are failing to ensure that the young adult obtains a job — any work — and we can expect real trouble from this. We have not prepared young people to be good parents and have certainly not helped them to cope with children in their early teens making adult choices. We have not helped our middle-aged adults change careers as needed and we have segregated our older people. No wonder we have so many people in difficulty. The rates of social problems document our inadequacies in helping adults at crucial stages.
It is in these very fundamental tasks that we have failed. We must now build a society that nurtures the individual at each crucial stage in his life so that he will be prepared to make his contribution and to find life fulfilling. For this age he must be self-reliant, courageous and flexible. We must help each person move from the childhood years of dependence through the adolescent period of seeming independence to the maturity of interdependence.
These are the crucial developmental stages where we must give special help:
1. We must provide the baby, both prior to and after birth, with the nutrition, shelter, care and love required for optimum devel-opment.
2. We must ensure that the child's first years among peers and in the classroom are satisfying and lead to good relationships and work habits.
3. We must allow the adolescent several years to make the transition from child-hood to adultchild-hood to understand and value the coming status; we must not allow a young person to imitate adult behaviours until ready to accept the responsibility for the actions.
4. We must help the young adult to make a successful transition into the world of work and into parental responsibilities.
M.B. Nevison
5. We must help the middle-aged adult to anticipate and prepare for career changes and to cope with the new parenting respon-sibilities in assisting adolescents to under-stand and appreciate the dimensions of maturity.
6. We must encourage the older adult to be vitally involved in the community.
As we ponder the scope of our three revolutions -jobs, interdependence of business and government, and the full equality of women — and as we gain perspective in our
reactions to the resulting stress, we can see that the solutions are not quick and easy and cannot just be handed to us. But as we move beyond that pervasive anger that is looking for targets, we can define what needs to be done to produce the strong swimmers for today's eddying waters — and together we can do it. It means that as a society we must leave behind that false sense of independence and work together interdependently.
A crisis can be destructive but it can also trigger a readiness for better solutions. Table 1
Number of Alcoholics
(Canadian Version of Bellinek Hstimation Formula) Cirrhosis' Total1 0Zoof1
Year Deaths Alcoholics population Index2 (14 yrs. & over)
1955 773 164,847 1.1 55.0 1956 851 181,481 1.1 55.0 1957 936 199,608 1.2 60.0 1958 978 208,565 1.2 60.0 1959 1,024 218,375 1.3 65.0 1960 1,073 228,824 1.3 65.0 1961 1,079 230,104 1.3 65.0 1962 1,070 228,184 1.2 60.0 1963 1,117 238,207 1.3 65.0 1964 1,199 255,695 1.3 65.0 1965 1.268 270,409 1.4 70.0 1966 1,351 288,110 1.4 70.0 1967 1,446 308,369 1.5 75.0 1968 1,535 327,349 1.6 80.0 1969 1,653 352,513 1.7 85.0 1970 1,796 383,009 1.8 90.0 1971 1,978 421,821 2.0 100.0 1972 2,230 475,562 2.2 110.0 1973 2.468 526,317 2.4 120.0 1974 2.617 558,092 2.5 125.0 1975 2.175 578,991 2.5 125.0 1976 2,7673 590,000 2.6 130.0 1977 2,7884 594,5594 2.6 130.0 1978 2,9004 618,4434 2.6 130.0 1979 3,086s 658,4434 2.8s 140.0 1980 3,273s 2,9s 145.0
1. From Alcohol and Drug Statistics for Canada and British Columbia 1955-1976. Alcohol and Drug Commission. Ministry of Health. British Columbia. Table 14. p. 41.
2 Incidence (as percentage of population) changed to scale with percentage in 1971 as 100.
3 Correction in Table from Commission, January, 1983. 4 Updating by Commission, January, 1983.
63
Psycho-social Problems and Causes
Table 2 Suicides
Rate per 100,000 of Population1
All ages 10-14 yrs 15-19 yrs 20-24 yrs 25-29 yrs
Rate Index2 Rate Index2 Rate Index2 Rate Index2 Rate Index2
1955 7.3 61.3 0.2 20 1.8 22.5 4.1 28.5 7.1 50.4 1956 7.6 63.9 0.4 40 1.8 22.5 5.1 35.4 8.2 58.2 1957 7.5 63.0 0.1 10 2.1 26.3 5.7 40.0 7.2 51.1 1958 7.4 62.2 0.7 70 2.5 31.3 6.0 41.7 8.0 56.7 1959 7.4 62.2 0.3 30 2.1 26.3 5.7 40.6 7.5 53.2 1960 7.6 63.9 0.3 30 3.3 41.2 7.3 50.7 10.0 70.9 1961 7.5 63.0 0.4 40 2.3 28.8 5.8 80.3 7.0 49.2 1962 7.2 60.4 0.6 60 3.2 40.0 6.8 47.2 8.1 57.4 1963 7.6 63.9 0.7 70 3.9 48.8 8.1 56.2 8.3 58.9 1964 8.2 68.9 0.7 70 3.6 45.0 7.7 53.5 9.1 64.5 1965 8.7 73.1 0.8 80 3.7 46.3 8.3 57.6 9.5 67.4 1966 8.6 72.3 0.9 90 3.7 46.3 9.1 63.2 10.8 76.6 1967 9.0 75.6 0.6 60 5.0 62.5 10.1 70.1 11.6 82.3 1968 9.8 82.4 0.8 80 4.6 57.5 10.9 75.7 12.3 87.2 1969 10.9 91.6 0.7 70 6.2 77.5 13.9 96.5 12.4 87.9 1970 11.3 95.0 0.7 70 7.0 87.5 14.1 97.9 13.8 97.9 1971 11.9 100.0 0.7 70 8.0 100.0 14.4 100.0 14.1 100.0 1972 12.2 102.5 1.0 100 9.3 116.3 16.9 117.4 17.0 120.6 1973 12.6 105.9 1.0 100 9.1 113.8 16.6 115.3 15.5 109.9 1974 12.9 108.4 0.7 70 10.8 135.0 19.0 131.9 17.6 124.8 1975 12.3 103.4 0.9 90 10.2 127.5 18.9 131.3 16.9 119.9 1976 12.8 107.6 1.0 100 10.7 133.8 18.7 130.0 18.1 128.4 1977 14.2 119.3 1.4 140 12.6 157.5 22.6 157.0 18.6 131.9 1978 14.8 124.4 1.4 140 12.0 150.0 22.2 154.2 22.1 156.7 1979 14.9 125.2 1.1 110 15.9 198.8 21.7 150.7 18.8 133.3 1980 14.0 117.6 1.1 1 10 11.8 147.5 18.8 130.6 20.3 144.0 1981 14.0 117.6 1.8 180 12.7 158.8 19.6 136.1 16.1 114.2 1 Krom Statistics Canada, General Mortality. Catalogue 84-531.
M.B. Nevison
Table 3 Suicides
Rates per 100,000 for 15-29 year Group1
Year Average Rate Index
1955 4.3 34.4 1956 5.0 41.0 1957 5.0 41.0 1958 5.5 45.1 1959 5.1 41.8 1960 6.9 56.6 1961 5.0 41.0 1962 6.0 49.2 1963 6.8 55.7 1964 6.8 55.7 1965 7.2 59.0 1966 7.9 64.8 1967 8.9 73.0 1968 9.3 76.2 1969 10.8 88.5 1970 11.6 95.1 1971 12.2 100.0 1972 14.4 118.0 1973 13.7 112.3 1974 15.8 129.5 1975 15.3 125.4 1976 15.8 129.5 1977 17.9 146.7 1978 18.8 150.1 1979 18.8 150.1 1980 17.0 139.3
1 Rates for 15-29 year group obtained by taking the average of the age groups (15-19, 20-24, 25-29). Rate of change with 1971 = 100.
65 Psycho-social Problems and Causes
Table 4 Mental Illness
Admissions to Psychiatrie Hospitals and Patient Cost in Mental Hospitals
Year Admissions Index3 Cost per patient Index3
per 100,0001 per day2
1955 73.4 29.8 1956 81.2 33.0 1957 83.4 33.9 1958 87.3 35.4 1959 94.1 38.2 5.21 22.2 1960 93.3 37.9 4.67 19.9 1961 100.0 40.6 5.90 25.2 1962 116.2 47.2 5.56 23.7 1963 127.3 51.7 6.50 27.7 1964 141.2 57.4 6.67 28.5 1965 189.6 70.0 7.97 34.0 1966 195.5 79.4 9.73 41.5 1967 202.6 82.3 11.70 49.9 1968 213.2 86.6 14.34 61.1 1969 220.6 89.6 16.95 72.3 1970 238.3 96.8 20.12 85.9 1971 246.2 100.0 23.43 100.0 1972 243.1 98.7 27.52 117.5 1973 252.8 102.7 31.57 134.7 1974 270.5 109.9 38.38 163.8 1975 277.0 112.5 47.53 202.9 1976 241.44 98.1 68.12 290.7 1977 80.71 344.5 1978-79 90.58 386.6 1979-80 93.66 399.7
1 Data from Statistics Canada, Mental Health Statistics, Catalogue 83-204. 2 Data for cost per day for public mental hospitals is from Statistics Canada,
Mental Health Statistics: Institutional Facilities, Services and Finances, Catalogue 83-205. Data for years before 1959 are not based on all public mental hospitals.
3 Rate of change with 1971=100.
Table 5
Crime and correctional services
Year Total cost of Index3 Changes per2'5 Index'
Programs ($000)' 100,000 1954-55 8,460 9.4 1955-56 9,076 10.1 1956-57 10,299 11.4 1957-58 11.157 12.4 1958-59 11,964 13.3 1959-60 13,220 14.7 1960-61 15.224 16.9 1961-62 17.351 19.3 1962-63 9,524 21.7 3338.6 61.9 1963-64 20,419 22.7 3637.5 67.4 1964-65 25,338 28.2 3900.2 72.3 1965-66 28,309 31.5 3831.0 71.0 1966-67 39,348 43.7 4183.4 77.6 1967-68 41,775 46.4 4529.6 84.0 1968-69 49,315 54.8 5045.7 93.6 1969-70 84.6934 94.1 5465.6 101.3 1970-71 89,973 100.0 5205.1 96.5 1971-72 101,239 112.5 5392.8 100.0 1972-73 109,183 121.4 5464.3 101.3 1973-74 135,615 150.7 5897.1 109.4 1974-75 177,206 196.9 6490.5 120.4 1975-76 227,344 252.7 5955.4 110.4 1976-77 268,723 298.7 7086.6 131.4 1977-78 335,323 372.7 7101.5 131.7 1978-79 371,353 412.7 7300.7 135.4 1979-80 374,713 416.5 9293.1 172.3 1980 1 1257.4 208.7
1 Data from Receiver General of Canada, Public Accounts of Canada. Volume II. Details of Expenditures and Revenues, 1980.
2 Data from Statistics Canada, Crime and Traffic Enforcement Statistics. Catalogue 85-205.
3 RateofChangeWith 1971 = 100. 4 Bases for Reporting changed.
67
Psycho-social Problems and Causes
Tabic 6 The family unit
Marriage dissolutions, abortions, illegitimate births Year Marriage dissolution
Rat per 100,000 of population1 Dissolution Index Therapeutic abortions rate per 1000 females2 Abortion index Illegitimate
births3 index4 Birth
1955 38.6 28.5 17,034 52.1 1956 37.3 27.1 17,510 53.6 1957 40.3 29.3 18,629 57.0 1958 36.8 26.7 19,027 58.2 1959 37.4 27.2 20,221 61.9 1960 39.1 28.4 20,413 62.4 1961 36.0 26.2 21,490 65.7 1962 36.4 26.4 22,443 68.6 1963 40.6 29.5 24,458 68.7 1964 44.8 32.6 26,556 81.2 1965 45.9 33.4 28,078 85.9 1966 51.2 37.2 29,391 89.9 1967 54.7 39.8 30,915 94.6 1968 51.8 37.6 32,629 99.8 1969 123.8 90.0 34,041 104.1 1970 139.8 101.6 2.4s 36.4 35,588 108.1 1971 137.6 100.0 6.6 100.0 32,693 100.0 1972 148.4 107.8 8.2 124.2 31,257 95.6 1973 166.1 120.7 8.8 133.3 31,005 94.8 1974 200.6 145.8 9.5 143.9 30,362 92.9 1975 222.0 161.3 9.5 143.9 1976 235.8 171.4 10.3 156.0 1977 237.7 172.7 10.6 160.6 39,7076 121.4 1978 243.4 176.9 11.3 171.2 40,870 125.0 1979 251.3 182.6 11.6 175.8 43,552 133.2 1980 259.1 188.3 11.5 174.2 47,624 145.7 1981 278.0 202.0
1 Data from Statistics Canada, Vital Statistics: Marriages and Divorce, Catalogue 84-205. 2 Data from Statistics Canada, Vital Statistics: Hospital Morbidity, Catalogue 82-206. 3 Data from Statistics Canada, Vital Statistics: Births and Deaths, Catalogue 84-204. 4 Rate changed into scale with 1971=100.
5 Lawgoverningabortionchangedin 1969.
Table 7
Psycho-social price indexes
(Mental health1, suicide, alcoholism, marriage dissolution and crime)
Year Mental Suicide Alcohol Marr. Crime Psycho- Trouble health index index diss. index social index3
index index index2
1955 53.6 58.8 55.0 28.5 49.0 56.9 1956 60.0 63.9 55.0 27.1 51.5 59.5 1957 59.2 63.0 60.0 29.3 52.9 61.5 1958 60.0 63.0 60.0 26.7 52.4 61.5 1959 61.9 62.2 65.0 27.2 54.1 63.6 1960 58.1 63.9 65.0 28.4 53.9 64.5 1961 58.8 63.0 65.0 26.2 53.3 64.0 1962 61.9 60.5 60.0 26.4 61.9 54.1 60.3 1963 61.5 63.9 65.0 29.5 67.4 57.5 64.5 1964 75.0 68.9 65.0 32.6 72.3 62.8 67.0 1965 76.2 73.9 70.0 33.4 71.0 64.9 72.0 1966 74.6 72.3 70.0 37.2 77.6 66.3 71.1 1967 76.9 75.6 75.0 39.8 84.0 70.2 75.3 1968 80.8 81.5 80.0 37.6 93.6 74.7 80.8 1969 84.6 91.6 85.0 90.3 101.3 90.5 88.3 1970 92.7 95.0 90.0 101.6 96.5 95.2 92.5 1971 100.0 100.0 100.0 100.0 100.0 100.0 100.0 1972 95.0 102.5 110.0 107.8 101.3 103.3 106.3 1973 95.4 105.9 120.0 120.7 109.4 110.3 113.0 1974 103.1 108.4 125.0 145.8 120.4 120.5 116.7 1975 105.8 103.6 125.0 161.3 110.4 121.2 114.3 1976 83.1 107.6 130.0 171.4 131.4 124.7 118.8 1977 119.3 130.0 172.7 131.7 125.9 124.7 1978 124.4 130.0 176.9 135.4 141.7 127.2 1979 125.2 140.0 182.6 172.3 155.0 132.6 1980 117.6 145.0 188.3 208.7 164.9 131.3
1 Mental Health Index is the index for admissions to psychiatric hospitals.
2 Index based on all five indicators weighed equally. In years where data from all five are not available, then only the remaining four were used.
Psycho-social Problems and Causes
Table 8 Gross national product
Year In millions of In millions of Index 2 Year Current dollars constant (1971) dollars
1955 28,528 43,891 30.2 1956 32,058 47,599 33.9 1957 33,513 48,718 35.5 1958 34,777 49,844 36.8 1959 36,846 51,737 39.0 1960 38,359 53,231 40.6 1961 39,646 54,741 41.9 1962 42,927 58,475 45.4 1963 45,978 61,487 48.7 1964 50,280 65,610 53.2 1965 55,314 69,981 58.6 1966 61,828 74,844 65.5 1967 66,409 77,344 70.3 1968 72,586 81,864 76.9 1969 79,815 86,225 84.5 1970 85,685 88,390 90.7 1971 94,450 94,450 100.0 1972 105,234 100,248 111.4 1973 123,560 107,812 130.8 1974 147,175 111,766 155.8 1975 165,445 112,955 175.2 1976 190,027 118,484 201.2 1977 207,714 121,566 219.9 1978 230,490 126,191 244.0 1979 261,576 129,850 276.9 1980 291,869 130,467 309.0 1981 331,338 134,540 350.8
1 Data from Statistics Canada, Income and Expenditures Accounting, Catalogue 13-531 and Quarterly Publication 13-001.
Table 9 Financial indicators
Year Federal payments to Canada assistance
plan ($000)1
Index4 Consumer price Index
Unemployment
rate (°/o)3 Index4
1955 67.6 1956 68.5 1957 70.7 1958 72.6 1959 73.4 1960 74.3 1961 75.0 1962 75.9 1963 77.2 1964 78.6 1965 80.6 1966 10,494 1.4 83.5 3.4 54.8 1967 342,711 47.1 86.6 3.8 61.2 1968 406,153 55.8 90.1 4.5 72.6 1969 450,129 61.9 94.1 4.4 71.0 1970 597,432 82.1 97.2 5.7 92.0 1971 727,377 100.0 100.0 6.2 100.0 1972 768,230 105.6 104.8 6.2 100.0 1973 824,775 113.4 112.7 5.5 88.7 1974 1,056,069 145.2 125.0 5.3 85.4 1975 1.378,110 189.5 138.5 6.9 112.9 1976 1,602,129 220.3 148.9 7.1 114.5 1977 1,541,717 212.0 160.8 8.1 130.6 1978 1,683,784 231.4 175.2 8.4 135.5 1979 1,894,871 260.5 191.2 7.5 121.0 1980 2,205,609 303.2 210.6 7.5 121.0
1 Data from Statistics Canada, Social Security, Catalogue 86-201. 2 Data from Statistics Canada.
3 Data from Statistics Canada. 4 Rate of change with 1971 = 100.
71
Psycho-social Problems and Causes
References
Alcohol and Drug Commission, Alcohol and Drug Statistics for Canada and British Columbia 1955-1976. Victoria: Ministry of Health, Britisli Columbia, 1979.
Alcohol-Drug Education Service. Update. Volume VIII, No. 4 and 5, 1982.
Brown, M.M. International Survey, Volume I. Alcohol Taxation and Control Policies (3rd ed.). Brewers Association of Canada, 1978.
MacGregor, B. Alcohol Consumption in Canada -Some Preliminary findings of a National Survey (Research Paper LRD-78-152). Ottawa: Promo-tion and PrevenPromo-tion Directorate, Health and Welfare Canada, 1978.
MacLeod, L. Wife Battering in Canada: The Vicious Circle. Ottawa: Canadian Government Publishing Centre, 1980. (A report prepared for the Cana-dian Advisory Council on the Status of Women.) Nevison, M.B. There's other kind of inflation - and
the costs are high. Canadian Counsellor, 1969, 3, (4),48-60.
Receiver General of Canada. Public Accounts of Canada. Volume II, Details of Expenditures. Ottawa, 1980.
Standing Senate Committee on Health, Welfare and Science. Child at Risk . Ottawa: Canadian Government Publishing Office, 1980.
Statistics Canada. Canada Year Book 1978-1979. Ottawa, 1978.
Statistics Canada. Current Progress Through the Schools by Age and Grade. Ottawa. 1965. Statistics Canada. One in Eight. Ottawa: Published
in collaboration with the Canadian Mental Health Association, 1981.
Statistics Canada:
Catalogue 13-531 and Quarterly Publication 13-001.
Catalogue 82-206, Vital Statistics: Hospital Morbidity.
Catalogue 83-205, Mental Health Statistics: Institutional Eacilities, Services and Finances. Catalogue 84-204, Vital Statistics: Births and Deaths.
Catalogue 84-205, Vital Statistics: Marriage and Divorce.
Catalogue 84-351. General Mortality. Catalogue 85-205. Crime and Traffic Enforce-ment.
Catalogue 86-201, Social Security.
Tietze, C Induced Abortion: A Global Review. New York: The Population Council. 1981.
ABOUT THE A UTHOR
Myrne B. Nevison received her B.A. from the University of British Columbia and her Ph.D. from the University of Minnesota and was a secondary school counsellor before teaching at the university level, first at the University of Northern Colorado then at the University of British Columbia. When she retired in 1982, she was head of UBCs Department of Counselling Psychology.
She was a founding member of C.G.C.A. then president in 1969-71; also, she founded The Canadian Counsellor and was editor 1967-75. She is an honorary member of both CG.C.A. and the B.C. School Counsellors' Association.
Her current interests include (besides travel) a concern about the inadequacy of our help to people as they try to meet the require-ments of each developmental stage in life in order to be strong enough to live successfully in the changing demands of the post-industrial society.