HAL Id: hal-00296979
https://hal.archives-ouvertes.fr/hal-00296979
Submitted on 26 Apr 2007
HAL is a multi-disciplinary open access
archive for the deposit and dissemination of
sci-entific research documents, whether they are
pub-lished or not. The documents may come from
teaching and research institutions in France or
abroad, or from public or private research centers.
L’archive ouverte pluridisciplinaire HAL, est
destinée au dépôt et à la diffusion de documents
scientifiques de niveau recherche, publiés ou non,
émanant des établissements d’enseignement et de
recherche français ou étrangers, des laboratoires
publics ou privés.
Mapping monthly rainfall data in Galicia (NW Spain)
using inverse distances and geostatistical methods
J. M. Mirás-Avalos, A. Paz-González, E. Vidal-Vázquez, P. Sande-Fouz
To cite this version:
J. M. Mirás-Avalos, A. Paz-González, E. Vidal-Vázquez, P. Sande-Fouz. Mapping monthly rainfall
data in Galicia (NW Spain) using inverse distances and geostatistical methods. Advances in
Geo-sciences, European Geosciences Union, 2007, 10, pp.51-57. �hal-00296979�
© Author(s) 2007. This work is licensed under a Creative Commons License.
Geosciences
Mapping monthly rainfall data in Galicia (NW Spain) using inverse
distances and geostatistical methods
J. M. Mir´as-Avalos1, A. Paz-Gonz´alez1, E. Vidal-V´azquez2, and P. Sande-Fouz1
1Faculty of Sciences, University of Coru˜na, 15071 Coru˜na, Spain 2EPS Lugo, University of Santiago de Compostela, 27002 Lugo, Spain
Received: 12 July 2006 – Revised: 2 January 2007 – Accepted: 27 January 2007 – Published: 26 April 2007
Abstract. In this paper, results from three different
inter-polation techniques based on Geostatistics (ordinary kriging, kriging with external drift and conditional simulation) and one deterministic method (inverse distances) for mapping to-tal monthly rainfall are compared. The study data set com-prised total monthly rainfall from 1998 till 2001 correspond-ing to a maximum of 121 meteorological stations irregularly distributed in the region of Galicia (NW Spain). Further-more, a raster Geographic Information System (GIS) was used for spatial interpolation with a 500×500 m grid digital elevation model. Inverse distance technique was appropriate for a rapid estimation of the rainfall at the studied scale. In order to apply geostatistical interpolation techniques, a spa-tial dependence analysis was performed; rainfall spaspa-tial de-pendence was observed in 33 out of 48 months analysed, the rest of the rainfall data sets presented a random behaviour. Different values of the semivariogram parameters caused the smoothing in the maps obtained by ordinary kriging. Kriging with external drift results were according to former studies which showed the influence of topography. Conditional sim-ulation is considered to give more realistic results; however, this consideration must be confirmed with new data.
1 Introduction
Rainfall is one of the main variables that define the climate of a region so its spatial characterisation is highly relevant. In Galicia, Northwestern Spain, the influence of topography and distance from the coast on rainfall had been described previously from annual isohyets maps obtained by traditional interpolation methods (De U˜na ´Alvarez, 2001). Highest rain-fall values observed for an average of 30 years are located on the eastern mountains and on the precoastal elevations
Correspondence to: J. M. Mir´as-Avalos
and the lowest ones are observed in the interior fluvial val-leys. Annual rainfall amounts show a complex distribution because of the importance of the interactions between atmo-spheric and geographical variables (Carballeira et al., 1983; De U˜na ´Alvarez, 2001). In this region, an increase of rainfall with elevation and a decrease of rainfall with distance to the shoreline is an expected result, because of the general cir-culation pattern with fronts arriving from the West, mainly from the Southwest. However, generally, a loss of regularity in the rainfall regime is observed when the distance to the shoreline increases, which may be attributed to the influence of topography at smaller scale (De U˜na ´Alvarez, 2001).
Rainfall is a spatio-temporal intermittent phenomenon dis-playing large spatial and temporal variability and rain gauge networks only collect point estimates. Thus, providing an estimate of rainfall spatial distribution within an area from raingauges data frequently remains a problem of interpola-tion. Indeed, other methods do exist which can provide bet-ter resolution without inbet-terpolation, such as radar measure-ments, but nowadays only one radar is installed in our study region so that and of the area of Galicia is not covered by this device.
Traditional interpolation methods, such as inverse dis-tances, are appropriate for a rapid estimation and they can be integrated into a Geographical Information System (GIS) as well. On the other hand, geostatistical methods require a complete previous analysis of the spatial structure of the studied phenomenon and might be non-applicable in all the occasions but they perform a better interpolation when the variable shows a spatial dependence.
Several studies have demonstrated the convenience of performing geostatistical analysis for mapping rainfall in different geographical locations (Goovaerts, 2000; G´omez Hern´andez et al., 2001; Militino et al., 2001), mainly at the yearly scale. Moreover, the use of a complex technique is no warranty of a better performance in a given region (G´omez Hern´andez et al., 2001).
52 J. M. Mir´as-Avalos et al.: Mapping monthly rainfall data in Galicia
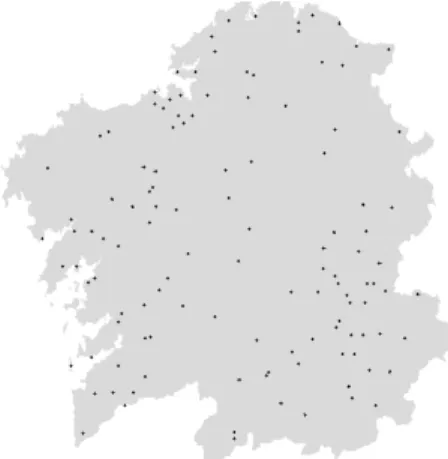
Fig. 1. Digital elevation model of Galicia and raingauge distribution.
In this paper, monthly rainfall data from Galicia (NW Spain) are interpolated using a deterministic method (inverse distances) and geostatistical methods (ordinary kriging, krig-ing with external drift and gaussian conditional simulation). Interpolation performances of the different algorithms are compared.
2 Data and domain
Data sets used in this work corresponded to total monthly rainfall (in millimetres) during the period from January 1998 to December 2001 and are referred to 121 rain gauges which are distributed irregularly on Galicia. In order to carry out spatial interpolation using geostatistical techniques, a com-plete analysis of the spatial structure of this data set was per-formed using GSTAT software (Pebesma, 2000) integrated in a GIS called PCRaster (Van Deursen and Wesseling, 1992).
The basis for performing interpolations by both geostatis-tical and inverse distance methodologies was a digital ele-vation model of Galicia (Thonon and Paz Gonz´alez, 2004) which consists of regular cells of 500 by 500 m covering an area of 29 750 km2(Fig. 1). Raingauge distribution is shown in Fig. 1 as well.
Data sets were characterised statistically; this description included the calculation of mean, median, mode, minimum, maximum, coefficient of variation, standard deviation, skew-ness and kurtosis. Number of data varied from 71 to 121 measurements depending on the month.
Moreover, an analysis of correlation between rainfall and altitude and distance to the shoreline was carried out in or-der to incorporate comprehensive altitude and distance to the shoreline data as secondary information in the interpolations.
3 Interpolation methods
3.1 Inverse distances interpolation
Inverse distances method was used as a reference for map-ping monthly rainfall data: rainfall is estimated as a linear combination of several surrounding observations, with the weights being inversely proportional to the square distance between observations and the point to be estimated (Bur-rough and McDonnell, 1998).
3.2 Semivariogram analysis
Spatial variability was primarily evaluated through semivar-iogram calculation, graphing, model fitting and comparison for each variable (Burgess and Webster, 1980). To verify the spatial variability of rainfall, results were analyzed as de-scribed by Vieira (2000), based on the assumptions of sta-tionarity in accordance with the intrinsic hypothesis. Geo-statistical data treatment comprised the analysis of semi-variograms and fitting of their respective model parameters. Based on the mathematical model used to fit the data, the fol-lowing semivariogram parameters were defined: a) nugget effect (C0), which is the value of the semivariogram when distance is 0; b) range of the spatial dependence (d), which is the range or distance at which semivariogram remais ap-proximately constant, after increasing as distance increases; c) treshold (C0+C1)which is sill value approaching the data variance.
All semivariograms were estimated using GSTAT software (Pebesma, 2000). Initially, the method used to select the pa-rameters (nugget effect, range, sill) of the different semivari-ogram models was the weighted least-squares method, where the weights were the number of datapairs that provided the information needed to calculate the experimental semivari-ograms. Then, the cross-validation technique (Chil´es and Delfiner, 1999) was used to check model performance.
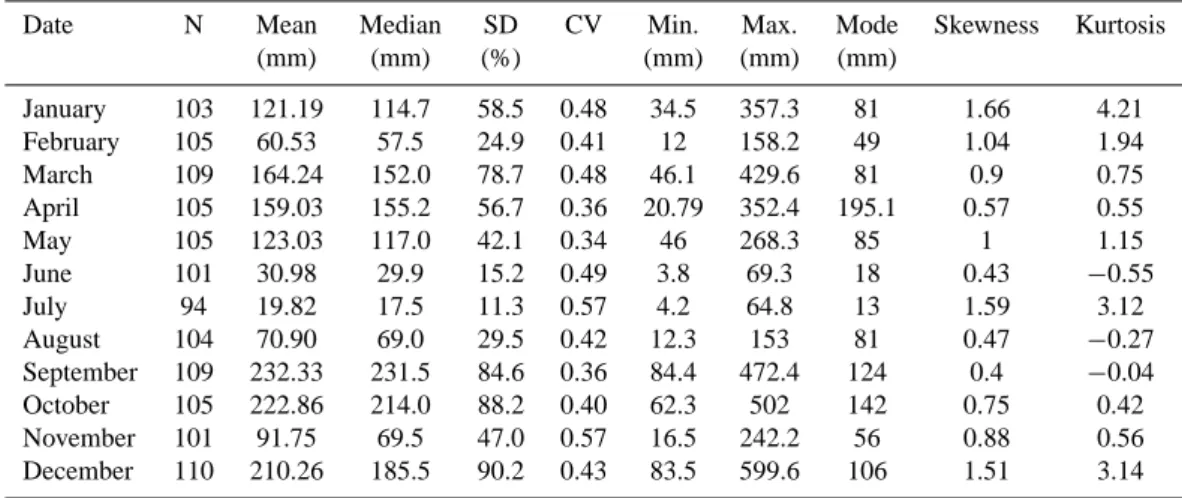
Table 1. Statistical summary of the monthly rainfall of 1999 (SD = standard deviation; CV = coefficient of variation).
Date N Mean Median SD CV Min. Max. Mode Skewness Kurtosis
(mm) (mm) (%) (mm) (mm) (mm) January 103 121.19 114.7 58.5 0.48 34.5 357.3 81 1.66 4.21 February 105 60.53 57.5 24.9 0.41 12 158.2 49 1.04 1.94 March 109 164.24 152.0 78.7 0.48 46.1 429.6 81 0.9 0.75 April 105 159.03 155.2 56.7 0.36 20.79 352.4 195.1 0.57 0.55 May 105 123.03 117.0 42.1 0.34 46 268.3 85 1 1.15 June 101 30.98 29.9 15.2 0.49 3.8 69.3 18 0.43 −0.55 July 94 19.82 17.5 11.3 0.57 4.2 64.8 13 1.59 3.12 August 104 70.90 69.0 29.5 0.42 12.3 153 81 0.47 −0.27 September 109 232.33 231.5 84.6 0.36 84.4 472.4 124 0.4 −0.04 October 105 222.86 214.0 88.2 0.40 62.3 502 142 0.75 0.42 November 101 91.75 69.5 47.0 0.57 16.5 242.2 56 0.88 0.56 December 110 210.26 185.5 90.2 0.43 83.5 599.6 106 1.51 3.14
Because of the limited number of measured data only the omnidirectional semivariogram was computed, and hence the spatial variability is assumed to be identical in all directions. Classic criteria for calculating semivariograms were taken into account (Samper Calvete and Carrera Ram´ırez, 1996; Goovaerts, 1997).
3.3 Kriging and simulation
Geostatistical interpolation was performed according to the following methods:
– Ordinary kriging (OK).
– Kriging with external drift (KED). – Gaussian conditional simulation (GS).
The complete mathematical description of these method-ologies is beyond the scope of this report (Samper Calvete and Carrera Ram´ırez, 1996; Goovaerts, 1997; Chil´es and Delfiner, 1999) so they are described only briefly.
OK is by far the most common type of kriging in practice (Webster and Oliver, 2001). Kriging interpolation methods provide each cell with a local, optimal prediction and an es-timation of the error that depends on the variogram and the spatial configuration of the data (Burrough and McDonnell, 1998). Kriging is a generalized technique that allows one to account for the spatial dependence between observations, as revealed by the semivariogram, into spatial predictions (Goovaerts, 2000). The OK weights are determined such as to minimize the estimation variance (Goovaerts, 2000).
KED incorporates secondary information into the kriging system when the main and secondary variable are correlated. It is necessary to know the value of the secondary variable at all points where the primary variable is going to be estimated (Goovaerts, 1997). The secondary information is used to find
the local means of the primary variable and performs simple kriging on the corresponding residuals (Goovaerts, 2000).
Conditional simulation was performed as described by Deustch and Journel (1992). The method used the Gaussian conditional simulation through LU (lower-upper) decompo-sition of the variance matrix. Conditional simulation com-bines the data at the observation points with the information from the variogram to compute the most likely outcomes per cell as a function of the variogram parameters. When a suf-ficient realization number is used, mean values obtained by simulation are expected to be similar to those obtained by kriging. Conditional simulation was performed as described by Deustch and Journel (1992). When a sufficient realiza-tion number is used, mean values obtained by simularealiza-tion are expected to be similar to those obtained by kriging. This method does not provide estimation error maps. For con-ditional simulation analysis, 100 different realizations were run. From these data, a mean value was computed as well as standard deviation.
4 Results and discussion
4.1 Statistical analysis
Mean annual rainfall during the study period varied from 1214.3 mm in 1998 to 1772.5 mm in 2000; the wettest month was March 2001 (467.4 mm) and the driest one was August 1998 (6.6 mm). Table 1 shows the results for the statistical analysis of monthly rainfall during 1999, as an example.
Coefficients of variation (defined as the ratio of the stan-dard deviation to the mean) of monthly rainfall values, which varied between 20% and 146%, showed the spatial hetero-geneity of the rainfall in Galicia; this variability was higher in the dry season, from June to August (see Table 1 and Mir´as Avalos, 2003).
54 J. M. Mir´as-Avalos et al.: Mapping monthly rainfall data in Galicia
Table 2. Rainfall mean values estimated by the different methodologies used in this study. Data appear in millimetres.
Month Measured Inverse distance OK KED altitude KED distance to the shoreline GS
January 1998 143.2 142.8 144.2 122.4 138.9 158.9 June 1998 31.4 31.1 30.8 32.2 31.0 33.3 July 1998 43.8 44.9 45.8 43.5 45.7 50.6 August 1998 6.6 6.9 7.3 7.8 7.3 8.9 November 1998 82.1 82.0 81.5 87.1 82.2 86.6 December 1998 121.4 120.8 120.2 112.8 118.2 132.6 January 1999 121.2 121.2 120.7 116.1 117.8 133.1 February 1999 60.5 60.2 60.1 60.7 59.1 66.1 March 1999 164.2 166.3 163.3 172.4 166.0 183.6 April 1999 159.0 160.3 158.6 146.0 156.6 177.4 May 1999 123.0 123.3 124.1 121.1 123.3 136.4 July 1999 19.8 20.2 20.0 19.8 20.1 22.6 August 1999 70.9 70.5 70.6 66.8 70.0 78.4 September 1999 232.3 233.3 230.6 221.5 229.1 260.8 October 1999 222.9 222.8 225.2 203.9 223.6 248.1 November 1999 81.8 82.3 84.0 86.8 83.5 90.1 December 1999 210.3 206.9 202.3 213.8 204.2 226.7 March 2000 29.7 30.4 30.8 31.0 30.8 34.5 April 2000 314.8 312.3 306.9 313.9 306.2 342.3 May 2000 96.0 95.9 95.2 96.7 95.3 106.5 June 2000 16.3 16.6 17.0 18.1 16.8 18.6 July 2000 60.9 60.2 62.3 62.4 61.6 68.7 August 2000 47.3 46.0 43.7 44.7 43.7 48.2 September 2000 79.7 79.2 79.1 73.1 77.0 87.0 October 2000 173.2 172.2 171.5 161.4 168.5 189.1 November 2000 410.3 404.7 398.4 397.3 394.7 439.9 December 2000 445.4 451.2 458.9 461.1 451.9 508.1 January 2001 368.1 370.2 365.0 373.9 365.4 404.4 March 2001 467.4 465.1 459.7 476.8 460.4 511.6 April 2001 82.5 81.5 81.7 84.7 80.9 88.3 July 2001 82.1 82.8 82.8 86.4 83.4 92.0 August 2001 56.6 57.0 56.0 59.3 56.2 60.8 October 2001 226.9 224.1 216.5 224.7 216.4 251.2
Skewness and kurtosis coefficient values were close to those of a standard Gaussian variable. From this test, it was assumed that monthly rainfall data followed a Gaussian dis-tribution, which is a requisite for standard semivariogram analysis.
On the other hand, by linear regression analysis it was found that correlation between altitude and rainfall ranged from 0.04 to 0.55, whereas correlation between rainfall and distance to the shoreline varied from 0.004 to 0.71. The use of this comprehensive secondary information into the map-ping of rainfall was only worth accounting when correlation coefficients were statistically significant.
4.2 Spatial dependence analysis
Different theoretical functions (spherical, exponential, linear and gaussian) with variable nugget effects depending on the analyzed month were fitted to experimental data. Rainfall
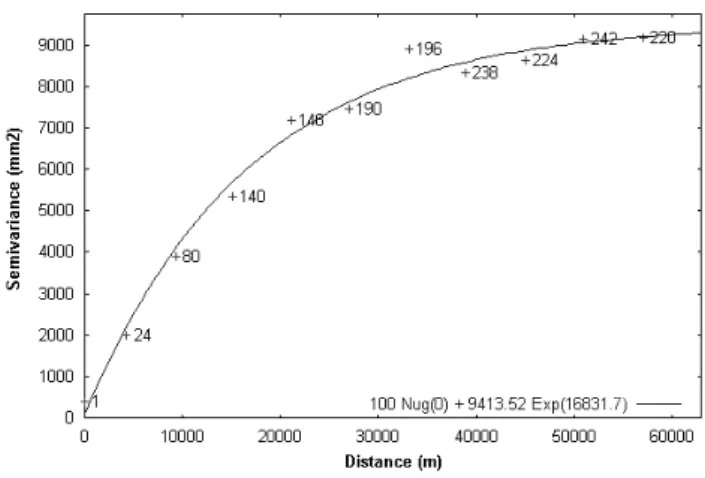
spatial dependence was observed in 33 out of 48 months an-alyzed; the rest of the rainfall data sets presented no spatial structure and were modelled by a pure nugget effect. The most frequently used model was the exponential which was fitted to 18 monthly data series; spherical model was fitted to 13 data series, gaussian and linear models were fitted to one data set each. An example of experimental semivariogram and its fitted model is shown in Fig. 2, each number in the figure represents the number of pairs for each lag. Range and nugget effect of the fitted models were variable fluctu-ating, the former, between 2.99 and 59.87 km and, the latter, between 0 and 64.02% of the sill value. Generally, spatial de-pendence ranges were higher for the spherical models than for the exponential ones; ranges were lower than 10 km in 8 occasions, were between 10 and 30 km in 14 months and were higher than 30 km 11 times. Due to the short spatial dependence range, kriging interpolation results showed high
kriging estimation errors as the distance to the rain gauges increased. Nugget effects were nule or lower than 10% in 15 months; between 10 and 25% in seven months and higher than 25% in 11 months. Therefore, half of the studied data series showed a high spatial dependence. Cross-validation showed that the theoretical structures described the spatial dependence of rainfall adequatelly (data not shown; Mir´as Avalos, 2003).
4.3 Inverse distances
Inverse distance technique was the only method that could be used for mapping monthly rainfall in Galicia in all the studied months. Maps obtained by this technique showed a division in more or les distinct areas and, within them, usually punc-tual areas corresponding to high or low rainfall values were observed, which resulted in a discontinuous appearance of the maps (Fig. 3). Generally, differences between mean val-ues measured at the gauges and those obtained by inverse distances method were lower than ±10 mm (Table 2). 4.4 Ordinary kriging (OK)
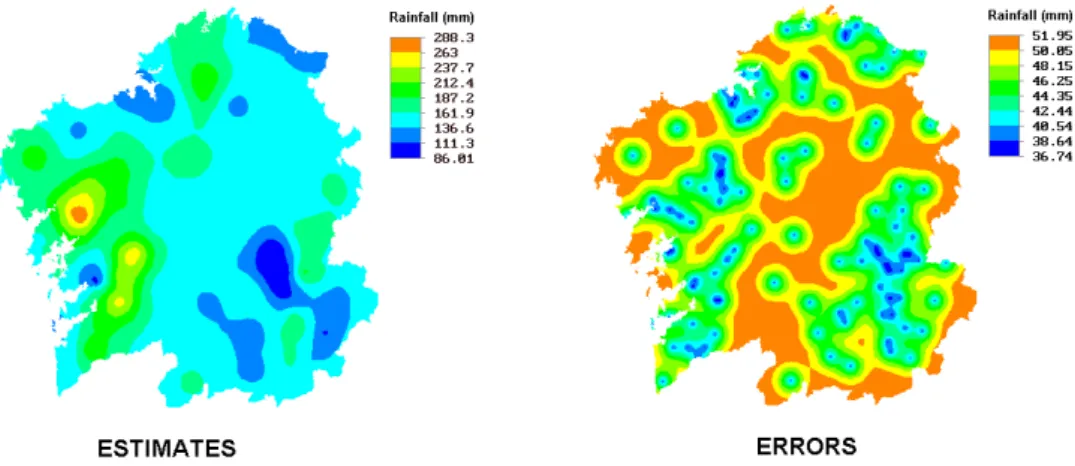
Maps of mean monthly rainfall obtained by this method showed distribution patterns similar to those obtained by in-verse distances (Fig. 3). However, these maps were too smooth for reproducing measured maximum and minimum data; moreover, error maps tended to show a high and uni-form uncertainty pattern (Fig. 4). Thus, OK offered both smoothed maps and high kriging errors. In fact, estimated extreme values showed a lower oscillation ratio than those which were measured, but sometimes they were not very dif-ferent. Overall, OK tended to underestimate rainfall mean values (Table 2). Kriging errors were high in most of the study area except in those areas located nearby the rain gauges. In fact, due to the small range of spatial dependence, generally in the order of 10 km, kriging errors with small val-ues were limited to a close neighbourhood around the rain gauges.
4.5 Kriging with external drift (KED)
Additional information (altitude and distance to the shore-line) was used in order to enhance the previous estimation by using the KED technique. A noticeable influence of topogra-phy over the rainfall estimated values was observed (Fig. 3). The influence of altitude over rainfall estimated values is more obvious when spatial dependence range is lower than 10 km; however, when distance to the shoreline was used as secondary information, this technique gave maps similar to those obtained by ordinary kriging.
KED tended to underestimate monthly rainfall mean val-ues up to 15% (Table 2). Results using altitude as secondary information showed differences regarding those of ordinary kriging and inverse distances. Moreover, KED estimation uncertainty showed a similar pattern to that obtained by OK
Fig. 2. Example of experimental variogram and its fitted model,
April 2000.
and they showed similar values, as well (data not shown; Mir´as Avalos, 2003).
4.6 Gaussian conditional simulation (GS)
This technique gave average maps that presented a variability which made them to seem real, reproducing, simultaneously, measured values (Fig. 3). Generally, coefficients of varia-tion of each 100 simulavaria-tion set were lower than 25%. This methodology seemed to overestimate the rainfall mean val-ues between 2% and 35% (Table 2).
Conditional simulation interpolation reproduced monthly rainfall minimum and maximum values when nugget effect was nule or low. However when nugget effects were high, oscillation ranges of simulated values were lower than those registered at the rain gauge network.
The fact that montly mean rainfall values obtained by conditional simulation were systematically higher than those registered, might be a good approximation to reality, because of the irregular distribution in altitude of the rain gauges used for this study. In other words, higher values of rainfall are ex-pected in mountain areas where the rainfall network is scarce, thus conditional simulation results could be a more accurate approximation to real rainfall over Galicia than mean values obtained from measurement network.
4.7 Comparison of kriging and simulation results
Like the inverse square distance method, geostatistical inter-polation aims at estimating the unknown rainfall depth at the unsampled location as a linear combination of neighbouring observations. The main advantage of kriging is to provide kriging estimation error maps. OK main drawbacks in this study were the smoothing of the estimation maps and the high values of the kriging errors.
KED yields maps whose trends reflect the variability of the secondary attribute but it is not proof that those trends
56 J. M. Mir´as-Avalos et al.: Mapping monthly rainfall data in Galicia
Fig. 3. Rainfall distribution for November 1999 interpolated by different techniques.
Fig. 4. Rainfall distribution for April 1999 interpolated by ordinary kriging and estimation errors for the same data set.
necessarily pertain to the study variable (Deustch and Jour-nel, 1992). The relation between elevation and rainfall is assessed locally, which allows one to account for changes in correlation across the study area (Goovaerts, 2000). In this exercise, KED maps showed a high influence of the altitude when semivariogram ranges were short. This effect of the altitude on the rainfall was previously described by other au-thors. For this reason and taking into account the topographic characteristics of Galicia, interpolation performed using alti-tude as external drift was more plausible than the one per-formed using distance to the shoreline.
Kriging and conditional simulation are geostatistical tech-niques that have the advantage of optimizing an
interpola-tion variable. Nevertheless, the aims of these techniques are different: kriging tries to minimize the estimate variance er-ror while conditional simulation tries to reproduce the spatial variability of the studied phenomenon.
Conditional simulation has been considered to be a method for optimizing kriging results. Some authors (Samper Cal-vete and Carrera Ram´ırez, 1996; Chil´es and Delfiner, 1999) suggested to combine conditional simulation results with those of kriging in order to achieve the advantage of know-ing the estimation uncertainty. In this study, GS provided a better description of the maximum and minimum rainfall values than that offered by other methods. Monthly rainfall mean values were higher than those recorded, what could be
approximate to the real values due to the irregular distribu-tion in altitude of the rain gauges used.
5 Conclusions
Structural analysis of the study data set showed that not a single model could be fitted to all of the experimental data sets, however, different models were fitted to 33 out of 48 data sets. Therefore, the fitted models depended on the pu-vliometric characteristics occurred in each month.
Inverse distance interpolation was the only method that could be used for mapping Galicia monthly rainfall in all the studied months. It offered discontinuous maps and proved to be appropriate for a rapid estimation of rainfall.
OK gave maps that showed similar patterns to those ob-tained by inverse distances but it provided estimation error maps as well. OK estimated maps were too smooth for re-producing original maximum and minimum data; moreover, kriging error maps tended to show a high and uniform uncer-tainty pattern.
KED offered reasonable results; however, drift approach seemed to be arbitrary. Rainfall spatial distributions and monthly rainfall mean values obtained by the two differ-ent KED approaches, usually, differed notably. Generally, when distance to the coast was used as secondary informa-tion, isohyets showed a notorious smoothing, thus, the maps were similar to those obtained by ordinary kriging. Tak-ing into account the topographic characteristics, interpolation performed using altitude as external drift was more plausible. Finally, GS gave average maps that seemed to fit very well to what occurred in reality. This technique reproduced monthly rainfal maximum and minimum values when nugget effect was nule or low; in contrast, when this nugget effect was high, maximum and minimum value oscillation ratio was lower than that registered at the gauges.
Taking into account that mountainous areas, with higher precipitations, are not well represented in the sample popula-tion, conditional simulation is supposed to offer more realis-tic results; nevertheless, this consideration must be confirmed with new measured data.
Acknowledgements. This study was financed by Xunta de Galicia
(Spain), project PGIDIT02REM16201PR. The authors thank the
Centro de Investigaciones Forestales de Louriz´an (Spain) and
the Centro Meteorol´ogico Territorial de Galicia of the Spanish Ministry of Environment and Energy for providing them with data for this study.
Edited by: S. C. Michaelides and E. Amitai Reviewed by: anonymous referees
References
Burgess, I. and Webster, R.: Optimal interpolation and isarithmic mapping of soil properties. I: The semivariogram and punctual
kriging, J. Soil Sci., 31, 315–331, 1980.
Burrough, P. A. and McDonnell, R. A.: Principles of Geographi-cal Information Systems, Spatial Information Systems and Geo-statistics, Oxford University Press, 1998.
Carballeira, A., Devesa, C., Retuerto, R., Santill´an, E., and Ucieda, F.: Bioclimatolog´ıa de Galicia (in Spanish), Fundaci´on Pedro Barri´e de la Maza, Conde de Fenosa, A Coru˜na, Spain, 1983. Chil´es, J. P. and Delfiner, P.: Geostatistics. Modeling Spatial
Uncer-tainty, Wiley Series in Probability and Statistics, John Wiley and Sons, Inc. 1999.
De U˜na ´Alvarez, E.: El clima (in Spanish), in: Atlas de Galicia. Tomo 1: Medio Natural, edited by: Precedo Ledo, A. and San-cho Com´ıns, J., Sociedade para o Desenvolvemento Comarcal de Galicia, Xunta de Galicia, Spain, 2001.
Deustch, C. and Journel, A. G.: GSLIB Geostatistical Handbook, Oxford University Press, 1992.
G´omez Hern´andez, J. J., Cassiraga, E. F., Guardiola Albert, C., and ´
Alvarez Rodr´ıguez, J.: Incorporating information from a digital elevation model for improving the areal estimation of rainfall, in: geoENV III – Geostatistics for Environmental Applications, Quantitative Geology and Geostatistics, edited by: Monestiez, P., Allard, D., and Kluwer, R. F., Kluwer Academy Publishers, 67–78, 2001.
Goovaerts, P.: Geostatistics for natural resources evaluation, Ap-plied Gesotatistcs Series, Oxford University Press, 1997. Goovaerts, P.: Geostatistical approaches for incorporating elevation
into the spatial interpolation of rainfall, J. Hydrol., 228, 113–129, 2000.
Militino, A. F., Palacios, M. B., and Ugarte, M. D.: Robust predic-tions of rainfall in Navarre, Spain, in: geoENV III – Geostatistics for Environmental Applications, Quantitative Geology and Geo-statistics, edited by: Monestiez, P., Allard, D., and Kluwer, R. F., Kluwer Academy Publishers, 79–90, 2001.
Mir´as Avalos, J. M.: Estimaci´on y simulaci´on de la precipitaci´on en Galicia a escala mensual (in Spanish), Ph D. Thesis, University of A Coru˜na, Spain, 2003.
Pebesma, E. J.: GSTAT User’s Manual, Dept. of Physical Geogra-phy, Utrecht University, 2000.
Samper Calvete, J. and Carrera Ram´ırez, J.: Geoestad´ıstica, Apli-caciones a la Hidrolog´ıa Subterr´anea (2nd edition) (in Span-ish), Centro Internacional de M´etodos Num´ericos en Ingenier´ıa, Barcelona, 1996.
Thonon, I. and Paz Gonz´alez, A.: A Geostatistically interpo-lated digital elevation model of Galicia (NorthWest Spain), in: GeoENV 2002, Fourth European Conference on Geostatistics for Environmental Applications, Kluwer Academy Publishers, 532– 533, 2004.
Van Deursen, W. P. A. and Wesseling, C. G.: The PCRaster Pack-age, Vakgroep Fysische Geografie, Faculteit Ruimtelijke Weten-schappen, Universiteit Utrecht, Utrecht (The Netherlands), 1992. Vieira, S. R.: Geoestat´ıstica em estudos de variabilidade espacial do solo (in Portuguese), in: T´opicos em Ciˆencia do Solo, edited by: Novais, R. F., Alvarez, V. H., and Schaefer, G. R., Vic¸osa: Sociedade Brasileira de Ciˆencia do Solo, 1, 1–54, 2000. Webster, R. and Oliver, M. A.: Geostatistics for Environmental
Sci-entists, Statistics in Practice Series, John Wiley & Sons Ltd., 2001.