HAL Id: hal-02763788
https://hal.inrae.fr/hal-02763788
Submitted on 4 Jun 2020
HAL is a multi-disciplinary open access
archive for the deposit and dissemination of sci-entific research documents, whether they are pub-lished or not. The documents may come from teaching and research institutions in France or abroad, or from public or private research centers.
L’archive ouverte pluridisciplinaire HAL, est destinée au dépôt et à la diffusion de documents scientifiques de niveau recherche, publiés ou non, émanant des établissements d’enseignement et de recherche français ou étrangers, des laboratoires publics ou privés.
Assessing the vertical distribution of leaf chlorophyll
content in a maize crop
Sophie Moulin, Frédéric Baret, N. Bruguier, C. Bataille
To cite this version:
Sophie Moulin, Frédéric Baret, N. Bruguier, C. Bataille. Assessing the vertical distribution of leaf chlorophyll content in a maize crop. IEEE international geoscience and remote sensing symposium, Jul 2003, Toulouse, France. �10.1109/IGARSS.2003.1294757�. �hal-02763788�
Assessing the Vertical Distribution of Leaf
Chlorophyll Content in a Maize Crop
S. Moulin, F. Baret, N. Bruguier and C. Bataille
INRA - Unité Climat, Sol, et Environnement (CSE) Bât. Climat - Site Agroparc - Domaine Saint-Paul,
84 914 Avignon cedex 9 , France
Abstract— The characterization of the vertical distribution in a maize crop was investigated. Chlorophyll content measurements were performed on each leaf of several plants along the crop cycle. Those measurements, as well as the surface measurements and the leaf insertion height measurements give the vertical distribution of chlorophyll pigments within the canopy. The chlorophyll content is higher for the middle leaves than for the top and bottom leaves of the plant. The impact of chlorophyll vertical distribution on the leaf reflectance response was investigated. For this purpose, the PROSPECT model was applied on multiple layers, reproducing the observed chlorophyll profile.
Keywords- chlorophyll vertical distribution; reflectance
I. INTRODUCTION
The vertical distribution of the chlorophyll in a plant canopy is not uniform as shown through numerous measurements. This leads to bias in the chlorophyll content estimation both at leaf and canopy levels.
The objectives of the study were first to characterize the chlorophyll vertical distribution of a maize crop and second to evaluate the impact of the non-uniform distribution on the leaf spectral response. Results are presented with emphasis the interest of characterizing the chlorophyll distribution along the crop development.
II. MATERIALANDMETHOD
A. Field experiment
In the frame of the CHRIS/PROBA project, which aims at improving the biophysical variables retrieval thanks to hyperspectral measurements, an experiment was conducted. The study field was sown in maize on 20th April 2002 in South
of France. On the field, a surface of 50m x 50m was chosen for the experiment, with 3 sites. On each site, measurements were performed on 4 plants, from crop emergence to crop yield, every 3 weeks. The leaves were identified by apparition order. Each leaf was characterized by its length, width, height of insertion and chlorophyll content. To characterize the leaf chlorophyll content (Cab), a SPAD-502 chlorophyll-meter was used (Minolta). The measurements were performed in the centre of the leaf avoiding the main vein.
We split the data set in 3, corresponding to 3 leaf layers from the bottom to the top. Insertion height between 20 to 100 cm, 100 to 180 cm and 180 to 260 cm, corresponded to layers 1, 2
and 3, respectively. For DoY 225, the SPAD values were averaged in the 3 layers (Table 1).
TABLE I. SPAD, CABLAND SLVALUESFOR DOY 225 WHENAVERAGING VALUESOFEVERYLEAFLAYERS
Mean SPAD value Mean Cabl value (µg/cm²) Mean Sl value (cm²) Layer 1 (bottom) 52 63.6 520 Layer 2 (middle) 55 70.2 730 Layer 3 (top) 48 55.4 370 B. Method
The leaf surface (Sl) was evaluated from the measured length
(Ll) and width (Wl). An empirical relationship was established
by [1] on maize crop. For each leaf, the surface was computed as follow :
Sl = Ll x Wl x 0.75 (1)
The chlorophyll content of the leaves was computed from SPAD measurements. [2] have established an empirical relationship calibrated with colorimetry measurements. The proposed relation was:
SPAD x Cab 265 . 0 10 09 . 0 = (2)
The PROSPECT model was used to describe the radiative transfer in the leaf and simulate the leaf reflectance and transmittance [3]. This model assumes that the leaf is built up with (N) elementary layers separated by air. Each layer is characterized by a refraction index (n) and an absorption coefficient K(λ). The absorption coefficient is computed from the leaf concentration in chlorophyll (Cab), carotenoids (Cc),
dry matter (Cdm) and water (Cw). The set of PROSPECT input
parameters are Xv={N, Cc, Cw, Cab, Cdm}. N, Cc, Cdm and Cw
were set to standard values, as we were especially interested in the impact of a variation in Cab.
III. RESULTS
C. Vertical distribution of Cab
Fig. 1 shows, for a given date, the distribution of SPAD measurements versus leaf height when gathering the measurements coming from the 4 plants of the 3 sites. On DoY (day of year) 225, which corresponds to 13th August, the
crop is fully developed. The SPAD values are ranged from 30 to 70, corresponding to 26 µg/cm² and 97 µg/cm² according to (2), respectively. We noticed that the chlorophyll content reaches a maximum value for leaves located at about 140 cm from the ground, which corresponds to the region of the ear. The same kind of results was obtained for any date: The maximum value of chlorophyll was obtained for leaves of the middle layer. DOY 225 y = -0,0009x2 + 0,2171x + 42,324 R2 = 0,3026 0 10 20 30 40 50 60 70 80 0 100 200 300 leaf height (c m)
1 SPAD units versus leaf insertion height
D. Vertical distribution of leaves surfaces
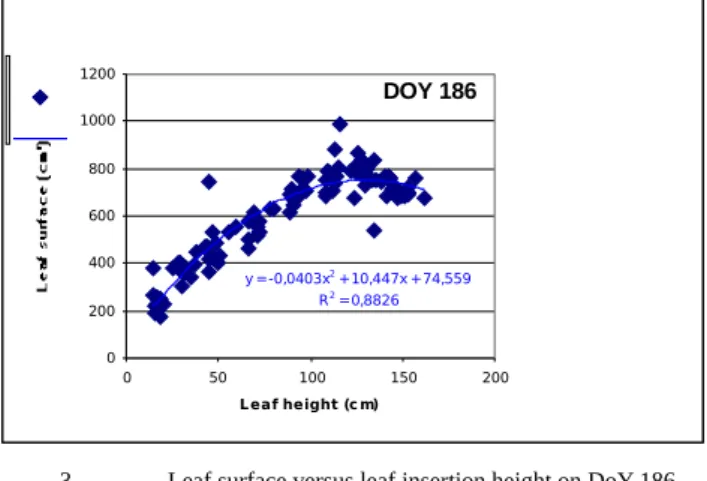
For every date, the surface of the leaves was plotted depending on their insertion height for the 12 plants. Fig. 2 shows a linear relationship between the surface and the leaf height on DoY 170 (19 June), which corresponds to the growing period (before the apparition of the ear). Later, the first leaves (located at the top of the plant) stop growing: The distribution shown on fig. 3 was obtained on DoY 186 (5 July). From DoY 199 (18 July), the distribution remained the same, except that the leaves of the bottom progressively disappear when senescing (DoY 255). The bigger leaves are located in the middle layer since flowering.
DO Y 170 y = 12,11x + 70,392 R2 = 0,91 0 100 200 300 400 500 600 700 800 900 1000 0 20 40 60 80 Leaf height (c m)
2 Leaf surface versus leaf insertion height on DoY 170
DOY 186 y = -0,0403x2 + 10,447x + 74,559 R2 = 0,8826 0 200 400 600 800 1000 1200 0 50 100 150 200 Leaf height (c m)
3 Leaf surface versus leaf insertion height on DoY 186
DOY 199 y = -0,0473x2 + 12,419x - 71,645 R2 = 0,8978 0 200 400 600 800 1000 1200 0 100 200 300 Leaf height (c m)
4 Leaf surface versus leaf insertion height on DoY 199
E. Vertical distribution of leaf reflectances
PROSPECT was run to simulate leaf reflectances of the 3 leaf layers defined for DoY 225. For each layer, the Cab value used as input was reported in Table 1. The resulting reflectance spectra were plotted on Fig. 5. The curves show similar general patterns for the 3 layers. However, reflectances in the visible range were significantly different depending on the vertical position of the leaf in the canopy. The spectrum related to the middle layer show a strong absorption due to the bigger amount in chlorophyll content, whereas the top layer has the higher visible reflectances. We also noticed slight differences between the 3 layers responses in the red-edge spectral region (0.68µm 0.76µm): the transition between visible and near infrared is translated to the left when Cab decreases.
5 Leaf reflectance profiles simulated with PROSPECT for 3 layers on DoY 225.
IV. DISCUSSION - CONCLUSION
Through this study, it was shown that the highest chlorophyll concentration is located in the middle leaves. These results
confirmed the work performed by [4] on sugar beet. In the case of maize, this is mainly due to highest leaves surfaces for layer-2. When computing the bulk chlorophyll concentration through gLAI and Cab product, layer with small leaves yield to smaller bulk chlorophyll concentrations. This suggests that most of the photosynthetically active radiation is absorbed in this part of the canopy. Using vertical chlorophyll profiles to simulate the radiometric response of a crop is a way to improve the accuracy in crop characteristics estimation.
REFERENCES
[1] Ruget F., Bonhomme R. and Chartier, M., 1996, Estimation simple de la surface foliaire de plantes de maÏs en croissance, Agronomie, 553-562. [2] Markwell, J., J.C. Osterman, and J.C. Mitchell. 1995. Calibration of the
Minolta SPAD-502 leaf chlorophyll meter. Photosynthesis Research 46:467-472.
[3] Jacquemoud S. and Baret F., 1990, PROSPECT : a model of leaf properties, Remote Sens. Environ., 34:75-91.
[4] Eastwood J.A., 1993, The effect of canopy chlorosis distributions on vegetation spectral signature, Ph. D. thesis, University of Nottingham, 253pp.