ION CHANNELS, RECEPTORS AND TRANSPORTERS
The phosphate transporter NaPi-IIa determines the rapid renal
adaptation to dietary phosphate intake in mouse irrespective
of persistently high FGF23 levels
Soline Bourgeois&Paola Capuano&Gerti Stange&
Reto Mühlemann&Heini Murer&Jürg Biber&
Carsten A. Wagner
Received: 26 July 2012 / Revised: 3 May 2013 / Accepted: 13 May 2013 / Published online: 26 May 2013 # Springer-Verlag Berlin Heidelberg 2013
Abstract Renal reabsorption of inorganic phosphate (Pi) is mediated by the phosphate transporters NaPi-IIa, NaPi-IIc, and Pit-2 in the proximal tubule brush border membrane (BBM). Dietary Pi intake regulates these transporters; however, the contribution of the specific isoforms to the rapid and slow phase is not fully clarified. Moreover, the regulation of PTH and FGF23, two major phosphaturic hormones, during the adaptive phase has not been correlated. C57/BL6 and
NaPi-IIa−/−mice received 5 days either 1.2 % (HPD) or 0.1 % (LPD)
Pi-containing diets. Thereafter, some mice were acutely switched to LPD or HPD. Plasma Pi concentrations were similar under chronic diets, but lower when mice were acutely switched to LPD. Urinary Pi excretion was similar in C57/BL6
and NaPi-IIa−/−mice under HPD. During chronic LPD,
NaPi-IIa−/− mice lost phosphate in urine compensated by higher
intestinal Pi absorption. During the acute HPD-to-LPD switch,
NaPi-IIa−/− mice exhibited a delayed decrease in urinary Pi
excretion. PTH was acutely regulated by low dietary Pi intake. FGF23 did not respond to low Pi intake within 8 h whereas the
phospho-adaptator protein FRS2α necessary for FGF-receptor
cell signaling was downregulated. BBM Pi transport activity and NaPi-IIa but not NaPi-IIc and Pit-2 abundance acutely
adapted to diets in C57/BL6 mice. In NaPi-IIa−/−, Pi transport
activity was low and did not adapt. Thus, NaPi-IIa mediates the fast adaptation to Pi intake and is upregulated during the adaptation to low Pi despite persistently high FGF23 levels. The sensitivity to FGF23 may be regulated by adapting FRS2α abundance and phosphorylation.
Keywords Phosphate adaption . Proximal tubule . Brush border membrane . FGF23 . PTH
Introduction
In mammals, including humans, plasma concentration of inorganic phosphate (Pi) is determined by intestinal intake, excretion via feces, distribution between bone and soft tis-sues, and renal excretion and reabsorption, respectively (for
review: [12, 38, 40]). The latter mechanism is of major
importance for whole-body Pi homeostasis and therefore tightly controlled. Reabsorption of filtered Pi by the kidneys
occurs mostly in the proximal tubule [12, 38, 40]. In the
brush border membrane (BBM), three transporters have been identified so far: NaPi-IIa (SLC34A1) and NaPi-IIc (SLC34A3), two transporters from the NaPi/SLC34 family,
and, more recently, Pit-2 (SLC20A2) [12, 38, 49, 59].
However, these transporters have distinct transport proper-ties with respect to ion coupling, preferred species of
phos-phate, voltage sensitivity, and pH dependence [12, 38,46,
49,60]. NaPi-IIa and Pit-2 mediate the electrogenic transport
of inorganic phosphate coupled to three and two sodium ions, respectively, whereas NaPi-IIc transports inorganic phosphate together with two sodium ions in an electroneutral fashion. Moreover, NaPi-IIa and NaPi-IIc prefer divalent inorganic
phosphate (HPO42−). In contrast, Pit transporters
preferential-ly transport monovalent phosphate (H2PO4−) [12,38,46,60].
Renal phosphate reabsorption is regulated by many factors including parathyroid hormone (PTH), dopamine, dietary
phos-phate intake, glucocorticoids, vitamin D3, acid–base status,
growth factors, insulin, sFRP4, and FGF23 [4–6,11,12,17,
35,39,42,44]. NaPi-IIa abundance in the brush border
mem-brane is controlled by parathyroid hormone, FGF23, and
die-tary Pi intake [8,12,29]. In rat, mouse, and rabbit, NaPi-IIa is
upregulated by low Pi diet and decreased by high Pi intake both S. Bourgeois
:
P. Capuano:
G. Stange:
R. Mühlemann:
H. Murer
:
J. Biber:
C. A. Wagner (*)Institute of Physiology and Zurich Center for Integrative Human Physiology (ZIHP), University of Zürich, Winterthurerstrasse 190, CH-8057 Zurich, Switzerland
e-mail: [email protected] DOI 10.1007/s00424-013-1298-9
acutely and chronically [16,17,29,57]. This regulation occurs essentially by trafficking of the protein, lysosomal
degrada-tion, recruitment of newly synthesized transporters [5,26,29,
30] and may also include transcriptional regulation [34].
Much less is known about the regulation of NaPi-IIc being regulated also by PTH, FGF23, and Pi intake with a slower change in brush border membrane abundance upon high Pi
intake or PTH application [8,28,43,44]. Similarly, Pit-2 is
regulated by PTH and dietary Pi or potassium intake but no
further regulators have been identified to date [15,44,59].
The relative contribution of NaPi-IIa to the adaptive re-sponse of the kidney to acute and chronic changes in dietary phosphate intake remains to be clarified. Therefore, we com-pared renal phosphate handling during acute and chronic adaptive changes in dietary phosphate intake between C57/BL6 mice and mice lacking NaPi-IIa. Our second aim was to correlate changes in renal phosphate handling in C57/BL6 mice with levels of the two major phosphaturic hormones PTH and FGF23 and their main cellular
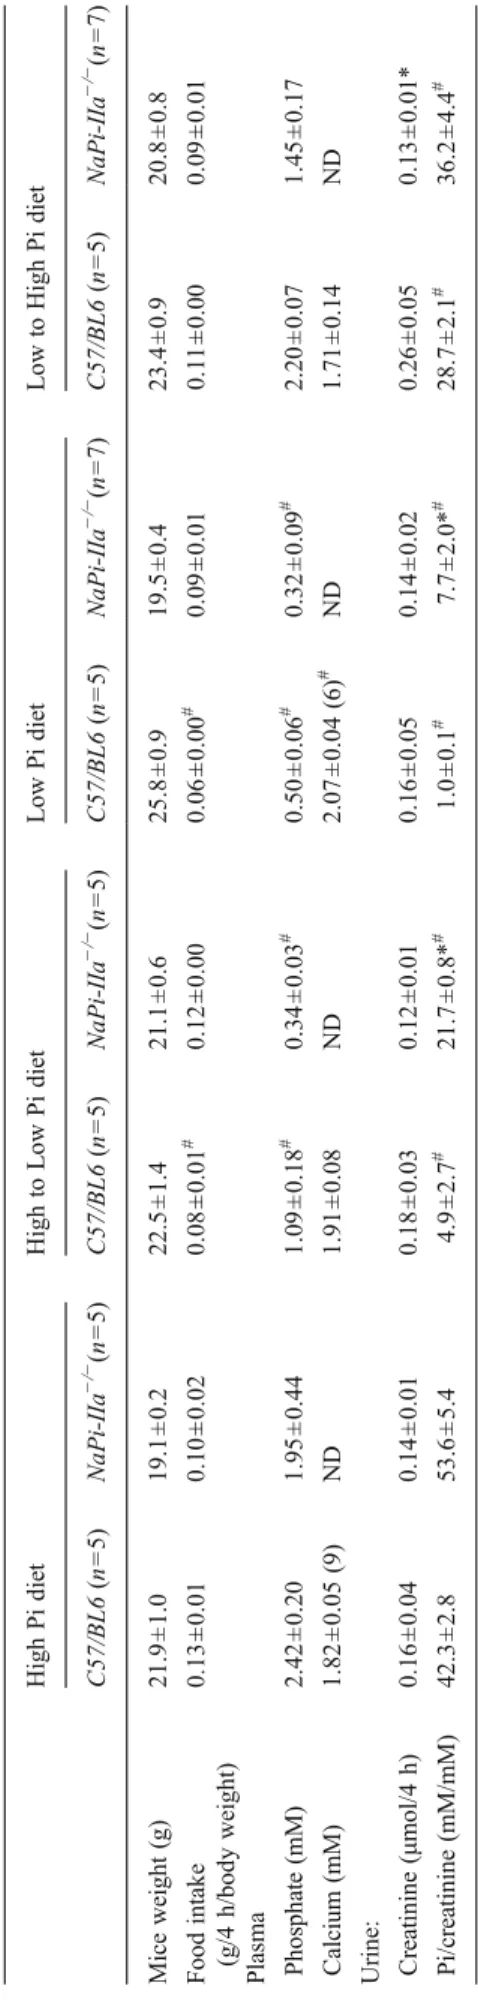
T able 1 Metabolic values in C57 BL6 and NaPi-IIa − /− during a 4-h period of feeding and collecting period with chronic and acute high and low phosphate diets (day 9) High Pi diet High to Low Pi diet Low Pi diet Low to High Pi diet C57/BL6 (n =5 ) NaPi-IIa − /− (n =5 ) C57/BL6 (n =5 ) NaPi-IIa − /− (n =5 ) C57/BL6 (n =5 ) NaPi-IIa − /− (n =7 ) C57/BL6 (n =5 ) NaPi-IIa − /− (n =7 ) Mice weight (g) 21.9 ± 1.0 19.1 ± 0.2 22.5 ± 1.4 21.1 ± 0.6 25.8 ± 0.9 19.5 ± 0.4 23.4 ± 0.9 20.8 ± 0.8 Food intake (g/4 h/body weight) 0.13 ± 0.01 0.10 ± 0.02 0.08 ± 0.01 # 0.12 ± 0.00 0.06 ± 0.00 # 0.09 ± 0.01 0.1 1 ± 0.00 0.09 ± 0.01 Plasma Phosphate (mM) 2.42 ± 0.20 1.95 ± 0.44 1.09 ± 0.18 # 0.34 ± 0.03 # 0.50 ± 0.06 # 0.32 ± 0.09 # 2.20 ± 0.07 1.45 ± 0.17 Calcium (mM) 1.82 ± 0.05 (9) ND 1.91 ± 0.08 ND 2.07 ± 0.04 (6) # ND 1.71 ± 0.14 ND Urine: Creatinine (μ mol/4 h) 0.16 ± 0.04 0.14 ± 0.01 0.18 ± 0.03 0.12 ± 0.01 0.16 ± 0.05 0.14 ± 0.02 0.26 ± 0.05 0.13 ± 0.01* Pi/creatinine (mM/mM) 42.3 ± 2.8 53.6 ± 5.4 4.9 ± 2.7 # 21.7 ± 0.8* # 1.0 ± 0.1 # 7.7 ± 2.0* # 28.7 ± 2.1 # 36.2 ± 4.4 # * p< 0.05 versus C57/BL6 under same diet; # p< 0.05 versus same genotype under High Pi diet HPD H/LPD LPD L/HPD 0 1 2 3
*
*
*
*
P lasma P i (mM ) HPD H/LPD LPD L/HPD 0 1 2 3*
*
*
P lasma P i (mM ) C57/BL6 NaPi-IIa KOa
b
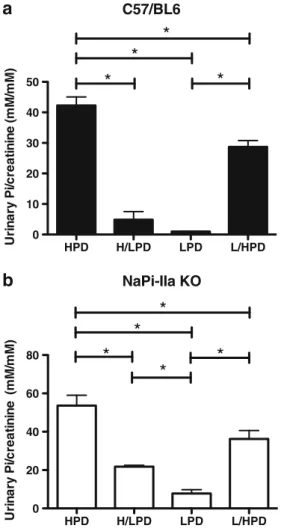
Fig. 1 Plasma phosphate levels during acute and chronic changes in dietary Pi. a Plasma Pi in C57/BL6 mice (n=5 mice/group). b Plasma Pi in NaPi-IIa−/−mice (n=5 to 7 mice/group). C57/BL6 and NaPi-IIa−/− mice were fed 4 h/day with high (HPD) or low Pi (LPD)-containing diets for 4 days. Some mice were switched on the last day from high to low (H/ LPD) or from low to high (L/HPD) Pi-containing diets. Both strains of mice were able to modulate their blood Pi during these dietary conditions. However, NaPi-IIa−/−mice more drastically decreased their bood Pi level during the acute H/LPD switch. *p<0.05
downstream effectors PTH receptor 1 and the FGF receptor
adaptor protein FRS2α.
Our results demonstrate a major role of NaPi-IIa during the acute phase of renal adaptation to low phosphate intake whereas during chronic low phosphate intake lack of NaPi-IIa is mostly compensated by enhanced intestinal phosphate absorption. PTH levels followed phosphate
intake whereas FGF23 responded more slowly to
switching from high to low phosphate intake and high FG23 levels persisted for more than 8 h. At the cellular level, low phosphate intake correlated with a reduction in the abundance of FRS2α, the major adaptor protein mediating the downstream signaling from the FGF1 receptor. NaPi-IIa membrane abundance increased dur-ing these 8 h despite high FGF23.
Methods Animals
All experiments were performed with 10–14-week-old
C57BL/6J and homozygous NaPi-IIa-deficient (Slc34a1−/−)
male mice bred in a pure C57/BL6 background [7]. The
generation, breeding, and genotyping of NaPi-IIa KO mice
have been described previously [7]. All experiments were
performed according to the Swiss Animal Welfare laws and approved by the local veterinary authority (Veterinäramt Zürich, autorisation no. 32/2009).
Metabolic studies
Mice were kept in standard cages for the first 4 days (days 1-4) and adapted to metabolic cages (Tecniplast, Buguggiate, Italy) by placing them in metabolic cages during the day and
in standard cages during the night. Days 5–9, mice were
housed in metabolic cages. Mice received standard rodent
chow (0.8 % Pi, 1.2 % Ca2+; Kliba NAFAG, Kaiseraugst,
Switzerland) during days 1–4 but were trained to receive
food only during 4 h in the morning (between 7 AM to 11 AM). On day 5, animals were subdivided into two
experimental groups. The first group received 0.1 % Pi
and 1.0 % Ca2+ diet and the second 1.2 % Pi and 1.0 %
Ca2+diet (Kliba; NAFAG, Kaiseraugst, Switzerland). Both
diets contained equal amounts of vitamin D (1,000 IU/kg). On day 7, 24-h urine and feces collections were performed in metabolic cages to assess chronic adaptation.
On day 9, half of each group was switched for 4 h in the morning to low or high Pi diets, respectively, and the follow-ing experimental groups were established: (1) chronic low Pi diet group (LPD) receiving only 0.1 % Pi diet; (2) acute high Pi diet (L/HPD): mice were fed 0.1 % Pi diet for 4 days and acutely switched to 1.1 % Pi diet for 4 h on the last day; (3) chronic high Pi diet group (HPD) receiving only 1.1 % Pi diet; (4) acute low Pi diet (H/LPD) mice were fed for 4 days 1.1 % Pi diet and were acutely switched on the last day to 0.1 % Pi diet for 4 h. Some mice received also only high or low Pi diets for 5 days with access to food over 24 h to assess the effects of timed feeding on overall adaption. Mice were sacrificed on day 9 and urine, blood, and kidneys were collected for acute
studies and stored at−80 °C for further analyses.
Urine, plasma, and feces analysis
Twenty-four-hour feces were solubilized overnight at 95 °C in 2 ml of 1.2 M nitric acid in a luer lock glass tube. Volumes were equalized with water to 4 ml in each sample and ions
were measured in the supernatant. Plasma, urine, and feces Pi
concentration was determined by the phosphomolybdate
method [23] and urinary creatinine by a modified kinetic
HPD H/LPD LPD L/HPD 0 10 20 30 40 50
*
*
*
*
U rina ry P i/c re a tinine (m M /m M ) HPD H/LPD LPD L/HPD 0 20 40 60 80*
*
*
*
*
Uri n ary P i/ creat in in e (m M /mM ) C57/BL6 NaPi-IIa KOa
b
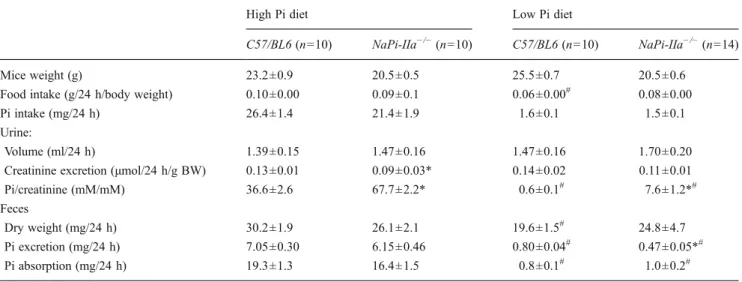
Fig. 2 Urine Pi excretion during chronic and acute changes in dietary Pi. a Urinary Pi in C57/BL6 mice (n=4 to 6 mice/group). b Urinary Pi in NaPi-IIa−/−mice (n=5 to 7 mice/group) . C57/BL6 mice and NaPi-IIa−/− mice were fed 4 h/day with high (HPD) or low Pi (LPD)-containing diets for 4 days. Some mice were switched on the last day from high to low (H/ LPD) or from low to high (L/HPD) Pi-containing diets. Both strains of mice were able to modulate their urinary Pi excretion during these dietary conditions. However, NaPi-IIa−/−mice lost more Pi into urine compared to C57/BL6 mice whatever the diet. *p<0.05
Jaffé colorimetric method [52]. PTH 1–84 and FGF23 plasma levels were measured with ELISA assays specific for mouse PTH 1–84 and mouse C-terminal FGF23 (Immunotopics, San Clemente, CA).
RNA extraction, reverse transcription, and semi-quantitative real-time PCR
Kidneys were harvested and rapidly frozen in liquid nitro-gen. Snap-frozen kidneys (five to seven kidneys for each condition) were homogenized in RLT-Buffer (Qiagen,
Basel, Switzerland) supplemented with β-mercaptoethanol
to a final concentration of 1 %. RNA extraction, reverse Table 2 Metabolic values in C57BL6 and NaPi-IIa−/−during 4-h feeding/day and 24-h collecting period with chronic high and low phosphate diets (day 8)
High Pi diet Low Pi diet
C57/BL6 (n=10) NaPi-IIa−/−(n=10) C57/BL6 (n=10) NaPi-IIa−/−(n=14)
Mice weight (g) 23.2±0.9 20.5±0.5 25.5±0.7 20.5±0.6
Food intake (g/24 h/body weight) 0.10±0.00 0.09±0.1 0.06±0.00# 0.08±0.00
Pi intake (mg/24 h) 26.4±1.4 21.4±1.9 1.6±0.1 1.5±0.1
Urine:
Volume (ml/24 h) 1.39±0.15 1.47±0.16 1.47±0.16 1.70±0.20
Creatinine excretion (μmol/24 h/g BW) 0.13±0.01 0.09±0.03* 0.14±0.02 0.11±0.01 Pi/creatinine (mM/mM) 36.6±2.6 67.7±2.2* 0.6±0.1# 7.6±1.2*# Feces
Dry weight (mg/24 h) 30.2±1.9 26.1±2.1 19.6±1.5# 24.8±4.7
Pi excretion (mg/24 h) 7.05±0.30 6.15±0.46 0.80±0.04# 0.47±0.05*# Pi absorption (mg/24 h) 19.3±1.3 16.4±1.5 0.8±0.1# 1.0±0.2# *p<0.05 versus C57/BL6 under same diet,#p<0.05 versus same genotype under high Pi diet
HPD H/LPD LPD L/HPD 0 1000 2000 3000 4000 5000 pm ol 32 P /m g pr ot e in/m in HPD H/LPD LPD L/HPD 0 1000 2000 3000 4000 5000 pm ol 32P /m g pr ot e in/m in * * * C57/BL6 NaPi-IIa KO
a
b
Fig. 4 Brush border membrane (BBM) sodium-dependent phosphate (NaPi) transport activity in C57/BL6 and NaPi-IIa−/− mice. Sodium-dependent32P-uptake was determined in BBMV from C57/BL6 and NaPi-IIa−/−mice during acute and chronic phosphate diets. a BBMV prepared from C57/BL6 mice demonstrated that dietary phosphate intake modulates Na+-dependent Pi cotransport activity acutely and chronically. b In contrast, in BBMV prepared from NaPi-IIa−/−mice Na+-dependent Pi cotransport activity was always lower than in C57/BL6 mice and did not show any regulation. n=5 to 7 mice/group, *p<0.05
HPD HPD LPD LPD 0.0 0.5 1.0 1.5 2.0 15 20 25 C57/BL6 NaPi-IIa KO * In test in al P i ab so rp ti o n ( m g /24h rs )
Fig. 3 Intestinal Pi absorption in C57/BL6 and NaPi-IIa−/−mice during high and low Pi diets. Pi excretion was determined in feces from 4 h/day feeding mice treated with chronic high (HPD) or low (LPD) Pi diets for 4 days. Pi absorption was estimated from the total daily amount of Pi consumption minus the daily Pi excretion in 24-h fecal collections on the last day. P<0.05, n=10 to 13 mice/group. NaPi-IIa−/−mice increased Pi absorption compared to C57/B6 mice during LPD
transcription, and semi-quantitative real-time PCR were
performed as described previously [42].
Brush border membrane vesicle preparation and phosphate uptake experiments
Brush border membranes vesicles (BBMV) were
pre-pared from total frozen kidneys using the Mg2+
precip-itation technique as described previously [13, 14]. The
phosphate transport rate into BBMV was measured in freshly prepared BBMV at 25 °C in the presence of inward gradients of 100 mM NaCl or 100 mM KCl
and 0.1 mM K-phosphate. The substrate Piwas made with
0.125 mM K2HPO4and32P (1μCi/ml) to give a final
con-centration 0.1 mM close to the expected apparent KmPi for
Na+-dependent transport in renal BBMV. The stop solution
contained 100 mM Mannitol, 5 mM Tris–HCl pH 7.4,
150 mM NaCl, 5 mM Pi. Na+dependence was established by
incubating BBMV in solutions in which KCl replaced NaCl equimolarly. Phosphate uptake was determined after 60 s, representing initial linear conditions, and after 120 min, to determine the equilibrium values. Total protein concentration
was measured using the Bio-Rad Protein Assay kit, Bio-Rad,
Hercules, CA, USA. Remaining BBMV were stored at−80 °C
until further use. Immunoblotting
Fifteen to twenty micrograms of renal brush border membrane
proteins or 50 μg of kidney homogenates were solubilized in
Laemmli loading buffer containing DTT (2 mM) and separated on 8 % polyacrylamide gels. Coomassie blue-stained polyacryl-amide gels were used to control equality of protein loading for
each series [45]. For immunoblotting, the proteins were
trans-ferred electrophoretically to polyvinylidene fluoride membranes (Immobilon-P, Millipore Corp., Bedford, MA, USA). After blocking with 5 % milk powder in Tris-buffered saline for 60 min, the blots were incubated with the primary antibodies:
rabbit polyclonal anti-NaPi-IIa (1:4,000) [19], rabbit polyclonal
anti-NaPi-IIc (1:5,000) [42], rabbit polyclonal anti-Pit-2
(1:3,000; kind gift from V. Sorribas, University of Zaragossa,
Spain) [59], rabbit polyclonal anti-parathyroid hormone receptor
(1:1,000; Covance, NJ, USA), rabbit polyclonal anti-phospho-FRS2α (1:2,000; Cell Signaling, MA, USA), mouse monoclonal
HPD LPD 0.0 0.5 1.0 1.5 2 (C tHP RT -C tPit2 ) HPD LPD 0.0 0.5 1.0 1.5 2 (C tHP RT -C tPit2 ) HPD H/LPD LPD L/HPD 0 100 200 300 400 500 * * 2 ( Ct HP R T -C tNa P iI Ia ) HPD H/LPD LPD L/HPD 0.0 0.2 0.4 0.6 0.8 1.0 * * 2 (C tHP RT -C tNa P iIIc ) HPD H/LPD LPD L/HPD 0.0 0.2 0.4 0.6 0.8 1.0 2 (C tHP RT -C tNa P iI Ic ) C57/BL6 NaPi-IIa KO Pit-2 NaPi-IIc NaPi-IIa
a
b
c
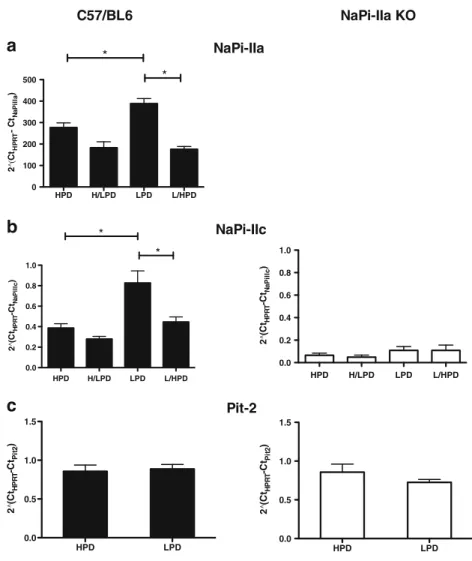
Fig. 5 Dietary phosphate intake regulates NaPi-IIa and NaPi-IIc transcripts but not Pit-2 mRNA. Real-time PCR was used to assess IIa, NaPi-IIc, and Pit-2 mRNA levels in total kidneys from C57/BL6 and NaPi-IIa−/−mice. a NaPi-IIa mRNA levels were modulated by dietary Pi intake. b NaPi-IIc mRNA level was modulated in C57/BL6 kidneys except during H/LPD but was very low and did not adapt to dietary phosphate intake in NaPi-IIa−/−kidneys. c Pit-2 mRNA level was not regulated by chronic dietary phosphate intake in both C57/BL6 and NaPi-IIa−/−mice. n=4 to 8 mice/group. *p<0.05
anti-FRS2α (1:1,500; R&D Systems, MI, USA), and mouse
monoclonal anti β-actin 1:25,000 (Sigma Aldrich, Buchs,
Switzerland) overnight at 4 °C. After washing, membranes were then incubated for 1 h at room temperature with secondary goat anti-rabbit antibodies 1:5,000 linked to alkaline phospha-tase (Promega, Madison, WI, USA) or HRP 1:10,000 (Amersham Life Science, Little Chalfont Buckinghamshire, UK). The protein signal was detected with the appropriate substrates (Millipore Corp, Bedford, MA, USA) using the
DIANA III-chemiluminescence detection system (Raytest, Straubenhardt, Germany). All images were analyzed using the software Advanced Image Data Analyser AIDA (Raytest, Straubenhardt, Germany).
Immunohistochemistry
Mouse kidneys were perfusion fixed through the right ventricle with a 4 % paraformaldehyde fixative/PBS solution and the subsequent immunohistochemistry was performed as
described previously [5]. Slices of fixed kidneys were frozen in
liquid propane and cooled with liquid nitrogen. Serial sections,
5 μm thick, were cut at −22 °C on a cryomicrotome (Leica,
Solms, Germany), mounted on superfrost slides, thawed, and kept in cold PBS until use. Before immunofluorescence staining, sections were pretreated with blocking solution (bo-vine serum albumin 1 % in PBS) for 60 min. After blocking, serial sections were incubated overnight at 4 °C either with a
rabbit anti-rat NaPi-IIa [19] diluted 1:1,000 or with an
immunopurified rabbit anti-mouse NaPi-IIc [42] diluted
1:1,500 or a rabbit anti-rat Pit-2 [59] diluted 1:300. All primary
antibodies were diluted in PBS with 1 % bovine serum albu-min. Sections were then rinsed three times with PBS and covered for 1 h at 4 °C with the secondary antibodies: Alexa
Fluor 555 goat–anti-rabbit IgG (1:500, Invitrogen), FITC–
phalloidin (1:100, Invitrogen ), and
4,6-diamidino-2-phenylindole (DAPI; Sigma, St. Louis, MO; dilution 1:1,000). Finally, the sections were rinsed three times with PBS, coverslipped using Glycergel Mounting Medium (Dako AG, Baar, Schweiz).
Statistical analysis
Results are expressed as mean ± SEM. All data were tested for significance using ANOVA and unpaired Student’s test where appropriate. Only values with p<0.05 were consid-ered as significant.
Results
Adaption of plasma Pi concentration, urinary Pi excretion, and intestinal Pi reabsorption during chronic low and high phosphate diets
Results from plasma Pi determinations in C57/BL6 and
NaPi-IIa−/−mice after 5-day chronic low or high phosphate diet are
shown in Table 1 and Fig. 1. Both mouse strains exhibited
similar plasma Pi concentrations depending on diets; high plasma Pi concentrations during HPD (2.42±0.20 and 1.95± 0.44 mM) and lower plasma Pi concentrations on LPD (0.50± 0.06 and 0.32±0.09 mM). Nevertheless, after 4 days of chronic
diets, C57/BL6 and NaPi-IIa−/− mice had different 24-h Pi
HPD LPD 0 500 1000 1500 * %o f H P D HPD LPD 0 500 1000 1500 * %o f H P D HPD LPD 0 50 100 150 200 250 * %o f H P D 75 kDa 75 kDa 100 kDa NaPi-IIa NaPi-IIc Pit-2 NaPi-IIa NaPi-IIc Pit-2 C57/BL6
a
b
c
d
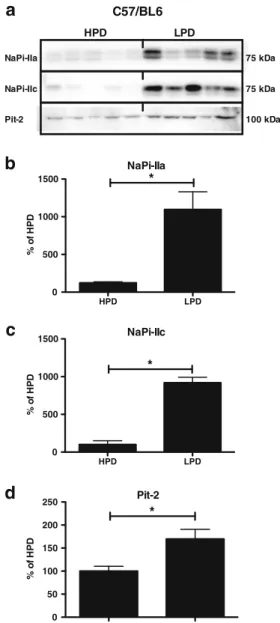
HPD LPDFig. 6 Brush border membrane abundance of NaPi-IIa, NaPi-IIc, and Pit-2 adapts to continuous chronic dietary phosphate intake in C57/ BL6 mice. Brush border membranes were prepared from mice kept over 24 h on high or low phosphate diets for 5 days. a Representative immunoblottings for NaPi-IIa, NaPi-IIc, and Pit-2. All blots were normalized against total protein amount stained on parallel Coomassie blue gels (see Methods sections). b–d Bar graphs summa-rizing data from immunoblottings showing mean±SEM (n=5 mice/ group). All data were normalized to the HPD (set as 100 %). BBM NaPi-IIa, NaPi-IIc, and Pit-2 protein abundance was significantly higher during chronic LPD. *p<0.05
HPD H/LPD LPD L/HPD 0 300 600 900
*
*
*
P ixel In ten si ty in % o f H P D mean HPD H/LPD LPD L/HPD 0 50 100 150 200 250*
%o f H P D HPD H/LPD LPD L/HPD 0 50 100 150 %o f H P D 75 kDa 75 kDa 100 kDa NaPi-IIa NaPi-IIc Pit-2C 5 7 /B L 6
NaPi-IIa
NaPi-IIc
Pit-2
a
b
c
d
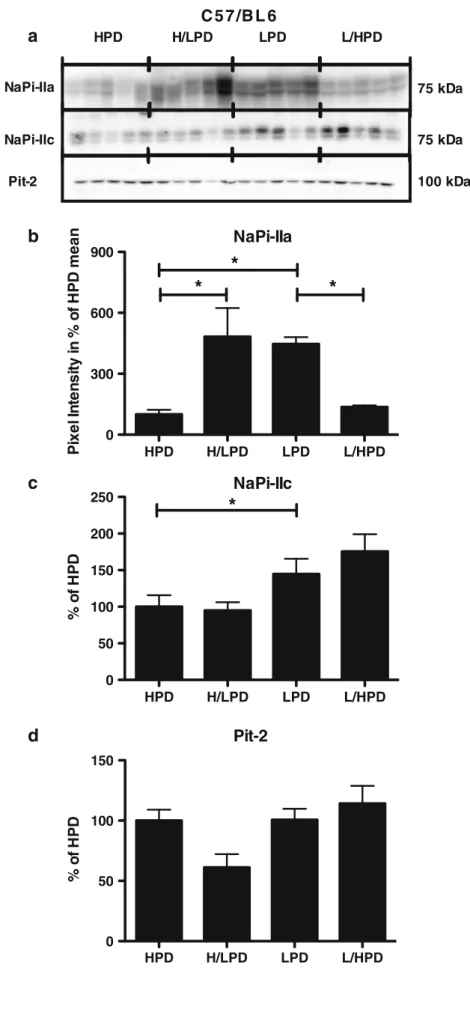
HPD H/LPD LPD L/HPDFig. 7 Rapid adaptation of NaPi-IIa brush border membrane abundance during 4-h feeding acute and chronic phosphate in C57/BL6 mice. Brush border membranes were prepared from mice receiving only for 4 h/day high (HPD) or low (LPD) phosphate diets for 4 days. Some mice were switched on the last day from high to low phosphate (H/LPD) or from low to high phosphate diet (L/HPD). a Representative immunoblottings for NaPi-IIa, NaPi-IIc, and Pit-2 during acute phosphate diets. All blots were normalized against total protein amount stained on Coomassie blue gels (see Methods sections). b–d Bar graphs summarizing data from immunoblotting showing mean±SEM (n=5 mice/group). All data were normalized to the HPD (set as 100 %). Only NaPi-IIa BBM expression was modulated by acute phosphate diets. NaPi-IIc protein abundance exhibited only a change between HPD and LPD and Pit-2 protein abundance, no significant change. *p<0.05
urinary excretion rates. NaPi-IIa−/−mice excreted more Pi with
the acute and chronic low Pi diets (Fig.2, Table1). This urinary
leak was partially compensated by an increase in intestinal Pi
absorption during LPD (Table2, Fig.3). We determined also
total plasma calcium levels and found significantly elevated plasma calcium in the group of mice receiving a chronic low Pi
diet (Table1). In the groups with acute changes of Pi intake, no
significant difference could be detected.
Plasma Pi concentration and urinary Pi excretion during acute switches in dietary Pi intake
Plasma and urine Pi concentrations were determined 4 h after switching diets. In C57/BL6 mice, switching from high to low Pi diet decreased plasma Pi concentration by 55 % whereas
NaPi-IIa−/−mice drastically reduced their plasma Pi concentration by
83 % (Fig. 1, Table 1). In contrast, no significant difference
between C57/BL6 and NaPi-IIa−/− was observed when mice
were switched from low to high Pi intake.
NaPi-IIa−/−mice excreted inappropriately high amounts of
phosphate not only during chronic dietary treatments but also during the acute switch. C57/BL6 mice rapidly adapted their Pi excretion when switched from high to low Pi intake,
whereas NaPi-IIa−/− mice failed reducing their Pi excretion
to the same level (89 % versus 59 % in NaPi-IIa−/−mice). This
discrepancy was not observed to the same extent when mice
were acutely adapted to high Pi diet (Fig.2, Table1).
Phosphate transport, NaPi-IIa, NaPi-IIc, and Pit-2 expression and trafficking during chronic and acute changes in dietary phosphate
In C57/BL6 mice, where NaPi-IIa, NaPi-IIc, and Pit-2 are
all expressed, Na+-dependent 32P uptake into BBMV
NaPi-IIa Actin DAPI HPD H/LPD LPD L/HPD NaPi-IIc Actin DAPI Pit-2 Actin DAPI
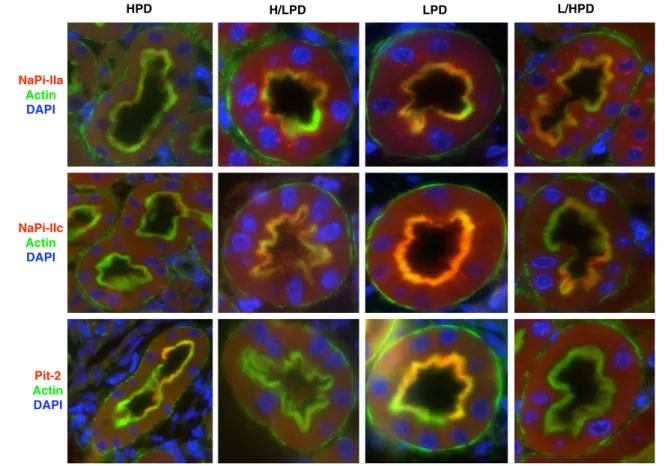
Fig. 8 Immunolocalization of NaPi-IIa, NaPi-IIc, and Pit-2 cotransporters in kidneys from C57/BL6 mice during acute and chronic changes in dietary phosphate intake. Kidney sections were prepared from mice receiving only for 4 h/day high (HPD) or low (LPD) phosphate diets for 4 days. Some mice were switched on the last day from high to low phosphate (H/LPD) or from low to high phosphate diet (L/HPD). All animals were fixed by perfusion 4 h after receiving the last diet. NaPi-IIa (a), NaPi-IIc (b), and Pit-2 (c) stainings are shown in red, the brush border membrane marked by labeling fo actin (green), nuclei are stained with DAPI (blue). Pictures were taken from
juxtamedullary S1 proximal tubule segments. Only NaPi-IIa staining was observed both at the plasma membrane and in intracellular organelles possibly representing Golgi apparatus. NaPi-IIc and Pit-2 were detected only at the plasma membrane. During LPD all three transporters were detected abun-dantly in the BBM (yellow overlay), whereas during HPD only weak staining was observed in the BBM. The H/LPD switch induced NaPi-IIa and NaPi-IIc staining in the BBM whereas Pit-2 was not detected. Similarly, the L/HPD showed reduced BBM localization of NaPi-IIa and NaPi-IIc and no detect-able signal for Pit-2. Original magnification ×40
was enhanced with LPD as expected. Na+-dependent 32P uptake was also acutely regulated following Pi intake
(Fig. 4a). In BBMV from NaPi-IIa−/− mice, uptake was
significantly lower in all four groups and not altered by
diet (Fig. 4b).
We performed real-time RT-PCR experiments on C57/BL6
tissue (Fig.5). NaPi-IIa and NaPi-IIc mRNAs abundance were
modulated chronically and acutely only under LPD to HPD. In contrast, we could not detect any regulation at the mRNA level
for Pit-2 (Fig.5). Moreover, in NaPi-IIa−/−tissue, no change in
NaPi-IIc or Pit-2 mRNA was observed whatever the diets
(Fig.5).
Next, we determined the abundance of IIa, NaPi-IIc, and Pit-2 proteins in the brush border membrane from C57/BL6 kidneys after 4- and 24-h feeding of high and low dietary phosphate. The expression of all three transporters
was significantly increased in kidney BBM from mice fed
24 h with low phosphate (Fig.6). However, when the mice
were acutely challenged with 4-h feeding dietary phosphate, only the abundance of NaPi-IIa was significantly modulated by acute dietary phosphate. NaPi-IIc and Pit-2 expression
remained unchanged (Fig.7).
The subcellular distribution of NaPi-IIa, NaPi-IIc, and Pit-2 proteins was further investigated by immunohisto-chemistry on kidney sections from C57/BL6 mice fed 4 h with the different regimens. As already demonstrated
previ-ously in rat kidney [48], NaPi-IIa can be found both at the
plasma membrane and in intracellular compartments during all diets, however, with different distribution along the nephron axis (data not shown). During HPD, NaPi-IIa-related staining was weak in the brush border membrane but rather diffusively expressed in the cytoplasm. Some intracellular organelles were highly stained that may repre-sent the Golgi apparatus. In contrast, during LPD, NaPi-IIa was highly expressed at the brush border membrane but was only weakly detected in the cytoplasm and remained visible in intracellular organelles. NaPi-IIc and Pit-2 proteins were exclusively detected at the brush border membrane but their intensity of staining changed with dietary phosphate intake
being low during HPD and high during LPD (Fig.8).
PTH and FGF23 change with different kinetics to dietary phosphate intake
Plasma PTH and FGF23 are both modulated by dietary
phos-phate [8, 47]. Here, we determined plasma PTH and
FGF23 levels in C57/BL6 mice under the various die-tary conditions in order to correlate hormone levels with urinary Pi excretion and renal expression of phosphate transporters. PTH followed dietary phosphate intake in-creasing with high phosphate and dein-creasing with low phos-phate intake and these changes were achieved within the 4 h
after switching diets (Fig. 9 and Table 3). In contrast, the
abundance of the PTH receptor 1 in kidney BBM remained
unaltered during the acute and chronic switches (Fig. 10). In
contrast, FGF23 showed a tendency to be lower with chronic low Pi intake compared to chronic high Pi intake and responded only to the acute switch from low to high phosphate but not to
the high to low switch (Fig.9 and Table3). In order to test
whether circulating FGF23 acted in the kidney, we examined the total amount of the FGF adaptor protein FRS2α and its phosphorylated active form p-FRS2α. p-FRS2α mediates the
HPD H/LPD LPD L/HPD 0 500 1000 1500
*
*
*
P la s m a P T H 1 -8 4 (pg/m l) HPD H/LPD LPD L/HPD 0 200 400 600*
Pl a s m a F G F 2 3 (p g /m l) C57/BL6 C57/BL6a
b
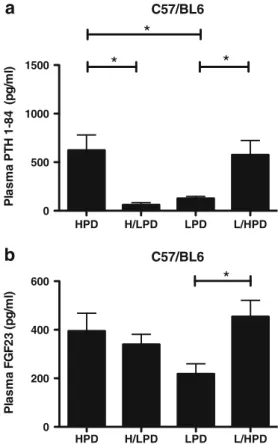
Fig. 9 Plasma PTH and FGF23 in C57/BL6 mice during acute and chronic high and low phosphate diets. Plasma PTH level was rapidly regulated by dietary phosphate within 4 h of switching while plasma FGF23 was signif-icantly modulated only when mice were switched from low to high phos-phate diet. *p<0.05 versus chronic diets (n=8 to 10 mice/group)
Table 3 PTH and FGF23 values in plasma from C57/BL6 mice during 4-h feeding chronic and acute high and low dietary phosphate
*p<0.05 versus chronic diet
High Pi diet High to Low Pi diet Low Pi diet Low to High Pi diet
(n=8) (n=10) (n=9) (n=9)
PTH (pg/ml) 623±156 61±23* 127±22 576±147*
down-stream signals from the FGF1 receptor upon stimulation
by the FGF23/klotho complex [27]. Total FRS2α followed
dietary phosphate intake increasing with a high phosphate diet
and decreasing during a low phosphate diet. p-FRS2α exhibited
also changes during chronic switches but had a slower response than FRS2α during the acute HPD to LPD switch and did not
acutely adapt during the LPD to HPD switch (Fig. 10)
suggesting reduced FGF23 signaling during acute low Pi intake despite elevated circulating FGF23.
Time course of regulatory mechanisms involved in the acute HPD to LPD switch
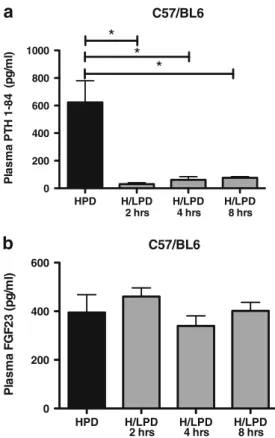
To better characterize the adaptive mechanisms involved in the acute HPD to LPD switch, we performed an additional time course experiment with four groups of WT mice adapted to high phosphate and acutely switched to low phosphate diet after 2, 4, and 8 h, respectively. Plasma PTH level was drastically reduced 2 h after switching to low phosphate while plasma
FGF23 level remained unchanged for at least 8 h (Fig.11and
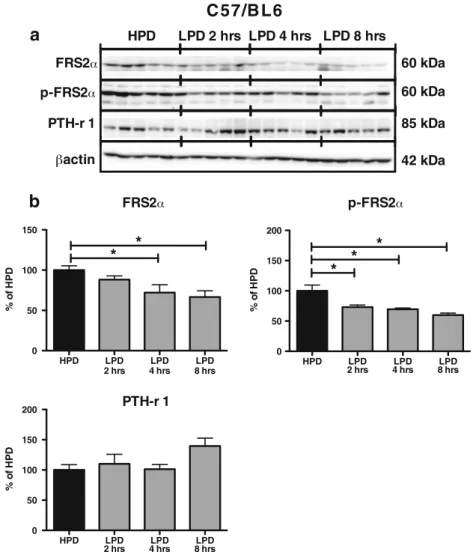
Table4). PTH receptor 1 exhibited no change while total
p-FRS2α and p-FRS2α decreased after 2 and 4 h, respectively of
HPD to LPD switch (Fig.12). Finally, NaPi-IIa expression in
the brush border of these animals gradually increased 4 h after
changing to low phosphate (Fig.13)
Discussion
The acute and chronic effects of dietary phosphate on phos-phate (Pi) transport in the proximal tubule have been studied
in great details [12,33,38,39]. Taken together, these studies
demonstrate that phosphate intake has a direct effect on kidney Pi transport and occurs acutely mainly by trafficking of transporters into or out of the brush border membrane and chronically also by transcriptional and translational
mecha-nisms [12, 33, 37]. In the kidney, three transporters have
been identified at the brush border membrane of proximal tubule cells, NaPi-IIa, NaPi-IIc, and Pit-2. In rodents, the modulation of their expression and function by dietary Pi had only been studied for NaPi-IIa in some details but little is known about the relative contribution and fast adaption of
NaPi-IIc and Pit-2 [29, 43,59]. Moreover, the correlation
with the regulation of the phosphaturic hormones PTH and HPD H/LPD LPD L/HPD 0 50 100 150 200 %o f H P D 85 kDa
C57/BL6
HPD H/LPD LPD L/HPDa
b
60 kDa 42 kDa 60 kDa HPD H/LPD LPD L/HPD 0 50 100 150 200*
*
*
%o f H P D HPD H/LPD LPD L/HPD 0 50 100 150*
*
*
%o f H P D FRS2 p-FRS2 PTH-r 1 PTH-r 1 actin p-FRS2 FRS2 Fig. 10 FRS2α and p-FRS2αadapt to dietary phosphate intake whereas the PTH receptor 1 is not altered. Brush border membranes and whole-kidney homogenates were prepared from mice receiving only for 4 h/ day high (HPD) or low (LPD) phosphate diets for 4 days. Some mice were switched on the last day from high to low phosphate (H/LPD) or from low to high phosphate diet (L/HPD). a Representative immunoblottings for FRS2α, p-FRS2α, and PTH receptor 1 during acute phosphate diets. All blots were normalized against total protein amount stained on Coomassie blue gels. b Bar graph summarizing data from immunoblots showing mean± SEM (n=5 mice/group). All data were normalized to the HPD group (set as 100 %). FRS2α expression in whole-kidney homogenates was acutely modulated by dietary phosphate. p-FRS2α expression in whole-kidney homogenates was modulated only during the acute HPD to LPD switch. BBM expression of the PTH receptor 1 was not modulated by phosphate diets. *p<0.05
FGF23 during acute changes in phosphate intake has not
been reported to date [8].
Here, we demonstrated, using C57/BL6 and NaPi-IIa−/−
mice that NaPi-IIa is the main adaptive NaPi transporter required for acute and chronic dietary phosphate changes in mice. Moreover, we show that plasma levels of PTH but not FGF23 correlate with NaPi-IIa brush border membrane abundance, and that the FGF receptor adaptor protein FRS2α but not the PTH receptor 1 is regulated during the adaption to low phosphate suggesting that PTH may play an important role in the very acute regulation of NaPi-IIa during dietary adaption and that the kidney is able to adapt its sensitivity to FGF23 by regulating FGF receptor signaling.
NaPi-IIa is the main phosphate transporter regulated by dietary phosphate intake in the mouse proximal tubule Our data demonstrate that both C57/BL6 mice and
NaPi-IIa−/− mice were able to acutely regulate their plasma and
urine phosphate levels. However, NaPi-IIa−/−mice reduced
their blood Pi level more drastically when acutely chal-lenged with low phosphate diet than C57/BL6. Moreover, they exhibited higher phosphaturia than C57/BL6 mice whatever the diet. Our data confirm previous observations on the role of NaPi-IIa in chronic high and low phosphate
diets in mice [7] and highlight the importance of NaPi-IIa in
renal Pi handling during acute changes in phosphate intake
in rodents. NaPi-IIa−/− mice maintain their phosphate
ho-meostasis, at least to some degree, by increasing the intes-tinal absorption of phosphate. This had been suggested as
compensatory mechanism but never been tested before [7].
1,25(OH)2D3is elevated in NaPi-IIa−/−mice and may
con-tribute to the adaptive response of the intestine observed in
our study [7]. However, the small intestine is also able to adapt
to low phosphate intake independent from vitamin D3or the
vitamin D3receptor and thus vitamin D3independent
mecha-nisms may be also involved [17]. Whether NaPi-IIa is equally
important in human kidney for phosphate reabsorption and the fast adaption to dietary phosphate intake remains to be established. In contrast to rodents, NaPi-IIc plays a more im-portant role in human kidney, at least for total phosphate
reabsorption [9]
In C57/BL6 mice, NaPi-IIa protein is very rapidly regulated by dietary phosphate intake. In the case of adapting to acute low phosphate diets, this involves most likely only translational or posttranslational mechanisms and trafficking of pre-synthesized NaPi-IIa transporter proteins. At the mRNA level, NaPi-IIa and NaPi-IIc were modulated chronically and also acutely after 4 h of switching from low to high phosphate diet. Both immuno-blotting and immunohistochemistry demonstrated a relocation of NaPi-IIa into the brush border membrane after ingesting low phosphate and this was detectable after 4-h feeding. Similarly, intake of high phosphate caused downregulation and removal of NaPi-IIa transporters from the BBM within 4 h demonstrat-ing the importance of traffickdemonstrat-ing for the regulation of NaPi-IIa function. Removed NaPi-IIa transporters are then routed to
lysosomes for degradation [26] whereas NaPi-IIc may be
recycled [43] or directly degraded [32,44]. In our experiments,
we were unable to detect intracellular NaPi-IIc proteins by HPD H/LPD H/LPD H/LPD 0 200 400 600 800 1000
*
2 hrs 4 hrs 8 hrs*
*
Pl a s m a PT H 1 -8 4 (p g /m l) HPD H/LPD H/LPD H/LPD 0 200 400 600 2 hrs 4 hrs 8 hrs P lasma F G F 23 ( p g /ml ) C57/BL6 C57/BL6a
b
Fig. 11 Plasma PTH and FGF23 changes over 8 h after switching from high to low dietary phosphate intake. Mice were trained to eat for 4 h a day during 4 days high phosphate diet. On the fifth day, mice were subdivided into four groups: group 1 receiving a HPD, groups 2, 3, 4 receiving LPD for 2, 4, and 8 h, respectively. a Plasma PTH was reduced in all groups receiving the LPD whereas b FGF23 remained high until 8 h LPD. *p<0.05 versus HPD. (n=5 to 10 mice/group)
Table 4 PTH and FGF23 values in plasma from C57BL6 during a high to low phosphate diet switch
*p<0.05 vs high Pi diet
High Pi diet 2-h high to low Pi diet 4-h high to low Pi diet 8-h high to low Pi diet
(n=8) (n=5) (n=10) (n=5)
PTH (pg/ml) 623±156 30±10* 61±23* 75±8*
immunohistochemistry consistent with degradation of NaPi-IIc proteins.
In parallel to the changes in phosphate transporter expres-sion in the brush border membrane, we found adaption of
Na+-dependent phosphate transport activity in brush border
membrane vesicles prepared from C57/BL6 mice. In contrast,
Na+-dependent Pi-uptake into BBMV was very low and
remained unchanged in NaPi-IIa−/− mice whatever the diet.
The remaining activity in knock-out BBM is approximately reduced to 30 % under chronic high phosphate diet which is
similar to what was described earlier [50, 56]. This result
indicates that NaPi-IIc and Pit-2 transport activities are low in mice and may already be maximally stimulated in
NaPi-IIa-deficient mice as compensatory mechanism. Of note, NaPi-IIc and Pit-2 were not able to compensate for the lack of NaPi-IIa as indicated by higher urinary phosphate losses under all conditions.
However, NaPi-IIa−/−mice were able to modulate total urinary
phosphate excretion reducing phosphate excretion with low phosphate intake. Several mechanisms may be responsible for this adaption including lower filtered phosphate load due to lower circulating plasma phosphate levels, changes in glomerular filtration rate, or phosphate absorption in segments other than the proximal tubule. Micropuncture studies suggested also some phosphate absorption in distal portions
of the nephron [36] and more recently the presence of
NaPi-IIb has been suggested [54].
HPD LPD LPD LPD 0 50 100 150 200 2 hrs 4 hrs 8 hrs %o f H P D 85 kDa 42 kDa PTH-r 1 actin
C 57/B L6
a
b
HPD LPD LPD LPD 0 50 100 150 200 2 hrs 4 hrs 8 hrs*
*
*
%o f H P D 60 kDa p-FRS2 HPD LPD 2 hrs LPD 4 hrs LPD 8 hrs FRS2 60 kDa FRS2 p-FRS2 PTH-r 1 HPD LPD LPD LPD 0 50 100 150 2 hrs 4 hrs 8 hrs*
*
%o f H P DFig. 12 The adaptor protein FRS2α and its phorphorylated form p-FRS2α are acutely modulated after switching from high to low dietary phosphate intake. Mice were trained to eat 4 h/day during 4 days HPD. On the fifth day, mice were subdivided into four groups: group 1 receiving HPD, and groups 2, 3, 4 feeding LPD for 2, 4, or 8 h, respectively. Whole-kidney homogenates and BBM were prepared and FRS2α p-FRS2α, and PTH receptor 1 abun-dance were determined by western-blotting. a Representative immunoblot-tings for FRS2α, p-FRS2α, and PTH receptor 1 during a 2, 4, and 8 h HPD to
LPD switch. All blots were normalized against total protein amount stained on Coomassie blue gels. b Bar graph summarizing data from immunoblot-ting showing mean±SEM (n=5 mice/group). All data were normalized to the HPD group (set as 100 %). FRS2α and p-FRS2α whole-kidney expression decreased after respectively a 4- and 2-h feeding LPD. n=5 mice/group. BBM expression of the PTH receptor 1 was unchanged during the treatments. *p<0.05 versus HPD
NaPi-IIa is upregulated despite persistently high FGF23 level Changes in dietary phosphate intake were paralleled by plasma PTH levels; high phosphate intake associated with higher PTH levels and low phosphate diet associated with reduced PTH levels. The changes in PTH levels were achieved within at least 4 h after switching to high Pi intake and within less than 2 h after ingesting low phosphate diets. Previous experiments in thyroparathyroidectomized rats showed that adaption from high to low Pi diet did not increase NaPi-IIa abundance within 4 h whereas switching
from low to high Pi reduced NaPi-IIa protein after 4 h [55].
Since animals were not substituted with thyroid hormone, no conclusions on the adaption from high to low Pi diets can be made. Moreover, shorter time points than 4 h were not investigated. The adaption to chronic Pi restriction intake in thyroparathyroidectomized rats demonstrated that neither PTH nor thyroid hormone are the major regulator in this
setting [53, 62]. Despite changes in PTH levels, the
abun-dance of the PTH receptor 1 in the brush border membrane as well as in total kidney remained stable. Whether the receptor is regulated on the subcellular level, i.e., by endocytosis and recycling, remains to be examined in more detail.
The signals stimulating PTH secretion in response to elevated phosphate intake or reducing PTH levels after ingestion of low phosphate diets are not clear to date. While we cannot rule out small changes in ionized calcium levels altering PTH secretion, direct effects of phosphate on
PTH synthesis and secretion may also contribute to regula-tion of parathyroid funcregula-tion. Direct effects of extracellular phosphate on PTH secretion by isolated parathyroid cells or slices under conditions of fixed concentrations of extracel-lular calcium have been described suggesting that phosphate independent from ionized calcium can stimulate PTH
secre-tion [1,2,41,51]. The mechanism underlying this
regula-tion is currently unknown.
In contrast to PTH, FGF23 levels remained high for at least 8 h after switching from high to low phosphate intake. Similarly, FGF23 did not change over a period of 6 h in healthy volunteers when plasma phosphate levels were
acutely lowered [25]. Also in a more chronic setting,
FGF23 levels decreased not before 16 h after switching
healthy probands to a low phosphate diet [58]. Thus,
FGF23 seems to adapt only slowly when the organism has to adapt from high to low phosphate intake. Nevertheless, in our model renal adaption of phosphate excretion, increased BBM phosphate transport activity, and enhanced NaPi-IIa protein expression in the brush border membrane occurred much faster than 8 h despite the high FGF23 levels. These data suggest that PTH and possibly other factors may be more relevant for the rapid adaption from low to high phosphate intake and that the proximal tubule is resistant to the action of FGF23 during the acute adaption to low phosphate diet. The pathway by which FGF23 regulates NaPi-IIa function and expression in the proximal tubule is controversial. FGF23 may act either indirectly on the prox-imal tubule via direct stimulation of a MAPK-dependent
pathway in the distal tubule [22] or may directly elicit an
intracellular signaling cascade in the proximal tubule [3,6,
24]. However, in all models, FGF23 signals via FGF1c
receptors and its downstream adaptor protein FRS2α. We
show now that the total abundance of FRS2α and its
phos-phorylated form are differently modulated during changes in dietary phosphate intake providing a possible explanation for the apparent resistance of the kidney to high circulating FGF23 levels during the switch from high to low Pi intake. Regulatory network in the renal adaption to dietary phosphate intake
Several factors contribute to the adaption of the kidney to changes in phosphate intake. FGF23 and PTH contribute importantly to the downregulation of renal phosphate trans-porters, albeit with different time courses. In addition, sFRP4, MEPE, and dopamine have been identified as po-tential regulators. sFRP4 acutely downregulates renal phos-phate reabsorption and NaPi-IIa abundance in rat kidney
[11]; however, mice lacking sFRP4 adapt normally to
changes in phosphate intake [18]. MEPE reduces renal
phosphate reabsorption [21, 31] and MEPE-deficient mice
display hyperphosphatemia with elevated expression of Fig. 13 Dietary phosphate intake induces rapid regulation of NaPi-IIa
protein abundance. Mice were trained to eat 4 h/day during 4 days HPD. On the fifth day, mice were subdivided into four groups group 1 receiving HPD, and groups 2, 3, or 4 feeding LPD for 2, 4, or 8 h, respectively. BBM were prepared and NaPi-IIa abundance was deter-mined by western-blotting. BBM NaPi-IIa levels were significantly increased after 4 h after feeding LPD. n=5 to 8 mice/group, *p<0.05 versus HPD
NaPi-IIa consistent with a phosphaturic role of MEPE [20]. However, the role of MEPE in the acute renal adaption to changes in dietary phosphate intake has not been determined. In addition, locally produced dopamine may contribute to the downregulation of NaPi-IIa during intake of high phosphate, an
effect mediated by D1-like dopamine receptors [4,61]. A role
of the small intestine in sensing the phosphate load and induc-ing the renal adaption has been proposed but a subsequently published erratum indicates that very high phosphate loads
were given [10]. Thus, even though several hormones besides
PTH and FGF23 may be involved in adapting the kidney to increased dietary phosphate intake, the role of the small intes-tine remains to be clarified. The relative contribution of these factors to regulating renal phosphate handling may vary over time as indicated by the different time courses for PTH and FGF23 elevation and fall upon changes in dietary Pi intake. The response time and time course of other factors such as dopa-mine and MEPE have not been deterdopa-mined in enough detail to integrate them into a more detailed model to date.
In summary, we demonstrate that NaPi-IIa is the main phosphate transporter in mouse kidney and critical for the adaptive capacity of the proximal tubule to adapt to dietary phosphate intake. However, NaPi-IIa-deficient mice showed some ability to adapt their renal excretion of phosphate to dietary intake. During the acute adaption to low phosphate intake, NaPi-IIa is rapidly recruited to the brush border membrane within 4 h despite persistently high FGF23 level suggesting that PTH may mediate at least in part the acute adaption to dietary phosphate.
Acknowledgments The authors thank N. Hernando for fruitful dis-cussions. The use of the ZIRP Core facility for Rodent Physiology is acknowledged. The study was supported by the Swiss National Center for Competence in Research NCCR Kidney.CH to J. Biber and C.A. Wagner.
References
1. Almaden Y, Canalejo A, Hernandez A, Ballesteros E, Garcia-Navarro S, Torres A, Rodriguez M (1996) Direct effect of phos-phorus on PTH secretion from whole rat parathyroid glands in vitro. J Bone Miner Res 11:970–976
2. Almaden Y, Hernandez A, Torregrosa V, Canalejo A, Sabate L, Fernandez Cruz L, Campistol JM, Torres A, Rodriguez M (1998) High phosphate level directly stimulates parathyroid hormone secretion and synthesis by human parathyroid tissue in vitro. J Am Soc Nephrol 9:1845–1852
3. Andrukhova O, Zeitz U, Goetz R, Mohammadi M, Lanske B, Erben RG (2012) FGF23 acts directly on renal proximal tubules to induce phosphaturia through activation of the ERK1/2-SGK1 signaling pathway. Bone 51(3):621–628. doi:10.1016/j.bone.2012.05.015 4. Bacic D, Capuano P, Baum M, Zhang J, Stange G, Biber J,
Kaissling B, Moe OW, Wagner CA, Murer H (2005) Activation of dopamine D1-like receptors induces acute internalization of
the renal Na+/phosphate cotransporter NaPi-IIa in mouse kidney and OK cells. Am J Physiol Renal Physiol 288:F740–F747 5. Bacic D, Lehir M, Biber J, Kaissling B, Murer H, Wagner CA
(2006) The renal Na+/phosphate cotransporter NaPi-IIa is inter-nalized via the receptor-mediated endocytic route in response to parathyroid hormone. Kidney Int 69:495–503
6. Baum M, Schiavi S, Dwarakanath V, Quigley R (2005) Effect of fibroblast growth factor-23 on phosphate transport in proximal tubules. Kidney Int 68:1148–1153
7. Beck L, Karaplis AC, Amizuka N, Hewson AS, Ozawa H, Tenenhouse HS (1998) Targeted inactivation of Npt2 in mice leads to severe renal phosphate wasting, hypercalciuria, and skeletal abnormalities. Proc Natl Acad Sci U S A 95:5372–5377 8. Bergwitz C, Juppner H (2010) Regulation of phosphate
homeosta-sis by PTH, vitamin D, and FGF23. Annu Rev Med 61:91–104 9. Bergwitz C, Roslin NM, Tieder M, Loredo-Osti JC, Bastepe M,
Abu-Zahra H, Frappier D, Burkett K, Carpenter TO, Anderson D, Garabedian M, Sermet I, Fujiwara TM, Morgan K, Tenenhouse HS, Juppner H (2006) SLC34A3 mutations in patients with hered-itary hypophosphatemic rickets with hypercalciuria predict a key role for the sodium-phosphate cotransporter NaP(i)-IIc in maintaining phosphate homeostasis. Am J Hum Genet 78:179–192 10. Berndt T, Thomas LF, Craig TA, Sommer S, Li X, Bergstralh EJ, Kumar R (2007) Evidence for a signaling axis by which intestinal phosphate rapidly modulates renal phosphate reabsorption. Proc Natl Acad Sci U S A 104:11085–11090
11. Berndt TJ, Bielesz B, Craig TA, Tebben PJ, Bacic D, Wagner CA, O’Brien S, Schiavi S, Biber J, Murer H, Kumar R (2006) Secreted frizzled-related protein-4 reduces sodium-phosphate co-transporter abundance and activity in proximal tubule cells. Pflugers Arch 451:579–587
12. Biber J, Hernando N, Forster I, Murer H (2009) Regulation of phosphate transport in proximal tubules. Pflugers Arch 458:39–52 13. Biber J, Stieger B, Stange G, Murer H (2007) Isolation of renal
proximal tubular brush-border membranes. Nat Protoc 2:1356– 1359
14. Biber J, Stieger B, Haase W, Murer H (1981) A high yield preparation for rat kidney brush border membranes. Different behaviour of lysosomal markers. Biochim Biophys Acta 647:169–176
15. Breusegem SY, Takahashi H, Giral-Arnal H, Wang X, Jiang T, Verlander JW, Wilson P, Miyazaki-Anzai S, Sutherland E, Caldas Y, Blaine JT, Segawa H, Miyamoto K, Barry NP, Levi M (2009) Differential regulation of the renal sodium-phosphate cotransporters NaPi-IIa, NaPi-IIc, and PiT-2 in die-tary potassium deficiency. Am J Physiol Renal Physiol 297:F350–F361
16. Capuano P, Bacic D, Stange G, Hernando N, Kaissling B, Pal R, Kocher O, Biber J, Wagner CA, Murer H (2005) Expression and regulation of the renal Na/phosphate cotransporter NaPi-IIa in a mouse model deficient for the PDZ protein PDZK1. Pflugers Arch 449:392–402
17. Capuano P, Radanovic T, Wagner CA, Bacic D, Kato S, Uchiyama Y, St-Arnoud R, Murer H, Biber J (2005) Intestinal and renal adaptation to a low-Pi diet of type II NaPi cotransporters in vitamin D receptor- and 1alphaOHase-deficient mice. Am J Physiol Cell Physiol 288:C429–C434
18. Christov M, Koren S, Yuan Q, Baron R, Lanske B (2011) Genetic ablation of sfrp4 in mice does not affect serum phosphate homeo-stasis. Endocrinology 152:2031–2036
19. Custer M, Lötscher M, Biber J, Murer H, Kaissling B (1994) Expression of Na-Picotransport in rat kidney: localization by RT-PCR and immunohistochemistry. Am J Physiol 266:F767– F774
20. David V, Martin A, Hedge AM, Rowe PS (2009) Matrix extracellular phosphoglycoprotein (MEPE) is a new bone
renal hormone and vascularization modulator. Endocrinology 150:4012–4023
21. Dobbie H, Unwin RJ, Faria NJ, Shirley DG (2008) Matrix extracel-lular phosphoglycoprotein causes phosphaturia in rats by inhibiting tubular phosphate reabsorption. Nephrol Dial Transplant 23:730–733 22. Farrow EG, Davis SI, Summers LJ, White KE (2009) Initial FGF23-mediated signaling occurs in the distal convoluted tubule. J Am Soc Nephrol 20:955–960
23. Fiske CH, SubbaRow Y (1925) The colorometric determination of phosphorus. J Biol Chem 66:375–400
24. Hu MC, Shi M, Zhang J, Pastor J, Nakatani T, Lanske B, Shawkat Razzaque M, Rosenblatt KP, Baum MG, Kuro OM, Moe OW (2010) Klotho: a novel phosphaturic substance acting as an autocrine enzyme in the renal proximal tubule. FASEB J 24(9):3438–3450. doi:10.1096/fj.10-154765
25. Ito N, Fukumoto S, Takeuchi Y, Takeda S, Suzuki H, Yamashita T, Fujita T (2007) Effect of acute changes of serum phosphate on fibroblast growth factor (FGF)23 levels in humans. J Bone Miner Metab 25:419–422
26. Keusch I, Traebert M, Lötscher M, Kaissling B, Murer H, Biber J (1998) Parathyroid hormone and dietary phosphate provoke a lysosomal routing of the proximal tubular Na/Pi-cotransporter type II. Kidney Int 54:1224–1232
27. Kurosu H, Ogawa Y, Miyoshi M, Yamamoto M, Nandi A, Rosenblatt KP, Baum MG, Schiavi S, Hu MC, Moe OW, Kuro-o M (2006) Regulation of fibroblast growth factor-23 signaling by klotho. J Biol Chem 281:6120–6123
28. Lanzano L, Lei T, Okamura K, Giral H, Caldas Y, Masihzadeh O, Gratton E, Levi M, Blaine J (2011) Differential modulation of the molecular dynamics of the type IIa and IIc sodium phosphate cotransporters by parathyroid hormone. Am J Physiol Cell Physiol 301:C850–C861
29. Levi M, Lötscher M, Sorribas V, Custer M, Arar M, Kaissling B, Murer H, Biber J (1994) Cellular mechanisms of acute and chronic adaptation of rat renal Pitransporter to alterations in dietary Pi. Am J Physiol 267:F900–F908
30. Lötscher M, Wilson P, Nguyen S, Kaissling B, Biber J, Murer H, Levi M (1996) New aspects of adaptation of rat renal Na-Pi cotransporter to alterations in dietary phosphate. Kidney Int 49:1012–1018 31. Marks J, Churchill LJ, Debnam ES, Unwin RJ (2008) Matrix
extracellular phosphoglycoprotein inhibits phosphate transport. J Am Soc Nephrol 19:2313–2320
32. Matsumoto N, Hemmi A, Yamato H, Ohnishi R, Segawa H, Ohno S, Miyamoto K (2010) Immunohistochemical analyses of parathy-roid hormone-dependent downregulation of renal type II Na-Pi cotransporters by cryobiopsy. J Med Invest 57:138–145
33. Miyamoto K, Haito-Sugino S, Kuwahara S, Ohi A, Nomura K, Ito M, Kuwahata M, Kido S, Tatsumi S, Kaneko I, Segawa H (2011) Sodium-dependent phosphate cotransporters: lessons from gene knockout and mutation studies. J Pharm Sci 100:3719– 3730
34. Miyamoto KI, Itho M (2001) Transcriptional regulation of the NPT2 gene by dietary phosphate. Kidney Int 60:412– 415
35. Mohebbi N, Kovacikova J, Nowik M, Wagner CA (2007) Thyroid hormone deficiency alters expression of acid–base transporters in rat kidney. Am J Physiol Renal Physiol 293:F416–F427
36. Muhlbauer RC, Bonjour JP, Fleisch H (1977) Tubular localization of adaptation to dietary phosphate in rats. Am J Physiol 233:F342–F348 37. Murer H, Biber J (2010) Phosphate transport in the kidney. J
Nephrol 23(Suppl 16):S145–S151
38. Murer H, Forster I, Biber J (2004) The sodium phosphate cotransporter family SLC34. 7 447:763
39. Murer H, Hernando N, Forster I, Biber J (2000) Proximal tubular phosphate reabsorption: molecular mechanisms. Physiol Rev 80:1373–1409
40. Murer H, Hernando N, Forster I, Biber J (2003) Regulation of Na/ Pi transporter in the proximal tubule. Annu Rev Physiol 65:531– 542
41. Nielsen PK, Feldt-Rasmussen U, Olgaard K (1996) A direct effect in vitro of phosphate on PTH release from bovine parathyroid tissue slices but not from dispersed parathyroid cells. Nephrol Dial Transplant 11:1762–1768
42. Nowik M, Picard N, Stange G, Capuano P, Tenenhouse HS, Biber J, Murer H, Wagner CA (2008) Renal phosphaturia during metabolic acidosis revisited: molecular mechanisms for decreased renal phosphate reabsorption. Pflugers Arch 457:539–549
43. Ohkido I, Segawa H, Yanagida R, Nakamura M, Miyamoto K (2003) Cloning, gene structure and dietary regulation of the type-IIc Na/Pi cotransporter in the mouse kidney. Pflugers Arch 446:106–115
44. Picard N, Capuano P, Stange G, Mihailova M, Kaissling B, Murer H, Biber J, Wagner CA (2010) Acute parathyroid hormone differ-entially regulates renal brush border membrane phosphate cotransporters. Pflugers Arch 460:677–687
45. Quentin F, Chambrey R, Trinh-Trang-Tan MM, Fysekidis M, Cambillau M, Paillard M, Aronson PS, Eladari D (2004) The Cl−/HCO3−exchanger pendrin in the rat kidney is regulated in response to chronic alterations in chloride balance. Am J Physiol Renal Physiol 287:F1179–F1188
46. Ravera S, Virkki LV, Murer H, Forster IC (2007) Deciphering PiT transport kinetics and substrate specificity using electrophysiology and flux measurements. Am J Physiol Cell Physiol 293:C606– C620
47. Razzaque MS (2009) The FGF23-Klotho axis: endocrine regula-tion of phosphate homeostasis. Nat Rev Endocrinol 5:611–619 48. Ritthaler T, Traebert M, Lotscher M, Biber J, Murer H,
Kaissling B (1999) Effects of phosphate intake on distribution of type II Na/Pi cotransporter mRNA in rat kidney. Kidney Int 55:976–983
49. Segawa H, Kaneko I, Takahashi A, Kuwahata M, Ito M, Ohkido I, Tatsumi S, Miyamoto K (2002) Growth-related renal type II Na/Pi cotransporter. J Biol Chem 277:19665–19672
50. Segawa H, Onitsuka A, Kuwahata M, Hanabusa E, Furutani J, Kaneko I, Tomoe Y, Aranami F, Matsumoto N, Ito M, Matsumoto M, Li M, Amizuka N, Miyamoto K (2009) Type IIc sodium-dependent phosphate transporter regulates calcium metabolism. J Am Soc Nephrol 20:104–113
51. Slatopolsky E, Finch J, Denda M, Ritter C, Zhong M, Dusso A, MacDonald PN, Brown AJ (1996) Phosphorus restriction prevents parathyroid gland growth. High phos-phorus directly stimulates PTH secretion in vitro. J Clin Invest 97:2534–2540
52. Slot C (1965) Plasma creatinine determination. A new and specific Jaffe reaction method. Scand J Clin Lab Invest 17:381–387 53. Stoll R, Kinne R, Murer H (1979) Effect of dietary phosphate
intake on phosphate transport by isolated rat renal brush-border vesicles. Biochem J 180:465–470
54. Suyama T, Okada S, Ishijima T, Iida K, Abe K, Nakai Y (2012) High phosphorus diet-induced changes in NaPi-IIb phosphate transporter expression in the rat kidney: DNA microarray analysis. PLoS One 7:e29483
55. Takahashi F, Morita K, Katai K, Segawa H, Fujioka A, Kouda T, Tatsumi S, Nii T, Taketani Y, Haga H, Hisano S, Fukui Y, Miyamoto KI, Takeda E (1998) Effects of dietary Pi on the renal Na+−dependent Pi transporter NaPi-2 in thyroparathyroidectomized rats. Biochem J 333(Pt 1):175–181
56. Tenenhouse HS, Martel J, Gauthier C, Segawa H, Miyamoto K (2003) Differential effects of Npt2a gene ablation and X-linked Hyp mutation on renal expression of Npt2c. Am J Physiol Renal Physiol 285:F1271–F1278
57. Verri T, Markovich D, Perego C, Norbis F, Stange G, Sorribas V, Biber J, Murer H (1995) Cloning of a rabbit renal Na-Pi cotransporter, which is regulated by dietary phosphate. Am J Physiol 268:F626–F633 58. Vervloet MG, van Ittersum FJ, Buttler RM, Heijboer AC, Blankenstein
MA, ter Wee PM (2011) Effects of dietary phosphate and calcium intake on fibroblast growth factor-23. Clin J Am Soc Nephrol 6:383–389 59. Villa-Bellosta R, Ravera S, Sorribas V, Stange G, Levi M, Murer
H, Biber J, Forster IC (2009) The Na+−Pi cotransporter PiT-2 (SLC20A2) is expressed in the apical membrane of rat renal proximal tubules and regulated by dietary Pi. Am J Physiol Renal Physiol 296:F691–F699
60. Virkki LV, Biber J, Murer H, Forster IC (2007) Phosphate trans-porters: a tale of two solute carrier families. Am J Physiol Renal Physiol 293:F643–F654
61. Weinman EJ, Biswas R, Steplock D, Wang P, Lau YS, Desir GV, Shenolikar S (2011) Increased renal dopamine and acute renal adaptation to a high-phosphate diet. Am J Physiol Renal Physiol 300:F1123–F1129
62. Woda C, Mulroney SE, Halaihel N, Sun L, Wilson PV, Levi M, Haramati A (2001) Renal tubular sites of increased phos-phate transport and NaPi-2 expression in the juvenile rat. Am J Physiol Regul Integr Comp Physiol 280:R1524–R1533