ORIGINAL PAPER
Vladeta Ajdacic-Gross Æ Stephan Horvath Æ Mirjana Canjuga Æ Alex Gamma Æ Jules Angst Wulf Ro¨ssler Æ Dominique Eich
How ubiquitous are physical and psychological complaints in
young and middle adulthood?
A longitudinal perspective
Accepted: 31 July 2006 / Published online: 8 September 2006
j Abstract Objectives To investigate continuity and change of self-reported physical and psychological complaints in young adults over a period of 20 years. Study design and setting The Zurich Study – a long-term panel survey in psychiatric epidemiology – is based on a stratified sample of 591 subjects born in 1958 (women) and 1959 (men). The sample strata combine SCL-90-R high-scorers and low-scorers in a 2:1 ratio. Up to now, the Zurich Study has included six interviews between 1979 and 1999, i.e. 20 years of life in young adults. We analysed the longitudinal frequency data of a variety of physical and psycho-logical complaints, as well as information about subjective suffering and use of professional help. The analyses utilised on the McNemar’s test, the Q-test and Markov chain models. Results Sleep disorders, depression, menstruation, backache, headache, stomach and bowel complaints yielded cumulative prevalence rates of 80% or higher. Physical and psychological complaints systematically differ with respect to the change patterns between 1979 and 1999. Moreover, strong differences were found in view of subjective suffering and use of professional help. Conclusions Even though many self-reported physical and psychological complaints are very common in young adulthood, the underlying dynamics and the implications largely differ. It seems to be crucial whether respondents use somatic glasses or psycho-logical lenses.
j Key words self-reported symptoms – longitudinal study – psychiatric epidemiology – Switzerland
Introduction
Basic information about physical and psychological complaints within a population may be found in an increasing number of extensive data sources: national and regional health surveys, household panels and other general inquiries. Usually, information relies on self-reported symptoms similar to items of well-known scales and questionnaires like the SCL-90-R (Symptom Checklist) [1], the General Health Questionnaire [2] and others. The symptoms are expected to correspond sufficiently with diagnoses or at least with complaints, i.e. suffering of subjects, either subjective or objective. However, such assumptions may be too optimistic. In fact, the different mechanisms that motivate sub-jects to indicate specific complaints and to hide others are only partially understood. Besides the nature of the complaints, many other variables influence the subjects’ answers: the level of awareness, of attention, the degree of individual and social acceptance, the valuation of symptoms, attribution and labelling processes [3,4]. As a consequence, reporting of health complaints depends indirectly also on many other influences such as gender, age, social class, cultural context [5] as well as stress, health beliefs and cost-benefit mechanisms [6]. Finally, the ambiguities of self-reported complaints may contribute to the fact that formal characteristics like the way of survey administration [7] or the format of answers – for example, polytomous vs. dichotomous [8, 9] – plays an exceptionally important role.
Longitudinal data might distinctly improve our understanding of self-reported health complaints. However, such data is as sparse as in many other
Dr. phil. V. Ajdacic-Gross (&) Æ S. Horvath, MA
M. Canjuga, MA Æ A. Gamma, PhD Æ J. Angst, MD W. Ro¨ssler, MD, MA Æ D. Eich, MD
Psychiatric University Hospital Milita¨rstr. 8 8004 Zu¨rich, Switzerland Tel.: +41-44/2967-433 Fax: +41-44/2967-449 E-Mail: [email protected] SPP E 111
research domains. This study investigated continuity and change of self-reported complaints in a panel of young adults from the canton of Zurich. The data stems from the Zurich Study, a long-term panel sur-vey in psychiatric epidemiology [10–12].
The analyses that are presented below aim: • to describe the longitudinal patterns of physical and
psychological complaints from 1979 to 1999 and between ages 20 and 40, respectively;
• to compare the occurrence of physical and psycho-logical complaints with putative severity indicators like subjective suffering, and use of professional and other help;
• to characterise the change patterns of physical and psychological complaints.
Data and methods
The Zurich Study had been designed to describe and investigate the incidence of depressive and other mental disorders as well as com-mon physical symptoms. The participants pertain to birth cohorts born in 1958 and 1959 and were selected in a screening interview in 1978. The interviews were conducted in 1979 and in five follow-up interviews within a 20-year period (1981, 1986, 1988, 1993, 1999). Thus, the participants were followed from age 20/21 to age 40/41.
j Sample
In the screening interview in 1978, 4,547 participants (i.e. 2,201 men born in 1959 and 2,346 women born in 1958) were interviewed using
a brief questionnaire and the SCL-90-R [1]. All participants were
Swiss citizens and were living in the canton of Zurich. The SCL-90-R was used to generate a stratified subsample of 591 participants for further interviews. The strata comprised equal samples of men (292) and women (299) as well as subgroups representing SCL-90-R high-scorers and low-high-scorers in a 2:1 ratio. The former were derived from participants achieving the 85th percentile or higher in the SCL-90-R, the latter from participants scoring below the 85th percentile.
In each of the five follow-up interviews, on average 10% of participants dropped out each time. Overall analyses have shown that one cannot predict dropouts either by sex or SCL-90-R status. However, more detailed analyses have indicated that dropouts are more frequent in extreme SCL-90-R scorers – high or low – than in
medium scorers [13]. Moreover, in each interview men are more
likely to drop out than women. However, men are also more likely to re-enter the study again. Thus, women clearly dominate the group of subjects who participated in all six interviews (overall: 278/47%; women: 162/54%; men: 116/40%). Overall, 372 subjects (63%) participated in five or six interviews, 114 (19%) in three or four interviews and 105 (18%) in one or two interviews. There is no difference between the sexes at the lower end of participation.
The analyses presented below are based on the 372 participants (203 women and 169 men) with five or six interviews. In order to save comparability of results in longitudinal analysis the focus is laid on subjects with constant participation in the study. We also considered participants with five interviews assuming that many of them may have missed an interview involuntarily because of job duties, military service, child births, etc. – thus they were consid-ered as not really being dropouts.
j SPIKE
The interviews in the Zurich Study were conducted with Structured Psychopathological Interview and Rating of the Social Conse-quences of Psychological Disturbances for Epidemiology (SPIKE), a
comprehensive semi-structured questionnaire covering a wide
range of disorders and complaints [12]. At present, the 9th version
of SPIKE is in use, and it is compatible with the Diagnostic and Statistical Manual of Mental Disorders (versions DSM-III-R and
DSM-IV) [14]. SPIKE interviews are conducted face-to-face.
SPIKE is divided into over 20 separate sections. It starts with two sections on socio-demographic characteristics and use of health services. The following sections deal with physical and psychophysical complaints such as stomach, bowel, respiration, heart, circulation, back, headache, allergies, pain, sleep, eating disorders, sexual disorders and menstruation. The focus shifts then on psychiatric disorders such as hypochondria, panic, anxiety, phobia, post-traumatic stress disorder (PTSD), depression, suicide, neurasthenia, hypomania and obsessive-compulsive disorder. Fi-nally, there are questions on substance use/abuse (smoking, alco-hol, drugs, illicit drugs).
Each section (except the first two) is introduced with a dichotomous initial question, which aims to include all participants having had any facet of the respective complaint in the last 12 months. In recent interviews some sections (depression, neur-asthenia, hypomania) have been introduced using two or three
initial questions.1The interviewers were instructed to keep probing
and to provide examples if the answers of the interviewee were not clearly negative. Beyond initial questions, each section comprises questions addressing specific symptoms, duration of the most serious symptoms, their intensity, treatment procedures, impair-ment, suffering, and finally, an anamnestic section covering the years since the last follow-up. Contrary to the initial questions, the specific questions serve to specify the symptoms and filter out concrete information on syndromes and diagnoses.
j Data used in the analyses
The analyses reported below use the information from the initial questions of most of the complaints covered by SPIKE. We did not include such sections where the initial questions were combined with exclusion criteria and thus had a different format (hypo-chondria, hypomania, PTSD, appetite/weight). Moreover, con-sumption of alcohol, drugs and other substances was also omitted. For some complaints, no specific initial questions were asked in the first two interviews (different phobias, panic), so that the respective information was unavailable. Thus, in some analyses the aggregated phobia frequencies were included. In most initial questions the wording of the questions changed slightly from interview to interview. A major change of wording was introduced in suicide (inclusion of thoughts about dying) and in anxiety (separate initial questions for anxiety and panic), both in 1986.
Descriptive analyses of complaint frequencies included longi-tudinal patterns as well as cumulative prevalence rates. Cumulative prevalence rates represent in fact five or six 12-month prevalences over all interviews. Although they underestimate lifetime preva-lences, they permit clear differentiation between ubiquitous com-plaints and relatively rare ones. The rates were routinely differentiated by sex and by initial SCL-90-R status. Moreover, descriptive longitudinal analyses involved additional information about the use of professional and other help (any vs. none) and about subjective suffering. The latter was assessed by asking about stresses and strains, and impairment. It was operationally defined by a 100-point scale, which was called the ‘‘thermometer’’, with 0 representing no strain/impairment at all and 100 representing immense strain. The subjective suffering scores were subsequently dichotomised (50 or higher vs. below 50) to focus on participants
1
For example, the two initial questions of the depression section in the 1999 interview were:
(a) During the last 12 months, have you ever felt devoid of energy, depressed, sad, tired of living, or have you suffered from a loss of efficiency, feelings of inferiority, a complete lack of interests, or have you just had ‘‘the blues’’?
(b) Were you extremely unhappy and did not enjoy anything and even good news could not cheer you up?
indicating serious suffering. In some interviews, data related to the degree of suffering was lacking (for example, subjective suffering in allergies).
j Statistical analyses
To assess change patterns several statistical tests for contingency tables were applied. The data of each complaint were aggregated to three periods by pooling the interviews 1979/81, 1986/88 and 1993/ 99 in order to facilitate the interpretation of the results. McNemar’s test and Cochran’s Q-test is the first choice in contingency table analysis if dealing with dependent samples, i.e. repeated analysis
[15]. McNemar’s test can be used in analysis of two time points. We
applied it in pairwise comparisons among the three pooled periods 1979/81, 1986/88 and 1993/99 in order to locate change better than with Cochran’s Q-test. The Q-test is similar to McNemar’s test, however several time points are introduced into one analysis. Both tests focus exclusively on the ‘‘changers’’ by comparing the
fre-quencies of changers from, say, At1(category A at time t1) to Bt2
(category B at time t2) and from Bt1to At2. Significant results from
these tests mean that there are more changers in one of these change directions than in the other.
Further information about change patterns was derived from analyses applying a first-order Markov chain model within the
framework of log-linear analysis models [16]. Markov models
in-clude both the changers subgroups and the ‘‘stayers’’ subgroups to
examine the transition probabilities from, say, At1to At2and Bt2
and from Bt1to At2and Bt2. In particular, the models examine
whether the transition probabilities remain similar over two or more change steps. Significant results mean that the transition probabilities do diverge over time. Analysis of Markov chains fo-cuses specifically on continuity of transition probabilities, and thus provides another perspective on change patterns than do McNe-mar’s test and Cochran’s Q-test, that is, a perspective on the dynamics beyond the rough change frequencies.
The analyses were prepared with SAS (V6.12/Macintosh) and conducted with SPSS (V11/Macintosh: McNemar’s test and
Coch-ran’s Q-test) and with lEM (Markov chains) [17].
Results
j Descriptive analyses of change
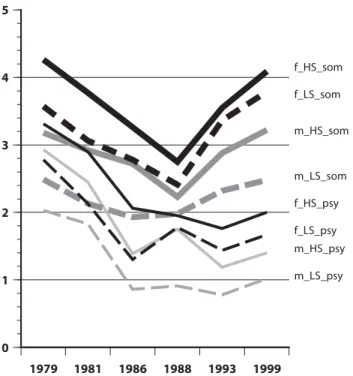
Figure1shows mean frequencies of positive answers by interview for a group of physical complaints (stomach, bowel, respiration, heart, circulation, back-ache, headback-ache, allergies) versus a group of psycho-logical complaints (phobic, anxious, depressive, suicidal, neurasthenic, obsessive-compulsive com-plaints). Even if differentiated by sex and by initial SCL-90-R status, the same two patterns dominate the figure: • physical complaints followed a U-shape with relatively
low means in the 1986 and 1988 interviews;
• psychological complaints were also relatively frequent around age 20, i.e. in 1979 and 1981, then the curve dropped and remained relatively constant.
As expected, men (low-scorers) had consistently lower means than women (high-scorers).
In each interview, between 70% and 85% of par-ticipants indicated two or more physical complaints assessed by initial questions. Regarding psychological complaints, about one-third of the sample indicated no complaints, one-third indicated one complaint, and one-third indicated two or more complaints.
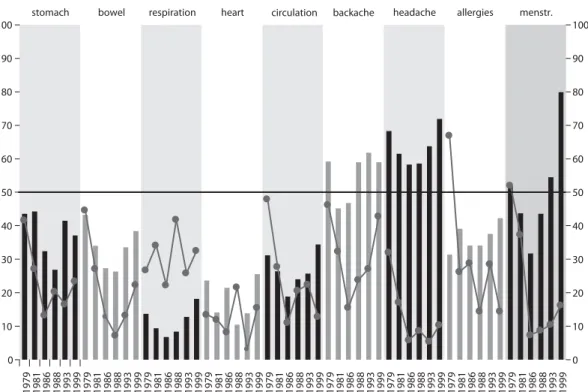
The longitudinal frequencies of specific complaints (reweighed to exclude the effect of sample stratifica-tion) and the percentages of participants making use of professional and other help are depicted in Figs. 2 and3 (columns). Some physical complaints followed the general pattern (see Fig. 1above) only in part: a continuing increase was obvious for example in allergies and backache. The general pattern in psy-chological and psychophysical complaints was domi-nated by depression, neurasthenic and anxiety complaints. Besides phobias, sleep and sexuality dis-orders showed a more or less consistent increase of complaint frequencies.
The use of professional and other help (physician, psychiatrist, psychologist, other) is depicted by the circles in Figs. 2 and 3. ‘‘Other help’’ comprises a variety of providers from complementary and alter-native medicine. In most physical complaints the proportion of participants seeking help (among those who had indicated having a specific complaint) dropped after the first two interviews. This was also the case in sleep and sexuality complaints. In psy-chological complaints the proportions of participants seeking help (among those who had indicated having a specific complaint) were in general lower than in physical complaints.
j Cumulative rates
The cumulative prevalence rates of specific com-plaints reached very different levels after 20 years of
1979 1981 1986 1988 1993 1999 0 1 2 3 4 5 m_HS_som m_LS_som f_HS_som f_LS_som f_HS_psy f_LS_psy m_HS_psy m_LS_psy
Fig. 1 Average number of overall positive answers to initial questions related to physical (‘‘som’’) and psychological (‘‘psy’’) complaints in the Zurich Study, 1979–1999, by sex (males/females) and initial SCL-90-R score (high-scorers/ low-scorers)
1979 1981 1986 1988 1993 1999 0 10 20 30 40 50 60 70 80 90 100 1979 1981 1986 1988 1993 1999 1979 1981 1986 1988 1993 1999 1979 1981 1986 1988 1993 1999 1979 1981 1986 1988 1993 1999
phobias anxiety depression neurasth. OCB
1979 1981 1986 1988 1993 1999 1979 1981 1986 1988 1993 1999 0 10 20 30 40 50 60 70 80 90 100 sleep sexuality
Fig. 3 Columns: psychological complaints including sleep and sexuality in the Zurich Study, 1979–1999, rates adjusted for sample stratification. Circles: percentage of participants confirming use of health services (with reference to those indicating as having the respective complaint)
1979 1981 1986 1988 1993 1999 1979 1981 1986 1988 1993 1999 1979 1981 1986 1988 1993 1999 1979 1981 1986 1988 1993 1999 1979 1981 1986 1988 1993 1999 1979 1981 1986 1988 1993 1999 1979 1981 1986 1988 1993 1999
stomach bowel respiration heart backache headache allergies
1979 1981 1986 1988 1993 1999 0 10 20 30 40 50 60 70 80 90 100 menstr. 1979 1981 1986 1988 1993 1999 0 10 20 30 40 50 60 70 80 90 100 circulation
Fig. 2 Columns: physical complaints in the Zurich Study, 1979–1999, rates adjusted for sample stratification. Circles: percentage of participants confirming use of health services (with reference to those indicating as having the respective complaint)
investigation. Figure4 (black columns) indicates mainly three levels:
• common complaints occurring in over 80% of the panel (backache, headache, bowel, stomach, depres-sion, sleep disorders, and in women menstruation); • complaints with intermediate frequencies in 60–80%
(allergies, circulation, phobia, anxiety, neurasthenia, sexuality);
• less frequent complaints (heart, respiration, panic, obsessive compulsive behaviour).
Women reported complaints consistently more fre-quently than men. This was especially true in the reporting of panic and circulation complaints (results not shown).
The cumulative percentage of subjects confirming high levels of subjective suffering (Fig.4, grey col-umns) was elevated notably in depression and head-ache. This was not only because of high baseline frequencies but also because of high within-propor-tions of participants who confirmed suffering seri-ously (among those who had indicated having a specific complaint). Within-proportions of similar magnitude were found also in respiration, anxiety, neurasthenia, sleep and sexuality.
The cumulative rates of use of professional/other help were over 50% in depression, over 40% in menstruation, backache, headache, allergies, and over 30% in stomach, sleep disorders, anxiety and neur-asthenia (results not documented).
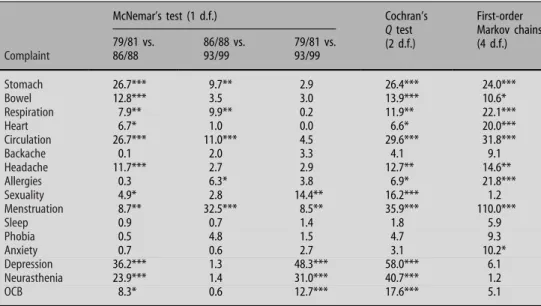
j Statistical analyses of change
The patterns of change were examined using several analysis models, which are documented in Table1. McNemar’s test and Cochran’s Q-test showed imme-diately that some complaints (sleep, phobia, anxiety,
backache) demonstrate considerable continuity. McNemar’s test of the 79/81 vs. 86/88 interviews yielded more items with diverging changer frequen-cies than the comparison between 86/88 and 93/99 interviews. A net difference in changer frequencies between 79/81 and 93/99 was found only in depres-sion, neurasthenia, OCB, sexuality and menstruation. The analyses with first-order Markov chains show a slightly different picture than McNemar’s Test and Cochran’s Q-test. Obviously, the significant chi-square values are almost fully constrained to physical com-plaints. The transition probabilities between ‘‘having a specific complaint’’ and/or ‘‘not having it’’ change over time in physical complaints, and stay more or less un-changed in psychological complaints. Consequently, the dynamics beyond the change is obviously different in physical and in psychological complaints.
Discussion
Simple probe questions about physical and psycho-logical complaints are asked in general practice, as well as in questionnaires, health surveys, household panels and other public health inquiries. Whereas, on the other hand, the reporting of symptoms is a highly complex process [18], which may involve:
• perception of symptoms, recall/repression;
• concerns including valuation, subjective suffering, impairment;
• attribution – being influenced by health literacy, social norms and coping styles;
• severity of symptoms, disorders and diseases. Each of these components have been investigated by a series of cross-sectional analyses [3,6,19]. In contrast to this, only a few research efforts have considered
menstruation
backache headache stomach
bowel allergies circulation heart respiration depression phobia anxiety neurasthenia OCB sleep sexuality 0 10 20 30 40 50 60 70 80 90 100 95 46.4 92.7 39.9 90.6 58.5 82.8 36.4 82.3 20.9 72.5 64.5 20.6 56 21.3 37.7 20.2 90.9 70.7 71.8 32.5 66.2 45.4 65.5 38.5 25.9 5.2 87.1 44.2 62.5 36.1
information not available
Fig. 4 Cumulative prevalence of physical and psychological complaints (black columns) and cumulative percentage of participants confirming high levels of subjective suffering (grey columns) in the Zurich Study, 1979–1999, adjusted to sample stratification
longitudinal data [20] or have been dedicated to mechanisms and patterns of change in reporting of symptoms [21].
j Prevalence of complaints and high level of
subjective suffering
Health complaints have been reported to be ubiqui-tous: up to 75% of the subjects report health com-plaints within a fairly short time-window of 30 days [22]. In this study, longitudinal data of the Zurich Study panel was used to document physical and psychological complaints in young Swiss adults over a period of 20 years. Various health complaints yielded a cumulative or ‘‘lifetime’’ prevalence rate of 80% or more. Two mechanisms can contribute to such high rates: (a) high baseline frequencies (sleep disorders, backache), (b) high interchange rates between com-plaint states (‘‘to have’’ vs. ‘‘not to have a comcom-plaint’’: stomach, bowel) – or a combination of both mecha-nisms (depression, menstruation, headache). How-ever, it was surprising how many complaints encountered ‘‘ceiling effects’’ after five or six inter-views, thus confirming the notion that the initial questions assess in the first place perceptional habits and concerns. Another impressive issue was the extent of (longitudinal) variation of the prevalence rates. The highest rates in menstruation, depression, heart as well as respiration complaints are more than twice the lowest rates. There is a parallel to the findings in the cross-sectional studies which showed a high variation, for example, along sex or social class [18,23]. Within a more narrow focus – defined by a high level of subjective suffering – the psychological and psy-chophysical complaints dominated. However, respira-tion and headache yielded also serious subjective consequences. The most impressive effect of this
analysis was to demonstrate that psychological symp-toms were a major determinant of subjective suffering.
j Use of professional help
The level of subjective suffering influences the use of professional or complementary help. For any of the following complaints, one-third or more of participants sought help from age 20 to 40: depression, menstrua-tion, backache, headache, allergies, stomach, sleep disorders, anxiety and neurasthenia. Depression was the most frequent item not only in view of subjective suffering, but also in view of use of professional/com-plementary help: every second participant has sought help from age 20 to age 40 because of this issue.
Interestingly, there are age-related differences between physical and psychological complaints regarding the use of help. At the age of 20, the par-ticipants of the Zurich panel sought often help because of physical symptoms, but seldom because of psy-chological symptoms. While the proportion of physi-cal help seekers decreased in later interviews, the proportion of help seekers, for example, in anxiety increased from nearly 0 to about a quarter. Most probably two processes led to this change: first, the irritations provoked by physical symptoms dimin-ished either due to improving knowledge/experience, or because of treatment that was undertaken (allergies, asthma); and, second, psychological symptoms pos-sibly became more acceptable as a reason to seek help.
j Different change patterns between physical and
psychological complaints
At first glance, physical and psychological complaints in the Zurich panel shared similar longitudinal pat-Table 1 Associations of repeatedly
measured complaints in 1979/81 vs. 1986/88 vs. 1993/99
McNemar’s test (1 d.f.) Cochran’s
Q test (2 d.f.) First-order Markov chains (4 d.f.) Complaint 79/81 vs. 86/88 86/88 vs. 93/99 79/81 vs. 93/99 Stomach 26.7*** 9.7** 2.9 26.4*** 24.0*** Bowel 12.8*** 3.5 3.0 13.9*** 10.6* Respiration 7.9** 9.9** 0.2 11.9** 22.1*** Heart 6.7* 1.0 0.0 6.6* 20.0*** Circulation 26.7*** 11.0*** 4.5 29.6*** 31.8*** Backache 0.1 2.0 3.3 4.1 9.1 Headache 11.7*** 2.7 2.9 12.7** 14.6** Allergies 0.3 6.3* 3.8 6.9* 21.8*** Sexuality 4.9* 2.8 14.4** 16.2*** 1.2 Menstruation 8.7** 32.5*** 8.5** 35.9*** 110.0*** Sleep 0.9 0.7 1.4 1.8 5.9 Phobia 0.5 4.8 1.5 4.7 9.3 Anxiety 0.7 0.6 2.7 3.1 10.2* Depression 36.2*** 1.3 48.3*** 58.0*** 6.1 Neurasthenia 23.9*** 1.4 31.0*** 40.7*** 1.2 OCB 8.3* 0.6 12.7*** 17.6*** 5.1
Chi-square values derived from McNemar’s test, Cochran’s Q-test and first-order Markov chains Significance levels: * > 0.05; ** > 0.01; *** > 0.001
terns. However, different transition probabilities were indicated by analyses using first-order Markov chains. Interestingly, psychological complaints had more consistent transitions probabilities than physical complaints. In other words, similar proportions of respondents switched each time from one category to the other, whereas these proportions changed over time in physical complaints. It was not clear, which were the reasons for this difference. While many research results have shown that reporting of physical and psychological complaints is highly correlated [3,
8,20,24], the difference found in the longitudinal data
might provide a challenging new perspective on how subjects report symptoms in young and middle age.
j Strengths and limitations
The initial questions in the Zurich Study have a similar format like health related questions in general health surveys and household panels. Due to the specific interview context (the interviewers were encouraged to keep probing) and the recurrence of questions in a panel study, the prevalence rates of complaints found in the Zurich Study are distinctly higher than the ones found in general cross-sectional surveys [25]. The fig-ures from the Zurich Study may be assumed to approximate to the actual rates much better.
Given that the Zurich study is a panel study, a major limitation is that all change effects are attrib-utable to age effects and period, i.e. historical effects. It is not possible to differentiate these effect types (what would be a matter of age–period–cohort anal-ysis if data would comprise several birth cohorts or age groups). At first glance, it is not clear from the given data whether the change of frequencies is a general issue in young adulthood or a specific issue of this panel and the specific historical context. More-over, specific limitations of the long-term panel design derive from the repeated examination with the same or similar questions, thus presumably better recall resulting in more affirmative answers. Finally, the problem of dropouts is more complex than in cross-sectional studies. It was shown that dropouts were more likely to have had extreme scores than intermediate scores on SCL-90-R [13]. Thus, overall measures like cumulative prevalence rates probably underestimate the actual values to some extent.
j Implications for further research
The difference in prevalence rates of health com-plaints between the Zurich Study and general health surveys provides two challenges. First, the difference will provide us a new perspective on minor complaints, but also on the processes determining self-reporting of health issues (perception of symp-toms, recall/repression, valuation, attribution). Additionally, we should look in more detail at the
super-healthy participants who never reported any complaints.
Second, future research should determine which (minimal) set of questions are required to distinctly improve the validity of self-reported complaints and symptoms in interviews where there is limited space and time. As the comparison with the degree of subjective suffering and the seeking of professional help indicated, each complaint or symptom might require specific additional information.
Finally, physical and psychological complaints are similar in some instances (variation of prevalence rates, degree of subjective suffering, help seeking). However, they systematically differ with respect to the change patterns between 1979 and 1999, for example, in help seeking behaviour. Interestingly, the differ-ences involve also the exchange patterns between different periods or time points. The differences in reporting of physical and psychological complaints might be much more prominent [26] than it is com-monly believed.
Conclusions
Even though many self-reported physical and psy-chological complaints are ubiquitous in young adulthood, the underlying dynamics and the impli-cations largely differ. It seems to be crucial whether respondents use somatic glasses or psychological lenses. Psychological complaints are a major deter-minant of subjective suffering.
j Acknowledgement The study was supported by the Swiss
Na-tional Science foundation (Grant # 32-50881.97).
References
1. Derogatis L (1977) SCL-90. Administration, scoring and pro-cedures manual-1 for the R (revised) version and other instruments of the Psychopathology Rating Scale Series, Chi-cago
2. Goldberg DP, Hillier VF (1979) A scaled version of the general health questionnaire. Psychol Med 9:139–145
3. Pennebaker JW (2000) Psychological factors influencing the reporting of physical symptoms. In: Stone AA, Turkkan JS, Bachrach CA, Jobe JB, Kurtzman HS, Cain VS (eds) The science of self-report. Implications for research and practice. Lawrence Erlbaum Associates, Mahwah, pp 299–316
4. Kolk AM, Hanewald GJ, Schagen S, Gijsbers van Wijk CM (2003) A symptom perception approach to common physical symptoms. Soc Sci Med 57:2343–2354
5. Myrtek M (1998) Gesunde Kranke – kranke Gesunde. Hans Huber, Bern
6. Barsky AJ (2000) The validity of bodily symptoms in medical outpatients. In: Stone AA, Turkkan JS, Bachrach CA, Jobe JB, Kurtzman HS, Cain VS (eds) The science of self-report. Implications for research and practice. Lawrence Erlbaum Associates, Mahwah, pp 339–362
7. Grootendorst PV, Feeny DH, Furlong W (1997) Does it matter whom and how you ask? Inter- and intra-rater agreement in the Ontario Health Survey. J Clin Epidemiol 50:127–135
8. Kroenke K, Spitzer RL, Williams JB (2002) The PHQ-15: validity of a new measure for evaluating the severity of somatic symptoms. Psychosom Med 64:258–266
9. Knauper B, Turner PA (2003) Measuring health: improving the validity of health assessments. Qual Life Res 12(Suppl 1):81–89 10. Angst J, Binder J (1980) Epidemiology of depressive symptoms in a 20-year-old Swiss population. Psychiatria Fennica 65–70 11. Binder J, Dobler-Mikola A, Angst J (1981) An epidemiological
study of minor psychiatric disturbances. A field study among 20-year-old females and males in Zu¨rich. Soc Psychiatr 16:31–41 12. Angst J, Dobler-Mikola A, Binder J (1984) The Zurich Study – a prospective epidemiological study of depressive, neurotic and psychosomatic syndroms. 1. Problem, methodolgy. Eur Arch Psychiatr Neurol Sci 234:13–20
13. Eich D, Ajdacic-Gross V, Condrau M, Huber H, Gamma A, Angst J, Rossler W (2003) The Zurich Study: participation patterns and symptom checklist 90-R scores in six interviews, 1979–99. Acta Psychiatr Scand Suppl:11–14
14. American Psychiatric Association (1994) Diagnostic and sta-tistical manual of mental disorders (DSM IV). American Psy-chiatric Association, Washington, DC
15. Bortz J, Lienert GA, Boehnke K (2000) Verteilungsfreie Methoden in der Biostatistik [Nonparametric methods in bio-statistics]. Springer, Berlin
16. Bishop YMM, Fienberg SE, Holland PW (1975) Discrete mul-tivariate analysis. MIT Press, Cambridge, MA
17. Vermunt JK (1997) lEM: a general program for the analysis of categorical data. Tilburg University
18. Metzger MH, Goldberg M, Chastang JF, Leclerc A, Zins M (2002) Factors associated with self-reporting of chronic health problems in the French GAZEL cohort. J Clin Epidemiol 55:48–59
19. Kroenke K, Spitzer RL (1998) Gender differences in the reporting of physical and somatoform symptoms. Psychosom Med 60:150–155
20. Hotopf M, Mayou R, Wadsworth M, Wessely S (1998) Temporal relationships between physical symptoms and psychiatric dis-order. Brit J Psychiatr 173:255–261
21. Chen H, Guarnaccia PJ, Chung H (2003) Self-attention as a mediator of cultural influences on depression. Int J Soc Psy-chiatr 49:192–203
22. Eriksen HR, Svendsrød R, Ursin G, Ursin H (1998) Prevalence of subjective health complaints in the Nordic European coun-tries in 1993. Eur J Public Health 8:294–298
23. Ladwig KH, Marten-Mittag B, Formanek B, Dammann G (2000) Gender differences of symptom reporting and medical health care utilization in the German population. Eur J Epidemiol 16:511–518
24. Terre L, Carlos Poston WS, Foreyt J, Jeor STS (2003) Do somatic complaints predict subsequent symptoms of depres-sion? Psychother Psychosom 72:261–267
25. Ajdacic-Gross V, Graf M (2003) Bestandesaufnahme und Daten zur psychiatrischen Epidemiologie. Schweizerisches Ges-undheitsobservatorium, Neuchatel
26. Hays RD, Stewart AL (1990) The structure of self-reported health in chronic disease patients. Psychol Assess 2:22–30