Rep. Prog. Phys. 66 (2003) 1699–1734 PII: S0034-4885(03)08878-X
The surface of Venus
Alexander T Basilevsky1and James W Head2
1Vernadsky Institute of Geochemistry and Analytical Chemistry, Russian Academy of
Sciences, Moscow, 119991, Russia
2Department of Geological Sciences, Brown University, Providence, RI 02912, USA
E-mail: [email protected] and James Head [email protected] Received 3 April 2003, in final form 10 July 2003
Published 10 September 2003
Online atstacks.iop.org/RoPP/66/1699
Abstract
Venus is a planet that is similar to Earth in terms of some important planetary parameters (size, mass, position in the solar system, presence of atmosphere) and different in terms of other, equally important ones (absence of an intrinsic magnetic field, large atmospheric mass, carbon dioxide composition of the atmosphere, lack of water, very high surface pressure and temperature). The surface morphology of Venus is dominated by the signatures of basaltic volcanism and tectonic deformation. Other geological processes such as impact cratering, aeolian activity and gravity-driven down-slope mass movement, although active on the planet, are certainly of subordinate significance. Venusian volcanism resulted in the formation of vast regional plains, occupying most of the planet’s surface, and in the building of numerous volcanic edifices. Venusian tectonic deformation was both compressional and extensional. Scales and, periodically, rates of Venusian volcanism and tectonism were comparable to those on Earth. But Venus shows no evidence of the global plate-tectonic style so dominant in the geology of Earth. The morphological record seen in the Magellan radar images of Venus extends back into geological history not earlier than about 0.5–1 billion years. It is represented by a sequence of units from highly tectonized tessera and densely fractured plains, whose compositional nature is unclear, through moderately deformed basaltic lava plains, and then to only locally deformed basaltic plains and edifices. In the beginning of the time period during which this sequence formed, the rates of volcanic and tectonic activity were significantly higher than in the subsequent time extending to the present. This change in volcanic and tectonic activity may correspond to a change in the convection style in the mantle of Venus.
Contents
Page
1. Introduction 1701
2. History of exploration 1702
3. Atmosphere 1703
4. Surface environment and close-up views of the surface 1707
5. Surface morphology and altimetry 1709
6. Geological terrains, features and processes 1712
6.1. Volcanic plains and related features 1712
6.2. Moderately and highly deformed terrains 1716
6.3. Coronae 1720
6.4. Impact craters 1721
6.5. Aeolian features 1723
6.6. Signatures of down-slope mass movement 1724
7. Age sequence of the terrains and features 1725
8. Age of the surface of Venus 1728
9. Interior structure and composition 1729
10. Conclusions 1730
Acknowledgments 1732
1. Introduction
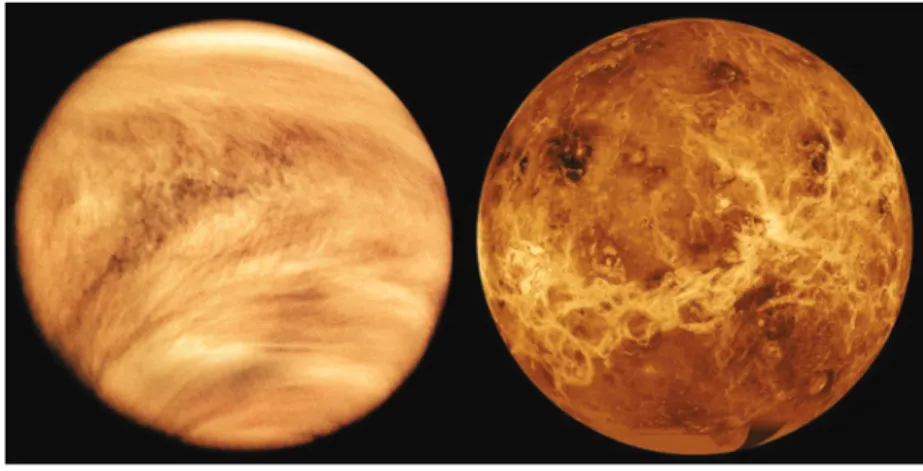
Venus, the second planet from the Sun, is a neighbour of Earth in the solar system. It orbits the Sun at a mean distance of 108 000 000 km, that is, 0.72 of the mean Earth–Sun distance. Thus, the Sun illuminates Venus with an intensity only a factor of 1.9 higher than that with which it illuminates Earth. A significant part of this energy, however, is reflected back by the optically bright clouds of this planet. The radius of Venus is 6051.8 km (0.95 of Earth’s radius) and its mass is 4.87× 1024kg (0.814 of Earth’s). Venus’s bulk density, 5.24 g cm−3, and surface gravity, 8.87 m s−2, are 0.95 and 0.907 of the corresponding parameters of Earth. Venus has a cloudy atmosphere that hides the planet’s surface from optical observations from outside (figure 1). In these characteristics, Venus resembles Earth, and thus in the pre-space era there were expectations that the Venus surface environment might be similar to that of Earth (Colin 1983).
But space era studies showed that this was not the case: unlike Earth, Venus lacks any detectable magnetic field. The average surface temperature on this planet is much higher (about 740 K) than on Earth. Venus’s atmosphere is composed predominantly of CO2and its
average surface atmospheric pressure is much higher (about 93 bar). Its clouds are made not of particles of liquid or solid water, as Earth’s clouds are. Venus’s orbital period (a year) is 225 Earth days. Its rotational period (in a retrograde manner) is 243 Earth days. The combination of these two rotations makes the solar day on Venus∼117 Earth days long, so any given place on the planet (except the poles) is Sun-illuminated for 58.5 Earth days and stays in darkness for another 58.5 days (Colin 1983). Venus’s albedo, as determined by reflection of the cloud layer, is very high: the geometric albedo is∼0.84 and the spherical albedo ∼0.75 (Moroz 1983).
This combination of similarities and dissimilarities with Earth makes Venus very interesting for comparisons among the so-called terrestrial planets (Mercury, Venus, Earth, Mars) with the goal of understanding the general rules of planetary geology and the evolution of the planets.
Figure 1. Left: Venus as it was seen by the UV imager of the Pioneer Venus orbiter on February 26,
1979. TheV-shaped structure of the cloud pattern is visible only in blue and near UV. Right: mosaic of Magellan radar images of Venus centred at the equator and longitude 180˚E. Long bright features are heavily fractured rift zones. Dark spots, e.g. near the image top, are friable fine-grained deposits associated with geologically young impact craters.
2. History of exploration
Being a bright object in the morning/evening sky, Venus has occupied the interest of humans, at least for millennia, becoming a significant component of early pre-telescopic astronomy and astrology. Telescopic observations by Galileo in 1610 revealed the lunar-like phases of this celestial body. In the late 1700s the Russian scientist Lomonosov, observing the transit of Venus across the Sun, correctly interpreted a grey halo seen around the planet as evidence of an atmosphere. This interpretation, combined with the measurements of the diameter of Venus, led to the initial concept of Venus as Earth’s twin planet. The significant brightness of the planet and the lack of visible surface features suggested the presence of dense clouds, and led to the assumption that the clouds were made of water vapour. Later spectroscopic studies showed, however, that the atmosphere was dominated by CO2, rather than water, and
the clouds were not made of water droplets or snowflakes but were droplets of concentrated sulfuric acid.
In the 1960s, approximately simultaneously with the first space missions to Venus, early Earth-based radar observations of Venus discovered its slow and retrograde rotation. At about the same time, the radio-telescope observations of Venus provided evidence of its very high surface temperature (see summary in Cruikshank (1983)). But these data were met with scepticism and, as a result, the design of early Soviet landers sent to this planet (e.g. Venera 4) considered the possibility of landing in a water ocean.
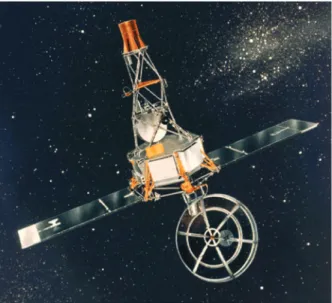
The current knowledge of Venus is based predominantly on data acquired by spacecraft observations. The first attempts to send space missions to Venus began in 1961 (Friedman and Kraemer 1999; see also http://nssdc.gsfc.nasa.gov/planetary/projects.html). Figures 2 and 3 show, respectively, the spacecraft of two landmark missions: US Mariner 2, the first succesful planetary mission, and the Soviet Venera 9 lander, whose TV panoramas allowed people to see the surface of Venus for the first time. The missions targeting Venus (e.g. Soviet Veneras or the US Magellan) and missions that made scientific observations of Venus when they flew
Figure 2. Artist’s concept of the Mariner 2 spacecraft. The spacecraft (mass 203 kg) had microwave
and IR radiometers, detectors of cosmic dust, solar plasma, high-energy particles and magnetic fields. Courtesy of NASA.
Figure 3. Artist’s concept of the Venera 9 lander. The lander (mass 1560 kg) had a panoramic
TV camera, a gamma-spectrometer to measure the content of K, U and Th in surface material, a gamma densitometer to measure the bulk density of the surface material, three photometers, two spectrometers, an accelerometer and an anemometer. The picture shows the ‘hat-like’ upper part of the lander (the ‘brim’ worked as the descent parachute), the middle thermally insulated and pressurized spherical part (with TV camera view-port at its upper right), and the supporting ring with which the lander touched the surface. The gamma-densitometer device deployed on the surface is also shown. Courtesy of the Russian Academy of Sciences.
by it on the way to other bodies in the solar system (e.g. Galileo and Cassini) are listed in chronological order in table 1. Missions that targeted Venus but failed to reach Earth parking orbit or to leave it (e.g. Soviet Tyazhelyy Sputnik, 4 February 1961, or the US Mariner 1, 22 July 1962) are not listed in table 1.
The European mission Venus Express based on spare parts and instruments of the European Mars Express mission (launched in June 2003; http://www.esa.int/export/esaCP/Netherlands. html) is under development now. Its major goal is a study of Venus’s atmosphere by the set of instruments on board the orbiter. The Venus Express launch is scheduled for 2005. Within the planetary science community, from time to time, different options of future missions to Venus are considered, including thermal resisting spacecraft for long-term seismic observations on the Venus surface, diving spacecraft which should reach the surface, take samples and make on-surface observations, then ascend to the higher, cooler part of the atmosphere to make sample analysis, and even missions that involve sample return from Venus. None of them has yet reached a status higher than just a proposal.
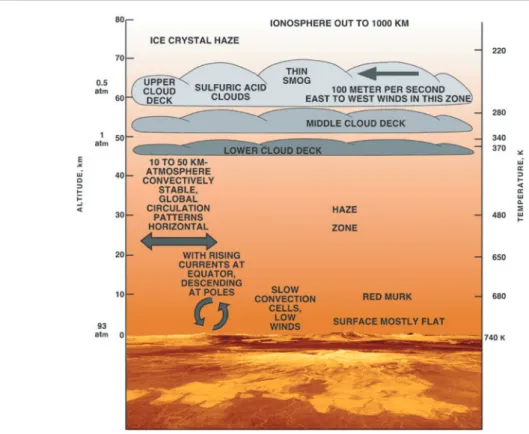
3. Atmosphere
Among the terrestrial planets Venus has the most massive atmosphere (figure 4). If it were condensed to the state of stone with a density of about 3 g cm−3, the thickness of such a ‘stony’
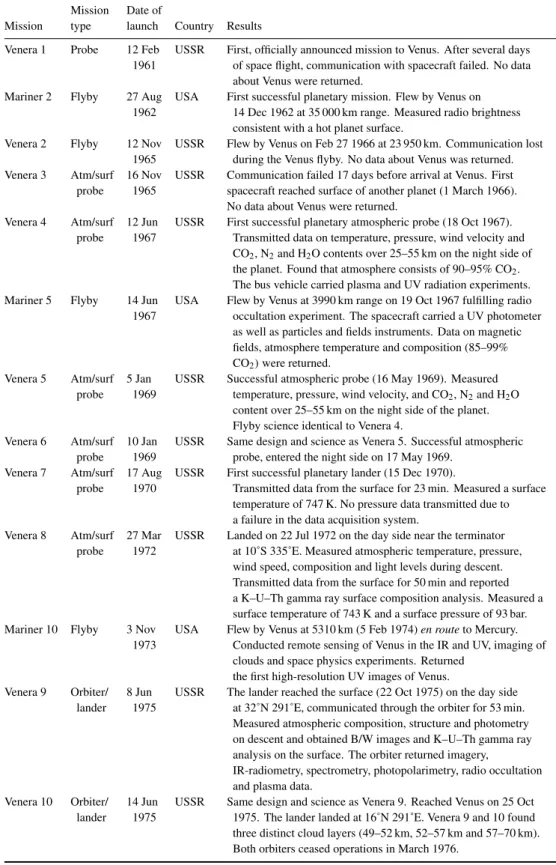
Table 1. List of missions that targeted Venus and missions that made scientific observations of
Venus on their way to other planets. Mission Date of
Mission type launch Country Results
Venera 1 Probe 12 Feb USSR First, officially announced mission to Venus. After several days 1961 of space flight, communication with spacecraft failed. No data
about Venus were returned.
Mariner 2 Flyby 27 Aug USA First successful planetary mission. Flew by Venus on 1962 14 Dec 1962 at 35 000 km range. Measured radio brightness
consistent with a hot planet surface.
Venera 2 Flyby 12 Nov USSR Flew by Venus on Feb 27 1966 at 23 950 km. Communication lost 1965 during the Venus flyby. No data about Venus was returned. Venera 3 Atm/surf 16 Nov USSR Communication failed 17 days before arrival at Venus. First probe 1965 spacecraft reached surface of another planet (1 March 1966).
No data about Venus were returned.
Venera 4 Atm/surf 12 Jun USSR First successful planetary atmospheric probe (18 Oct 1967). probe 1967 Transmitted data on temperature, pressure, wind velocity and
CO2, N2and H2O contents over 25–55 km on the night side of
the planet. Found that atmosphere consists of 90–95% CO2.
The bus vehicle carried plasma and UV radiation experiments. Mariner 5 Flyby 14 Jun USA Flew by Venus at 3990 km range on 19 Oct 1967 fulfilling radio 1967 occultation experiment. The spacecraft carried a UV photometer
as well as particles and fields instruments. Data on magnetic fields, atmosphere temperature and composition (85–99% CO2)were returned.
Venera 5 Atm/surf 5 Jan USSR Successful atmospheric probe (16 May 1969). Measured probe 1969 temperature, pressure, wind velocity, and CO2, N2and H2O
content over 25–55 km on the night side of the planet. Flyby science identical to Venera 4.
Venera 6 Atm/surf 10 Jan USSR Same design and science as Venera 5. Successful atmospheric probe 1969 probe, entered the night side on 17 May 1969.
Venera 7 Atm/surf 17 Aug USSR First successful planetary lander (15 Dec 1970).
probe 1970 Transmitted data from the surface for 23 min. Measured a surface temperature of 747 K. No pressure data transmitted due to a failure in the data acquisition system.
Venera 8 Atm/surf 27 Mar USSR Landed on 22 Jul 1972 on the day side near the terminator probe 1972 at 10˚S 335˚E. Measured atmospheric temperature, pressure,
wind speed, composition and light levels during descent. Transmitted data from the surface for 50 min and reported a K–U–Th gamma ray surface composition analysis. Measured a surface temperature of 743 K and a surface pressure of 93 bar. Mariner 10 Flyby 3 Nov USA Flew by Venus at 5310 km (5 Feb 1974) en route to Mercury.
1973 Conducted remote sensing of Venus in the IR and UV, imaging of clouds and space physics experiments. Returned
the first high-resolution UV images of Venus.
Venera 9 Orbiter/ 8 Jun USSR The lander reached the surface (22 Oct 1975) on the day side lander 1975 at 32˚N 291˚E, communicated through the orbiter for 53 min.
Measured atmospheric composition, structure and photometry on descent and obtained B/W images and K–U–Th gamma ray analysis on the surface. The orbiter returned imagery,
IR-radiometry, spectrometry, photopolarimetry, radio occultation and plasma data.
Venera 10 Orbiter/ 14 Jun USSR Same design and science as Venera 9. Reached Venus on 25 Oct lander 1975 1975. The lander landed at 16˚N 291˚E. Venera 9 and 10 found three distinct cloud layers (49–52 km, 52–57 km and 57–70 km). Both orbiters ceased operations in March 1976.
Table 1. (Continued)
Mission Date of
Mission type launch Country Results
Pioneer 12 Orbiter 20 May USA Started to orbit Venus on 4 Dec 1978. Conducted remote sensing of (Pioneeer 1978 the middle atmosphere and in situ measurements in the upper Venus atmosphere. Made first radar mapping of another planetary Orbiter) surface from a spacecraft. Found evidence for lightning
but no magnetic field. Worked until 8 Oct 1992.
Pioneer 13 Bus/ 8 Aug USA The bus dispatched four probes and returned data on the ionosphere (Pioneeer probe 1978 before burn-up. The probes on their descent returned data Venus on atmospheric structure, chemical and isotope composition, fluxes Probes) of radiation, and cloud physics. Anomalies in the
relict noble gas abundance and D/H ratio were found. Venera 11 Flyby/ 9 Sep USSR Landed on the day side at 14˚S 299˚E (25 Dec 1978). Measured
lander 1978 atmospheric temperature, pressure, wind velocity, spectra of short wavelength radiation, chemical and isotope composition, aerosols and thunderstorm activity.
The flyby bus carried a UV spectrometer, plasma instruments and relayed communications from the lander.
Venera 12 Flyby/ 14 Sep USSR Same design and science as Venera 11. Landed on the day side lander 1978 at 7˚S 294˚E (21 Dec 1978).
Venera 13 Flyby/ 30 Oct USSR Landed on the day side at 7.5˚S 303.0˚E (1 Mar 1982). Conducted lander 1981 atmospheric and cloud science, colour imagery of the
surface and XRF analysis of the surface material.
Venera 14 Flyby/ 4 Nov USSR Same design and science as Venera 13. Landed on the day side lander 1981 at 13.4˚S 310.2˚E (5 Mar 1982).
Venera 15 Orbiter 2 Jun USSR Entered Venus orbit on 10 Oct 1983. Returned radar images of the 1983 planet from 30˚N to the north pole at 1–2 km resolution. The
middle atmosphere and clouds were examined by IR spectrometry. Venera 16 Orbiter 7 Jun USSR Same design and science as Venera 15. Entered Venus orbit
1983 on 14 Oct. The IR instrument failed.
Vega 1 Flyby/ 15 Dec USSR Conducted a Venus flyby (11 June 1985) for gravity assistance to lander/ 1984 redirect the spacecraft to Halley’s comet. During flyby, deployed balloon an entry vehicle with a balloon and lander on the night side
of the planet at 8.1˚N 176.7˚E. The lander conducted
atmospheric science experiments on descent and soil analysis with a gamma-spectrometer (XRF analysis failed) on the surface. The balloon floated for 48 h over approximately
10 000 km at 54 km altitude measuring atmosphere dynamics. Vega 2 Flyby/ 21 Dec USSR Same design and science as Vega-1. Deployed its balloon and lander
lander/ 1984 on the night-side Venus atmosphere at 7.2˚S 179.4˚E on 15 Jun 1985 balloon with similar results. Lander and balloon conducted the same
measurements as Vega 1 with both gamma ray and XRF analyses successful.
Magellan Orbiter 4 May USA Entered orbit on 10 Aug 1990 and conducted high-resolution 1989 global radar mapping: SAR (120–220 m per pixel), altimetry,
emissivity as well as gravity measurements.
Also conducted radio occultations for atmospheric science. Purposely terminated in the atmosphere on 11 Oct 1994. Galileo Flyby 18 Oct USA Flew by Venus on 10 Feb 1990 using a gravity assist en route
1989 to Jupiter. Returned imagery and spectroscopy of near-infrared night emission from the atmosphere below the cloud deck. Cassini Flyby 15 Oct USA Flew by Venus twice, on 26 Apr 1998 and 24 Jun 1999,
1997 using gravity assist en route to Saturn. Returned remote imaging and spectroscopy of the atmosphere.
Figure 4. Schematic view of the Venusian atmosphere, modified from figure 5-15 of Fimmel
et al (1983).
atmosphere would be about 300 m. For comparison, the ‘stony’ atmosphere of Earth would be about 3 m thick, of Mars, about 10 cm thick. The major component of the atmosphere of Venus is CO2 (96.5 mol%). Second in abundance is N2 (3.5%). As minor admixtures, are
noble gases—He, 12; Ne, 7; Ar, 70; Kr, 0.2 ppm (parts per million)—as well as a number of other components, whose abundances are functions of altitude, the concentration of H2O
below the cloud layer is∼30 ppm, and becomes much lower above. The concentration of SO2 below the cloud layer is∼200 ppm, while above the clouds its concentration is much
lower and variable. The concentration of COS is estimated to be 55 and 0.5 ppm at the surface and at 35 km altitude, respectively. The concentration of CO below the clouds varies from 12 to 40 ppm. It is very possible that the contents of these mutually reacting gases, which determine the atmosphere redox potential and thus control the chemical weathering of surface materials, also vary as a function of the time of day. The deuterium/hydrogen ratio in the Venusian atmosphere is ∼0.024, that is a factor of about 150 higher than in the water of Earth’s oceans. This is considered to be an indication that early in the history of Venus, the planet had more water, which was subsequently lost (Donahue and Russell 1997).
The clouds of Venus, although completely shrouding the planet, are not as dense as those on Earth. Their optical visibility is about 1 km. It was mentioned above that the clouds of Venus are composed of droplets of concentrated sulfuric acid. This is well established only for the upper cloud layer. Particles composing the middle part of the cloud layer may not be droplets but crystals, which contradicts the theory of sulfuric acid composition. The results of x-ray fluorescence analysis of the aerosol particles showed the presence not only of sulfur
but also of chlorine (Surkov 1985). The clouds’ colour is yellowish, possibly due to a minor admixture of S or FeCl3 (Donahue and Russell 1997). As can be seen from the cratering
record of Venus (see below), approximately every 1 million years. Venus suffers from high-velocity impact by a large enough asteroid or comet, leading to the formation of an impact crater, a phenomenon that resembles, in some respects, a nuclear explosion. This should lead to intrusion of the ‘fire-ball’ laden with debris of planetary crust matter into the clouds and above, and to chemical reactions between these two types of material, which usually are not in direct contact.
The wind velocity at the upper boundary of the cloud layer is about 100 m s−1. This is the so-called zonal wind blowing from east to west, and this wind is responsible for the latitudinal movement of clouds visible from space: these rotate around the planet with a period of about four terrestrial days (see summary in Hunten (1999)). In impact cratering events, settling of the fine-grained fraction of the crater ejecta through the fast moving atmosphere leads to the formation of radar-dark parabolae now seen in association with some craters (see below). Closer to the surface, the wind velocity decreases, reaching less than a few metres per second at the level of the highest mountains of the planet. Near-surface winds are one of the major factors in exogenic resurfacing on Venus.
4. Surface environment and close-up views of the surface
At the mean surface level (∼6051.5 km above the planet’s centre of mass) the atmospheric pressure is 93 bar, and the air density is 67 kg m−3 (Kuzmin and Marov 1974, Seiff 1983). At the top of Maxwell Montes, the highest mountain massif on the planet (+11 km), the atmospheric pressure is 45 bar, and the air density is 36 kg m−3, while in deep depressions (−2 km) the pressure and air density are 110 bar and 74 kg m−3, respectively. The temperature at the mean level of the Venusian surface is close to 740 K and its day/night and equator/pole differences barely exceed 1–2 K. As mentioned above, the temperature changes with altitude by about 8 K km−1. So, at the top of Maxwell Montes it should be∼650 K and in deep depressions,∼755 K. These large ranges in surface temperature, pressure and air density at different altitude levels provide the basis for the differences in chemical weathering and aeolian activity in different hypsometric provinces of Venus.
Direct (anemometry and spacecraft Doppler tracking) and indirect (wind noise) measurements showed that at the Venera/Vega landing sites (on plains, close to the mean altitude level) at a height of 1 m above the surface the wind velocity is about 0.3–1 m s−1. Bearing in mind the very high density of the near-surface air, the mechanical load of the wind on Venusian surface features is rather large. Daytime illumination of the Venusian surface by solar light scattered in the cloud layer and the lower atmosphere is estimated to be 5× 10³– 104lx (Ksanfomality 1985). Due to preferential atmosperic absorption of the blue component of solar irradiation, the light reaching the planet’s surface is reddish. Venus’s solid surface is very dark. Its reflectivity in the visible range at the Venera landing sites was found to be only 0.03–0.1 (see summary in Ksanfomality (1985)).
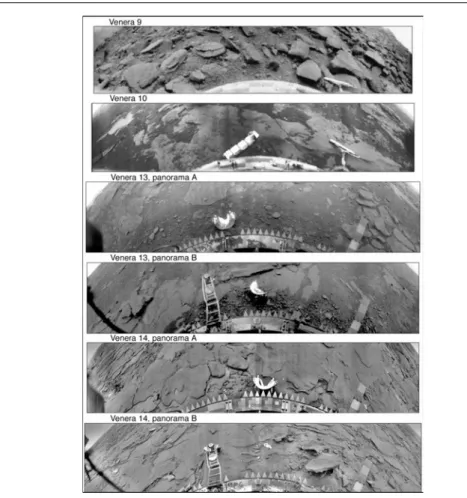
Close-up views of Venus’s surface were taken by a TV panoramic camera on board the Venera 9, 10, 13 and 14 landers (figure 5). Analysis of the lander telemetry and panoramas (see summaries in Florensky et al (1977); Basilevsky et al (1985)), as well as Magellan radar images taken later (Basilevsky et al 1992, Abdrakhimov and Basilevsky 2002) of the landing sites showed that Venera 9 landed on a steep slope of a tectonic trough covered with talus with many platy rock fragments, while the other three spacecraft landed in the plains, whose surface consisted of low-relief outcrops of platy rocks, with soil in local depressions between them.
Figure 5. TV panoramas sent to Earth by the Venera 9, 10, 13 and 14 landers. The optical axis of
each camera was inclined 50˚ from the vertical, so, in the middle part of each panorama the close-up (1–2 m from the camera) view was received while at the right and left ends, the camera looked at the horizon. TheT-shaped structure seen on the right of panoramas of Venera 9 and 10 is the gamma densitometer. Its distant (transversal) part is 40 cm long. The bright linear and segmented structure near the centre of the Venera 10 panorama is a view-port cover. Its length is 40 cm, width 10 cm. The Venera 13 and 14 panoramas show the view-port covers of different, arcuate design; they are 20 cm in diameter. The photometric colour standard on the right of the Venera 13–14 panoramas is 40 cm long. The trellis girder (centre-left of the Venera 13B and Venera 14B panoramas) is 60 cm long (see, e.g. Basilevsky et al (1985)).
Soil occupies more than half of the area in the closest vicinities of the Venera 9, 10 and 13 landers and only a few per cent of the area at the Venera 14 site (figure 5). It is darker than rocks. Its reflectivity is estimated to be 0.03–0.05 while that of rocks is 0.05–0.1. The soil is composed of particles finer than the camera resolution limit, which in the closest vicinities of the landers was∼7 mm for Venera 9–10 and ∼4 mm for Venera 13–14. During the Venera 13 touchdown event, clods of soil were thrown up onto the upper surface of the spacecraft supporting ring (see the dark spots on the ring close to the view-port cover on Venera 13 panorama A). Five sequential images of this place taken within a 68 min interval showed that the spots were shrinking with time, obviously due to deflation by near-surface wind (Selivanov et al 1982). Spectrophotometer observations taken by Venera 9, 10, 13 and 14 showed that a cloud of dust was formed at the touchdown (Ekonomov et al 1980, Moroz et al 1982), which requires soil particles smaller than∼0.02 mm (Ronca and Green 1970). Garvin (1981) interpreted the zone
of darkening on the Venera 10 panorama as another piece of evidence for the formation of the dust cloud at lander touchdown. Centimetre-sized pieces of rocks are also seen within the soil areas. They may represent the initial stage of the process of degradation of rock into soil and may be formed partly as a result of the lander impact on the surface material.
The most striking feature of the rocks at all four sites is their prominent fine layering. Images of the Venera 14 site, where soil is almost absent, show that the thickness of some layers is close to the image resolution and that the surfaces of some layers are brighter than most of the observed surfaces. The topmost layers show the presence of close to vertical fractures whose planimetric outlines vary from close-to-linear to very curvilinear (figure 5). At the Venera 13 and 14 sites the bearing capacity of the rocks was measured by two techniques (see summary in Basilevsky et al (1985)). It was found to be only 3–10 kg cm−2; this implies that the rock material is porous. This, in turn, implies that it may be weakly lithified aeolian sediment (e.g. composed of debris initially produced by meteorite impact) or volcanic tuff (Nikolaeva 1989). Other models of the origin of these rocks such as thin layers of lava and weathering- or cooling-caused rock exfoliation are also possible (Garvin et al 1984). Pieters
et al (1986) analysed the lander colour images of the surface of Venus and removed the
orange-coloured influence of the Venus atmosphere, showing that the surface at visible wavelengths is dark and without significant colour.
Gamma spectrometry and x-ray fluorescence spectrometry analyses showed that the surface material at the Venera 9, 10, 14 and Vega 1, 2 sites is chemically close to tholeiitic basalts, while at the Venera 8 and 13 sites it is close to alkaline basalts (Barsukov 1992, Surkov 1997). The mineral composition of the surface material has not yet been determined by any conclusive technique. Thermodynamic calculations show that basaltic materials of Venus’s surface should react with atmospheric gases to form magnetite, haematite (mostly in the lowlands), quartz, magnesite, anhydrite, pyrite (mostly in the highlands), enstatite and albite (Zolotov and Volkov 1992).
5. Surface morphology and altimetry
Although major types of large-scale surface morphology were discovered from radar mapping by Pioneer Venus Orbiter and Venera 15/16 missions, the most reliable knowledge in this field was acquired by the Magellan mission. Before we begin a description of the different Venusian terrains and landforms we briefly mention the nature of the radar images that will be described (Ford et al 1993). All of them were taken with side-looking radar and are rather similar to TV or photographic images but instead of optical brightness they show radar brightness (more scientifically termed back-scattering cross-section). The latter depends on the ability of a given surface to reflect radiowaves. This ability is a function of the properties of the surface materials. For example, metals and semiconductors reflect radiowaves better than most silicates and any compact material reflects better than a porous one of the same composition. The ability to reflect radiowaves, especially in the side-looking mode, depends also on the surface roughness. If the surface is rough enough it has many ‘facets’ reflecting back towards the radar. If the surface is smooth it reflects effectively, but not in the direction of the radar. So what looks bright on side-looking radar images is physically reflective and/or has a rough (at the scale of the radiowaves used) surface and what looks dark has low reflectivity (e.g. porous dust) and/or has a smooth surface.
The Magellan images and altimetry data show that the surface of Venus is dominated by a mosaic of obviously volcanic plains, whose surface lies close to the mean planetary radius (MPR = 6051.5 km above the planet’s centre of mass) and covers about 80% of the surface. Among the plains, low, broad ridges form belts extending for thousands of kilometres
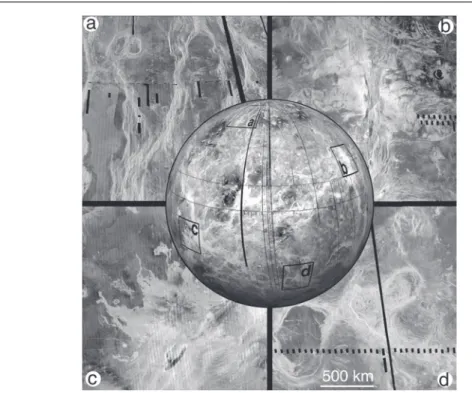
Figure 6. Examples of typical terrain types of Venus as seen on the Magellan images (a)–(c) and
their positions shown on a global mosaic centred at 240˚E: (a) belts of low ridges (brighter linear features) and neighbouring regional plains (darker background); (b) tessera terrain (brighter) of Beta Regio topographic rise cut by a rift zone; (c) Maat Mons volcano and its radar-bright lava flows superposed on regional plains; (d) coronae of the Parga Chasmata rift zone. Scale bar is relevant for (a), (b), (c) and (d) parts of the figure. Vertical stripes seen on (a) and (c) as well as on some of the following figures are the individual-orbit images, each 20 km wide. Dark stripes are gaps in data. Here, and in all following images, north is at the top of the image.
and suggest gentle folding and shortening (figure 6(a)). The surfaces of the majority of the plains are complicated with networks of wrinkle ridges, also suggesting compressional deformation.
Among the plains we can also see ‘islands’ and ‘continents’ of very highly deformed terrain (the tessera revealed by the Venera 15/16 observations) standing above MPR and forming about 8% of the surface (figure 6(b)). Ishtar Terra (60–70˚N, 300–30˚E) is formed mostly of tessera terrain. In its western part is seen a concentric structure of very high linear mountain belts embracing a high standing volcanic plateau with two superposed large volcanic calderae. One of the linear mountain belts, Maxwell Montes, has the planet’s highest peak, 11 km above the MPR. Large rift valleys, whose floors are often significantly below the MPR, run across the surface of Venus and converge on broad rises such as Atla Regio and Beta Regio (figure 6(b)). The total area of rifts is estimated to be about 8% of the planet’s surface.
More than a hundred isolated large (100–1000 km in diameter) gently sloping shield volcanoes pepper the planet and occupy, in total, about 4% of the surface (figure 6(c)). Smaller volcanic constructs are significantly more abundant. Hundreds of concentric ringed features called coronae are distributed across the surface, most with diameters less than 300 km, but a few exceeding a thousand kilometres in diameter. Many coronae are isolated, but others form chains thousands of kilometres long, typically associated with rift valleys (figure 6(d)).
In general, the terrains of Venus can be subdivided into three major domains: (1) volcanic plains forming the vast majority of the planet (e.g. Atalanta, Guinevere, Lavinia Planitiae), (2) intensely deformed tessera, forming upland plateaus (e.g. Fortuna, Ovda and Tellus), and (3) broad topographic rises (e.g. Beta, Atla, Bell Regiones) with associated volcanoes and converging rifts.
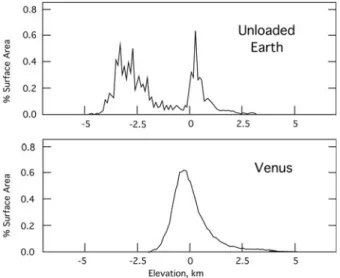
The synoptic map of the global topography of Venus based on the Magellan radar survey is shown in figure 7. The histogram of the global altitude–frequency distribution on Venus in comparison with that of Earth, is given in figure 8. It is seen that this distribution on Venus is unimodal, thus being distinctly different from the bimodal distribution of the Earth. The latter
Figure 7. Hypsometric map of Venus. The simple cylindrical projection of the map enlarges
high-latitude structures. Names of the most prominent highlands of the planet are shown. Source is GTDR set from http://pds.jpl.nasa.gov.
Figure 8. Differential hypsograms for global topographic data for Earth (top) and Venus (bottom).
Each plot illustrates the frequency of occurrence of surface elevations grouped in 100 m elevation increments. For Earth, 0 km elevation refers to sea level; note that ocean load has been removed; for Venus, elevations are referenced to the MPR, 6051.84 km; from Sharpton and Head (1985) with modification.
is considered to be due to the presence on Earth of two types of crustal material: basaltic crust of the oceanic floor and ‘granitic’ crust of the continents. The unimodal altitude–frequency distribution of Venus is considered by some researchers as an indication of the predominance of one type of crustal material, basalt, on this planet (Sharpton and Head 1985).
6. Geological terrains, features and processes 6.1. Volcanic plains and related features
About 80% of the planet’s surface is plains. The most abundant among these are the so-called regional plains, which occupy about 70% of the surface and are represented by two major varieties (Basilevsky and Head 2000). The predominant variety is the so-called plains with wrinkle ridges (figure 9). These have a rather smooth (at the scale of observation) surface, often with flow-like features, which are obviously solidified lava flows (Head et al 1992). These plains are deformed with a network of relatively narrow (1–2 km), gentle-sloping ridges of tens to 100–200 km long, which are typically designated by the term ‘wrinkle ridges’. Wrinkle ridges are the result of ‘wrinkling’ of the surface by moderate horizontal compression. Large areas occupied by flow-like features (100–200 km long flows are frequent) and very gentle slopes, along which the flows were emplaced, indicate high-yield eruptions of liquid, non-viscous, probably basaltic lava which formed plains, subsequently deformed by wrinkle ridges. The suggestion of basaltic composition of the lava is supported by analysis of the Magellan images for the landing ellipses of the Venera/Vega landers. This analysis showed that the landing sites, where basaltic composition was measured (Venera 9, 10, 13, Vega 1, 2), are dominated by plains with wrinkle ridges (Abdrakhimov and Basilevsky 2002).
Within these plains occur sinuous channels 2–5 km wide and hundreds of kilometres long (Baker et al 1997). One of the channels, named Baltis Vallis, is 6800 km long, a distance that is about 16 of the circumference of Venus. It is not clear yet how these channels were formed. The channel morphology implies erosion by some liquid. The most popular point of view is that the channels are the result of thermal erosion by flowing lava. Similar channels (although not as long) are known on the Moon (e.g. at the Apollo 15 landing site) and even smaller analogues are known from the flanks of some volcanoes of Earth. The major puzzle of
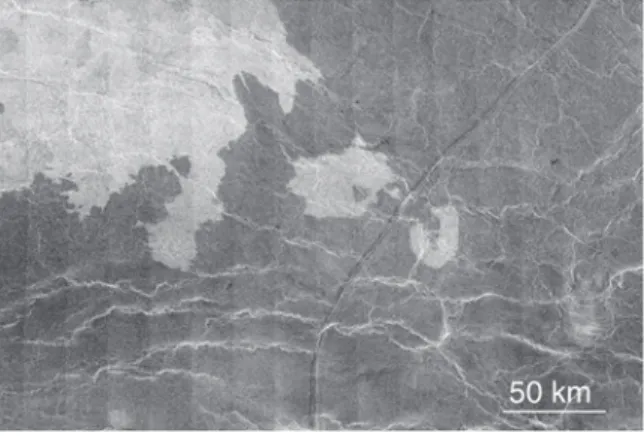
Figure 9. Two subunits of plains with wrinkle ridges in Atalanta Planitia. The older unit is
moderately dark (smoother surface) on the radar image while the young one is bright (rougher surface). The older subunit is cut by the Baltis Vallis channel (from upper right to bottom centre). Both subunits and the channel are deformed by wrinkle ridges. The area is centred at 46.7˚N, 160˚E.
Figure 10. Plains with shields (central and right parts of the image) and neighbouring plains with
wrinkle ridges (left) in Aino Planitia. The field of small volcanic shields composing this locality of shield plains is deformed by fractures, many of which do not extend into the neighbouring plains with wrinkle ridges. This shows that the plains with shields were formed and fractured before the plains to the left were emplaced and deformed by wrinkle ridges. The area is centred at 51˚S, 75˚E.
the Venusian channels is their great length. Calculations show that lava flowing on the surface of Venus should solidify rather quickly, thus terminating the formation of the channel. The solidification should be slower than on Earth, but still relatively rapid because the temperature of the surface and near-surface air (∼740 K) is still freezing cold for basaltic lava, which solidifies at∼1400 K.
Another, less abundant variety of regional plains is represented by the so-called shield plains (figure 10), which usually form fields of a few hundred kilometres across. Their surface is peppered with gentle-sloping volcanic shields 5–15 km in diameter. Coalescing flanks of the shields form most of the plains’ surface. Typically, shield plains are also wrinkle-ridged, and quite often they are seen as low islands among the lavas of the plains with wrinkle ridges partly overlying them. These varieties of shield plains are older than at least the upper parts of the lava accumulations forming plains with wrinkle ridges. However, sometimes, separate shields and even fields of the shields, are clearly superposed on the wrinkle-ridged plains and on wrinkle ridges themselves, so they are younger than the plains with wrinkle ridges. The gentle slopes of the shields imply that they are made of non-viscous, probably basaltic lava.
However, the Venera 8 lander, whose landing ellipse is dominated by the shield plains (figure 11), showed that the surface material of that location contains significantly more potassium, uranium and thorium than typical terrestrial and Venusian basalts. Thus, some parts of the Venusian shield plains are composed of alkaline basalts, or even geochemically more evolved rocks such as andesites or rhyolites. This suggestion seems to agree with the observation that in association with shield plains, sometimes steep-sloped volcanic domes of a few to several tens of kilometres in diameter are observed (Ivanov and Head 1999). The high steepness of their slopes is believed to be due to the high viscosity of the lava composing them. One of the possible explanations of the high viscosity of the lava is that it is geochemically evolved, with a rather siliceous composition. One such steep-sided dome is observed within the landing ellipse of Venera 8.
About 10–15% of Venus’s surface is occupied by younger volcanic units, which are obviously superposed on regional plains and are not deformed by wrinkle ridges. Many of them consist of numerous volcanic flows with lobate morphology. These lobate flows either form rather horizontal lobate plains or are piled up into volcanic constructs. Other representatives
Figure 11. Landing site of Venera 8. Most of the area is occupied by shield plains. Subordinate in
abundance are areas of radar-dark smooth plains and radar bright lobate flows. At the top centre, a steep-sided dome is seen. The centre of the landing ellipse is at the image bottom, right of the radar dark feature. The area is centred at 10.2˚S, 335.2˚E.
Figure 12. The northern part of Mylitta Fluctus, one of the largest (400×1000 km) fields of lobate
lava flows. The flows emanate from the Tarbell Patera volcanic structure located south of the image on the Kalapahoa Linea rift zone. Lobate flows are superposed on darker plains with wrinkle ridges (left centre) and embay fields of shield plains (upper right) and ridge belts (lower right). The area is centred at 51.4˚S, 353˚E.
of these younger plains form fields without prominent lobate morphology. They usually have a smooth-looking surface and are called ‘smooth plains’.
Lobate flows usually form fields consisting of suites of individual flows of variable radar brightness which implies a variability of their surface texture (figure 12). The individual flows are of tens to 200–300 km long and from a few to a few tens of kilometres wide. Analysis of the Magellan images showed that on the surface of Venus there are more than 200 flow fields, each with an area larger than 50 000 km2(Crumpler et al 1997). These are lava fields
not directly associated with volcanic mountains. The sources of these lava fields are often associated with rift zones. Some of these young lava fields are associated with coronae. The considerable length of the flows on an almost horizontal surface implies low viscosity of the lava. This, in turn, is usually considered evidence of a basaltic composition.
More than 100 volcanic constructs larger than 100 km in diameter and about 300 constructs of 20–100 km in diameter have also been identified on Venus (Crumpler et al 1997, Magee and
Figure 13. The northern part of Maat Mons, the highest volcano of Venus, made of accumulations
of lobate flows. To the north and west, Maat lava flows are superposed on darker plains with wrinkle ridges. The grooved terrain seen at the lower right is part of the Dali Chasma rift zone. The area is centred at 2˚N, 195˚E.
Head 2001). Most of them are clearly superposed on regional plains. Typically, they have very gentle slopes that are covered with lobate flows and evidently these constructs are built from the lobate flows. Some of the flows extend far into the surrounding regional plains. The highest volcano on Venus, Maat Mons, stands about 9 km above the MPR (figure 13). Lava flows radiating from Maat Mons cover an area about 800 km across. These large (>100 km) and intermediate-sized (20–100 km) volcanoes are morphologically very similar to basaltic shield volcanoes on Earth, although the latter are on average smaller than their Venusian counterparts. Measurements made by the Venera 14 lander, whose landing ellipse is dominated by lava flows associated with the Panina Patera volcanic construct, showed that the composition of the surface material here is basaltic (Barsukov 1992, Surkov 1997). Slopes of the majority of Venusian volcanoes made of lobate flows are so gentle (typically, no more than 1–2˚) that the volcano-forming lobate flows and lobate flows having no direct association with volcanic mountains are combined into a single unit called ‘lobate plains’.
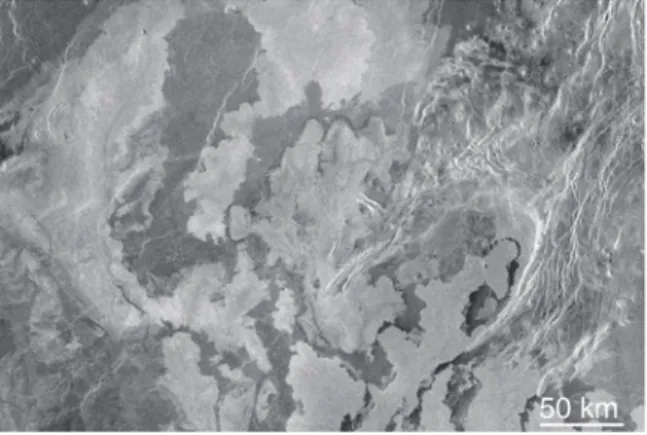
Smooth plains of Venus are typically radar dark. Some of them have sharp boundaries. Their planimetric morphology and frequent association with obvious volcanic landforms suggest that they are fields of lava with very smooth surfaces (figure 14). Other varieties of smooth plains have diffuse boundaries and are often associated with large impact craters. These are probably mantles of fine debris, the primary source of which is ejecta from the impact craters (figure 15).
In summary, signatures of Venusian volcanism indicate that it was dominantly basaltic and mostly plains-forming. Volcanic edifices ranging from relatively small to giant, although very numerous, are subordinate to plains in surface area occupied and even in their total volume. The majority of volcanic plains were produced by vast high-yield eruptions resembling basaltic floods of so-called Large Igneous Provinces on Earth (e.g. the Deccan plateau and the Columbia River). Second in abundance are plains formed by numerous small volcanic shield-like edifices and rather short (indicating low yield) lava aprons emanating from them. The extensive areal distribution and close spacing of these small eruptive centres indicate shallow crustal sources probably representing in situ partial melting within the Venusian crust. This mechanism of formation may explain the geochemically evolved character of the Venera 8 site and the association of steep-sided domes with shield plains (see above). The younger volcanism, represented by volcanics of lobate and smooth plains, is significantly more localized.
Figure 14. Radar-dark smooth volcanic plains rimming a field of lobate lava flows (image centre)
south of Ninhursag Corona. At the image right, smooth plains of intermediate brightness are seen. At the lower left is a part of the Vaidilute Rupes ridge belt. The area is centred at 40.5˚S, 22˚E.
Figure 15. Radar-dark smooth plains in a local depression between the cluster of ridges and a field
of volcanic shields. The gradational boundaries of the radar dark unit and its close association with the 150 km crater Meitner (∼100 km south of this area) is evidence of the impact–aeolian origin of this radar-dark unit. The area is centred at 53.5˚S, 320˚E.
6.2. Moderately and highly deformed terrains
About 20% of the surface of Venus is occupied by terrains that are topographically rough due to tectonic deformation. These are the ridge belts, densely fractured plains, tesserae and the mountain belts surrounding plateau Lakshmi, as well as rift zones (Basilevsky and Head 2000). The regional plains embay and partly bury almost all of them except the majority of rifts.
Ridge belts form a global-wide system, which is now seen only in fragments standing high enough not to be flooded by lava of the surrounding regional plains, which in most observed cases embay the belts (figure 16). The ridge belts are composed of plains-forming material looking very similar to that of plains with wrinkle ridges. It is probably also a solidified basaltic lava. This material often bears wrinkle ridges but what is typical for this unit is its folding into broader (3–5 km) ridges arranged into parallel bands. This folding is obviously a result of regional to global horizontal compression.
Relatively small (tens to 100–200 km across) islands of densely fractured material standing a few hundred metres above the surrounding regional plains (figure 17) are seen in many areas
Figure 16. Fragment of the Breksta Dorsa ridge belt embayed by plains with wrinkle ridges. The
area is centred at 34.5˚N, 306˚E.
Figure 17. A fragment of densely fractured plains among relatively dark plains with wrinkle
ridges (bottom) and relatively bright smooth plains (lower left). At the eastern part of the area shown (image right), small shield volcanoes are superposed on densely fractured plains. The area is centred at 67˚S, 26˚E.
of Venus. If one ignores the fractures, the terrain forming these islands is plains. So these densely fractured plains were evidently formed by plains-forming volcanic floods, probably basaltic ones, and their subsequent dense extensional and shear fracturing. In rather rare cases when densely fractured plains are in contact with ridge belts it is seen that the material composing the ridge belts embay the fractured plains. The structural pattern of the fractures is often subparallel (within a given island). Islands of densely fractured plains are observed all around the planet; this implies global-wide deformation event(s). A terrain of this type is also observed in many coronae (see below), where radial and concentric structural patterns of dense fracturing are typical.
Tesserae form ‘islands’ and ‘continents’ standing above the surrounding regional plains which obviously embay the tessera. In infrequent cases, when a tessera is in contact with ridge belts and densely fractured plains, it is seen that the materials composing these two units embay tessera terrain. The surface of a tessera is very rough, being dissected by numerous criss-crossing ridges and grooves a few kilometres wide and tens of kilometres long (figure 18).
Ridges are evidently formed by compressional tectonic deformation while many grooves are extensional structures (Ivanov and Head 1996, Hansen et al 1997). The surface of the tessera terrain looks bright on the Magellan images. This is obviously due to high metre–decametre roughness also resulting from tectonic deformation. This high degree of deformation implies episode(s) of very intense tectonic activity, which formed what we see now as tessera terrain. Because tessera terrain is observed in practically all regions of Venus, this intense tectonism should evidently be on a global scale. The composition of tessera terrain material is unknown. Some researchers suggest it has a basaltic composition. Others believe that tesserae may be made of more feldsparic material resembling, to some degree, anorthosites of the Moon or granites of Earth (Nikolaeva et al 1992).
Mountain ranges surrounding the volcanic plateau Lakshmi form a specific terrain type. They consist of clusters of parallel (within the given range) ridges (figure 19) resembling ridges of the ridge belts on plains described above. But mountain ranges differ from the ridge belts in that their heights are very large. The summit of the highest of them, Maxwell Montes, stands
Figure 18. South-eastern termination of Laima Tessera embayed by plains with wrinkle ridges.
The area is centred at 47.5˚N, 55.5˚E.
Figure 19. Southern part of Maxwell Montes mountain belt with neighbouring radar dark plains of
the eastern part of Lakshmi Planum plateau (left) and the northern part of Sedna Planitia (bottom). The topmost part of the mountain massif has very high radar reflectivity. The area is centred at 61˚N, 5˚E.
Figure 20. Fractures of the Devana Chasma rift cut the 37 km crater Balch. The image shows
that the easternmost segment of the crater is shifted from its original position by∼10 km. This provides an estimate of the scale of the rift-associated stretching of the crust. The area is centred at 30˚N, 283˚E.
more than 11 km above the MPR. Parallel ridging and high altitudes of the mountain ranges imply that they formed due to intense horizontal compression. Laterally, mountain ranges merge into tessera terrain. This may suggest that the formation of mountain ranges was the initial stage in the formation of tessera terrain. As in the case of tessera terrain, the composition of the mountain range material is not known.
The top parts of the mountain ranges (and of some other highlands of Venus as well) have extremely high radar reflectivity and look very bright on the Magellan images. This brightening appears above some critical altitude (although this varies somewhat along the planet), which is often called the ‘snow line’. It is believed that above the ‘snow line’, surface material has undergone specific weathering (Wood 1997). In this process, the iron in silicates, such as pyroxenes and olivines, was believed to segregate into minerals with high electrical conductivity (iron oxides or sulfides). These minerals are believed to reflect radio waves very efficiently, thus, making the surface very radar bright.
Venusian rifts, also called chasmata, are rather similar to continental rifts of Earth and form a global system up to 40 000 km long (Schaber 1982). They are, typically, troughs whose floor may be a couple of kilometres below the neighbouring non-rifted terrain, while the rims of the troughs are often lifted above the neighbouring terrain. The walls and floors of the troughs are fractured, often very heavily (figure 20). As mentioned above, young post-regional-plain lava fields and volcanic constructs are frequently associated with rifts. The general consensus is that rifts formed in an environment of tectonic extension. Rifts of Venus cut not only post-regional-plain units, but all other geological units of this planet as well. Most of the observed rifts are younger than the regional plains, but some are older (designated by some researchers as fracture belts) and seen as fragments partly flooded by the lavas of regional plains (figure 21). This means, in particular, that this relatively old rifting was more extensive than can be judged from the abundance of fracture belts now observed.
Some troughs, e.g. Artemis Chasma, considered as rifts based on analysis of the Pioneer Venus altimetry (Schaber 1982) were re-interpreted based on the Magellan data as being similar to the terrestrial subduction troughs, an element of the Earth’s plate tectonics (e.g. McKenzie
et al 1992). This interpretation, however, was not supported by the analysis of other researchers
(Hansen et al 1997).
In summary, signatures of Venusian tectonism indicate that it was represented by globally widespread compressional and extensional deformation, which was intensive in the beginning
Figure 21. Relatively old N–S trending rift (image centre) and corona-like feature to the west of it.
They are both cut by the younger E–W trending rift (image top). The area is centred at 21˚S, 231˚E.
of the morphologically observed part of the geological history of the planet (tessera-forming structures and dense fracturing), then changed to moderate (ridge belts) and even modest (wrinkle ridges) deformation (Head and Basilevsky 1998). Localized deformation in the form of extensional rift zones was typical and dominant of the later period of the geological history, but it also occurred in earlier times although with poorly understood intensity. Besides the Venusian rift zones, no structures resembling subduction troughs, island arcs and mountain ranges, which are complementary to mid-oceanic rifts on Earth, are observed. This implies that at least within the observed morphological record, the geodynamic style of Venus is very different from the plate-tectonics-dominated style of geologically modern Earth.
6.3. Coronae
Several hundred distinctive specific volcanic–tectonic structures are observed on the surface of Venus. These features, called ‘coronae’ (‘corona’ singular), are unique to Venus and were first discovered in the analysis of the radar images of Venera 15/16 (Barsukov et al 1986). Coronae are oval to circular features typically 100–300 km in diameter (figure 22). A few of the coronae are even larger. They have a circular, or nearly circular, tectonically deformed annulus, which usually stands a few hundred metres above the surrounding plains. The area inside the annulus is typically lower than the surrounding plains and flooded with plains-forming volcanics. Aprons of young lobate volcanic flows are seen radiating from many coronae. At the centre of some coronae an elevated and tectonically deformed area, the corona core, is seen. Coronae are considered to form as a result of the rising of hot material in the mantle (Stofan et al 1997). This hot mantle diapir pushed up the upper layers of the surface, its lithosphere and crust, and on its way upwards produced magmatic melts, part of which reached the surface and formed the aprons of lava flows. When the diapir cooled, the uplifted surface collapsed, producing the structure that we now call a ‘corona’. Some coronae are scattered among the regional plains. Others form clusters and chains associated with rift zones. For many coronae, there is evidence that they started to form in early pre-regional-plains time and continued their activity during and after the emplacement of regional plains. The fact that these geologically long-lived coronae remained circular, instead of being deformed, is another piece of evidence that plate tectonics did not operate during the time considered.
Figure 22. Pomona Corona at the boundary between the regional plains of Snegurochka Planitia
and Itzpapalotl Tessera (lower right). The tectonized annulus of the corona is mostly embayed by the regional plains. To the NNW and SW of the corona, relatively bright lobate flows emanate from the corona annulus. In the close vicinity of the SE of the corona the impact crater Dashkova is seen. Another crater Lagerlof is partly seen at the image upper left. The area is centred at 79.5˚N, 300˚E.
Figure 23. Size–frequency distribution of impact craters of Venus (filled circles) compared with
models simulating formation of an 800 million years old crater population in the case of the presence of today’s atmosphere and its absence (modified from McKinnon et al (1997)). The good fit of the model and the observed distribution implies that for the period when the observed population formed, the atmosphere of Venus was approximately the same as it is now.
6.4. Impact craters
More than 960 impact craters from 1.5 to 270 km in diameter have been identified on the surface of Venus (Schaber et al 1992, Herrick et al 1997). Their size frequency distribution is shown in figure 23, and it is obviously controlled by the screening effect of the massive Venusian atmosphere. The distribution of impact craters around the planet is indistinguishable from a random one. This is one more piece of evidence against plate tectonics operating on Venus.
Venusian craters have a very typical morphology similar to that of impact craters of other planets and satellites. They are circular depressions surrounded by an elevated rim. The rim of Venusian craters and the area around it are knobby and typically radar bright. Here the
Figure 24. Impact craters of Venus: crater Ualinka (13 km in diameter) showing irregular morphology on the floor (left), crater Buck (22 km) with a prominent central peak (centre) and crater Barton (50 km) having a double-ring structure (right).
Figure 25. Impact craters with ouflows: 19 km crater Jeanne (left) and 90 km crater Addams (right).
surface is covered with ejecta excavated from the crater. The general morphology of impact craters on Venus is correlated with their size (figure 24): craters smaller than 10–20 km in diameter have an irregular floor. Larger craters have a central peak on the floor. Even larger (>50–60 km) craters have a concentrically ringed floor. Similar size dependence (although with different transitional diameters between types) is observed for craters on other planetary bodies. On the other bodies, however, craters of smaller size are not irregular-floored but have a relatively smooth bowl-shaped floor. This difference is due to the break-up of relatively small crater-forming projectiles on their way through the massive Venusian atmosphere. So in these cases the planet is hit not by a single projectile body but a swarm of its dispersing fragments. Flow-like features extending from the knobby ejecta are seen around many Venusian craters (figure 25). These features (called outflows) are believed to be flows of high-temperature melt produced by the crater-forming impact. Their abundance on Venus is probably due to the higher (compared with other planets and satellites) temperature of the surface of Venus and thus the higher temperature of the upper crust. This would tend to increase the amount of impact melt produced (Schultz 1992).
In association with many impact craters on Venus are radar dark halos (see, e.g. figure 25, left). These halos are relatively fine-grained debris deposited as part of the crater formation process. With increasing time, the halos degrade and disappear so the presence and prominence of the halo may be used as a measure of crater age (Arvidson et al 1992, Basilevsky and Head 2002). Some areally extensive halos have a parabolic form with the parabola apex pointing to the east (figure 26). These dark parabolae are believed to form as a result of the fine fraction
Figure 26. Radar-dark parabola associated with the 67 km impact crater Stuart. The SE part of
Alpha Regio tessera massif is in the figure upper left. The area is centred at 30˚N, 12˚E.
of the crater ejecta settling down through the upper layers of the Venusian atmosphere where a very strong zonal wind blows towards the west. The dark parabolae associated with the youngest craters degrade with time into non-parabolic halos. The total amount of relatively fine debris produced by impacts and widely distributed by wind since the formation of regional plains is equivalent to a global-wide layer a few metres thick.
6.5. Aeolian features
In the absence of liquid water on Venus, exogenic resurfacing on this planet is essentially dominated by aeolian processes (Greeley et al 1997). The observed aeolian features are represented by radar-dark mantles, wind streaks, yardangs and dunes. Dark mantles and wind streaks are rather common features on Venus, while yardangs and dunes large enough to be seen on the Magellan images are observed in only a few localities.
Dark mantles are typically seen in association with impact craters forming halos of different sizes and forms (figure 15). The source of the dark-mantle material is fine debris formed by crater-forming impacts, so one can consider it as a facies of an impact crater ejecta deposit. But this material did settle down through the atmosphere and even in its freshest state (crater-associated radar-dark parabolae) its deposition was strongly controlled by wind, so it should also be considered aeolian. In many cases, the dark mantles have already lost direct contact with impact craters and occupy wind-shadow localities in local topographic lows and behind or against positive topographic features.
Wind streaks are the most abundant aeolian features on Venus. They are elongated features varying significantly in shape (linear, fan-like, wispy), size (from a few to tens of kilometres) and radar brightness (bright, dark, mixed). Figure 27 shows an example of their variety. Wind streaks typically originate from topographic features that are obviously the accumulational and/or erosional products of behind-the-feature wind turbulence. It is quite typical that lateral boundaries of wind streaks are diffuse.
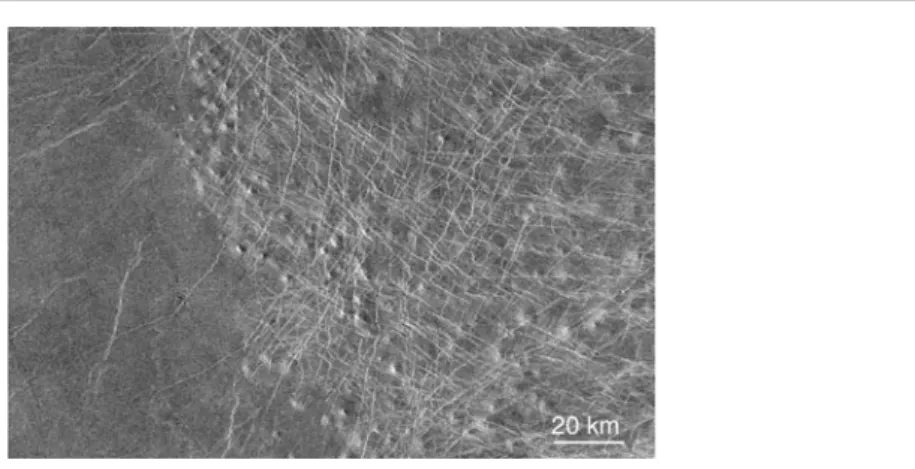
A field of possible yardangs, which are wind-erosional grooves, is observed in the vicinity of the crater Mead, the largest impact crater on Venus (figure 28). The features described as yardangs are represented by sets of parallel, linear, slightly sinuous grooves and ridges separating them. These features are a few tens of kilometres long and about 0.5 km wide, forming clusters with 0.5–2 km spacing. They differ from wind streaks in that they have well-defined boundaries and do not originate from topographic features, such as hills.
Figure 27. Radar-dark wind streaks in Western Aphrodite. The area is centred at 0.9˚S, 71.5˚E.
Figure 28. Candidate yardangs to the SE of the crater Mead. The area is centred at 9˚N, 60˚E.
Two dune fields have been found on the Magellan images: one in the plains between Fortuna and Meshkenet tessera massifs (figure 29) and another one in the plains of the northern part of Lavinia Planitia (Greeley et al 1997). Both dune fields are in close association with large impact craters whose ejecta probably was the source of the debris involved in dune formation. The dunes are from 0.5 to 10 km long and a few hundred metres wide. The formation of dunes implies saltation of sand-sized particles, so the lack of observed dunes on Venus may indicate a deficit of debris of this size on the planet.
In summary, signatures of aeolian erosion and deposition, namely dark mantles and wind sreaks, are rather common on Venus. But their contribution to the resurfacing distinguishable on the Magellan images is rather minor. However, at the smaller scale, aeolian erosion and deposition may be dominating factors, which determine the surface microrelief in the majority of the areas on Venus. As mentioned above, rather soft and fine-layered rocks seen in all four Venera landing sites, where the TV panoramas were taken, may be lithified aeolian sediments. The aeolian deposition and redeposition of loose soil observed on the same panoramas seems to be unquestionable.
6.6. Signatures of down-slope mass movement
Magellan radar images show many localities of down-slope mass movement: rock slumps, rock and/or block slides, rock avalanches, debris avalanches and possibly debris flows (Malin 1992).
Figure 29. Part of the Fortuna–Meshkenet dune field. Dune long-side orientation varies from E–W
to NE–SW. Orientation of radar-bright wind streaks implies winds blowing towards the NW. The area is centred at 68˚N, 90.5˚E.
Figure 30. Rock slump at the southern slope of the steep-sided volcanic dome. The area is centred
at 16˚S, 211.5˚E.
They are seen in areas of high relief and steep slope gradients and understandably are most abundant in the tectonic troughs of rift zones. Figure 30 shows a rock slump on the slope of the steep-sided dome in the Atla Regio region, which is more than 2 km high. This dome is within the ancient rift zone and the slump was probably initiated by quakes accompanying the formation of rift faults. Although the seismic environment in regional plains far from rift zones is probably quieter, certainly it was not always seismically quiescent there. Regional plains are deformed by a network of wrinkle ridges. Morphologically similar wrinkle ridges, smaller than the Venusian ones by an order of magnitude, formed in October 1968 in western Australia during the Meckering earthquake, whose magnitude was 6.9 on the Richter scale. This may imply that rather strong quakes accompanied the formation of the Venusian wrinkle ridges and favoured mass movement whose signatures, however, are below the Magellan image resolution. A signature of small-scale down-slope mass movement can be seen on the Venera 9 TV panorama in the form of a rocky talus (figure 5).
7. Age sequence of the terrains and features
The terrains and features described above show evidence of age relations among and between them. Often these age relations are clear, for example, in cases where lobate lava flows overlap
Figure 31. Stratigraphic column of the geological units of Venus (modified from Basilevsky and
Head (2002)). Legend: pl and ps are lobate and smooth plains; pwr and psh are plains with wrinkle ridges and shield plains; pfr is fractured and ridged plains forming ridge belts; pdf and tt are densely fractured plains and tessera terrain; rt and fb are structural units corresponding to younger and older rift zones; cu designates impact craters progressively losing the associated dark halos with time. The inset shows the drastic decrease in the rate of volcanic-and-tectonic activity after emplacement of unit pwr. T is the mean surface age of Venus (0.5–1 billion years).
regional plains with wrinkle ridges (figures 12 and 13) or where regional plains embay tessera (figure 18). In some cases, age relations among the units are not so clear or even cannot be determined for a given place, for example, if the units are not in contact with each other. However, comparing observations in different areas, it is possible to compile an idealized model of the age sequence of the geological units: a stratigraphic column. It is shown on figure 31 with some simplifications. The lobate and smooth plains are among the most recent (top of the stratigraphic column). They are underlain by older regional plains with wrinkle ridges and shield plains. Even more ancient are ridge belts, then densely fractured plains, and, finally, tessera terrain, the oldest (Basilevsky and Head 2000).
This general age sequence of units has been found and mapped in different areas of Venus by many researches with minor modifications (e.g. Ivanov and Head (2001), Rosenberg and McGill (2001), Campbell and Campbell (2002)). An arena of debate is the question of whether the same units of the sequence, for example, plains with wrinkle ridges, have the same absolute age all around the planet or not. Two end-member models are shown in the simplified form of a three-member (L, M and U) age sequence in four geological provinces (figure 32). In accordance with one of the models (see figure 32, left), the U–M–L sequence of the geological units is present in all four provinces (and, ideally, all around the planet) and similar units of each of the provinces have approximately the same absolute age. This is the so-called synchronous model (see, e.g. Basilevsky and Head (2002)). In accordance with the alternative
Figure 32. Schematic presentation of two end-member models of the correlation of geological
units. L, M and U designate the stratigraphically lower, medium and upper units, respectively. A and B here designate episodes of tectonic deformation that formed discontinuities separating units L from M and M from U, respectively. See text for further explanation.
model shown in figure 32 (right) the same units of these four U–M–L sequences have different absolute age. For example, unit L of province 3 differs in age from the morphologically similar units L of provinces 1, 2 and 4: compared with them it has the smallest absolute age. This is the so-called non-synchronous model preferred by some other researchers (see, e.g. Guest and Stofan (1999)).
The question is: Which of these two models corresponds better to the observed geological record of Venus? This is a problem of stratigraphic correlation of the geological units observed in different areas of the planet, well-known to geologists on Earth. In the case of Earth, geologists use for the correlation either fossils of various organisms that lived in the geological past (the same fossils mean the same age) or isotope dating, which determines the absolute age of the materials composing the units. Both these techniques are not applicable in the case of Venus. However, the situation is not hopeless and the solution can evidently be found through geological mapping of Venus.
Let us look at figure 32 again. If someone makes a photogeological analysis in rather small areas of Venus that are separated in space, there is a high probability that both in the synchronous and non-synchronous cases, the researchers will see the same ‘L–M–U’ sequence. But if the researchers map large territories (ideally the whole planet) covering several geological provinces, then sooner or later they will map the boundary zones between the provinces 1, 2, 3 and so on. In these zones, units of one province come in contact with units of another province and this permits one to distinguish between the synchronous and the non-synchronous alternatives. If similar units of neighbouring provinces are synchronous, one will see the same unit–age relations at the boundary zone as inside the provinces. But if similar units of neighbouring provinces are not synchronous, one will see violations of the established age sequences at the boundary zone. For example, in the model case shown at figure 32 (right), at the boundary between provinces 3 and 4, the observer will see a contradictory situation. Unit L of province 3 is superposed on unit M of province 4, but nearby, the unit L of province 3 is overlapped by unit M of the same province. So one would see unit L both superposed on and