Forstw. Cbl. 122 (2003), 219−230 Eingereicht am 08.01.2003 2003, Blackwell Verlag, Berlin Akzeptiert am 15.04.2003 ISSN 0015-8003
Structure and Long-Term Development of Subalpine
Pinus montana Miller and Pinus cembra L. Forests in the
Central European Alps
Struktur und Langzeitentwicklung von subalpinen Pinus montana Miller und
Pinus cembra L. Wäldern in den zentraleuropäischen Alpen By ANITAC. RISCH, LINDAM. NAGEL, M. SCHÜTZ, B. O. KRÜSI,
F. KIENASTand H. BUGMANN
Summary
Since traditional agriculture and forestry are no longer economically viable in many regions of the European Alps, subalpine forests will become less managed or completely abandoned in the near future. Therefore, the interest in understanding how forest stands will develop after abandonment has increased considerably over the past two decades. While much is known about stand structure and stand develop-ment of Norway spruce (Picea abies L.) forests, almost no knowledge is available about the same pro-cesses in forest communities of the Central Alps. In the Swiss National Park (SNP), the forested area is comprised of mountain pine (Pinus montana Miller), Swiss stone pine/larch, (Pinus cembra L./Larix
decidua L.). and mixed stands. When the Park was founded in 1914 all management activities were
stopped. Therefore, this area offers the opportunity to study stand development and changes in stand structure after abandonment. We compared historic (1957) and present data (2001/02) from 19 stands that were grouped into characteristic stand types: “mountain pine”, “mixed”, and “stone pine”. We detected significant decreases in total tree density (stem/ha) and sapling density (saplings/ha) of 45 to 57 %, and 64 to 76 %, respectively, over the 45 years of observation for all stand types. These changes were strongly related to decreases in the number of shade intolerant mountain pine trees. Simul-taneously, the amount of non-standing woody residue increased from less than 4 t/ha to 36 to 67.7 t/ha, and the density of standing dead wood (stems/ha) decreased significantly between 72 and 94 %. The biomass of standing dead wood (t/ha), however, changed only slightly between 1957 and 01/02. Our results describe the successional development of continental subalpine forests after aban-donment and outlines changes that might take place in similar areas in the near future.
Keywords: Stand dynamics, long-term forest development, Swiss National Park, subalpine conifer
forests, Swiss stone pine, mountain pine.
Zusammenfassung
Die traditionelle land- und forstwirtschaftliche Nutzung dürfte im Alpenraum in der näheren Zukunft wirtschaftlich bedingt immer häufiger aufgegeben werden. Dieser Trend wird mit großer Wahrschein-lichkeit die Dynamik von Gebirgsökosystemen und damit das Landschaftsbild stark beeinflussen. Aus diesem Grund stieg in den letzten Jahrzehnten das Interesse, die Sukzession auf nicht mehr bewirtschaf-teten Flächen zu verstehen. Die Bestandesstruktur und -entwicklung von subalpinen Fichtenwäldern (Picea abies L.) wurde bereits intensiv untersucht; über Entwicklungsprozesse in zentralalpinen Bergföh-ren- (Pinus montana Miller) und Arven-/Lärchenwälder (Pinus cembra L./Larix decidua L.) ist hingegen nur wenig bekannt. Der seit 1914 vom Menschen nur noch touristisch genutzte Schweizerische Natio-nalpark (SNP) ist eines der wenigen Gebiete in Westeuropa, welches über längere Zeit nicht bewirtschaf-tet wurde. Der Park biebewirtschaf-tet daher die einzigartige Möglichkeit, die Veränderungen in Bestandesstruktur und -zusammensetzung nach Bewirtschaftungsaufgabe zu beobachten. Wir verglichen historische (1957) und aktuelle (2001/02) Daten von 19 Beständen, welche zu drei verschiedenen Bestandestypen gehören: „Bergföhre“, „Mischbestand“ und „Arve“. In den letzten 45 Jahren nahm die totale Stammzahl in allen drei Bestandestypen um 45 bis 57 % und die Jungbaumzahl pro Hektar um 64 bis 76 % signifikant ab, was vor allem auf den starken Rückgang der lichtbedürftigen Bergföhre zurückzuführen ist. Parallel zu dieser Entwicklung, nahm die Menge an liegendem Totholz in allen Bestandestypen von weniger als 4 t/ha auf 36 bis 67,7 t/ha zu, während die Anzahl toter Bäume pro Hektar um 72 bis 94 % abnahm. Die Biomasse des stehenden Totholzes (t/ha) hat sich hingegen nur leicht verändert. Unsere Resultate U.S. Copyright Clearance Center Code Statement: 0015−8003/2003/12204−219 $ 15.00/0
beschreiben die sukzessionale Entwicklung von subalpinen Wäldern der Zentralalpen und zeigen, wie sich Wälder in ähnlichen Berggebieten in der nahen Zukunft entwickeln könnten.
Schlüsselwörter: Bestandesdynamik, Langzeitwaldentwicklung, Schweizerischer Nationalpark,
subal-pine Koniferenwälder, Arve/Zirbe, Bergföhre.
1 Introduction
In many regions of the world mountain forests are of great relevance for both the environ-ment and human societies. They are important for the hydrology and biodiversity of entire continents (cf. RIEDERER 1996, BECKER and BUGMANN 2001, BRUN 2002) as well as for protection against natural hazards, e. g. avalanches (SCHÖNENBERGER2000, BEBIet al. 2001, BACHOFEN and ZINGG2001). Stand structure and development of mountain forests have been studied extensively (e. g. CALLAWAY 1998, KIENAST et al. 1999, BINKLEYet al. 2003, TOMBACKet al. 2001). Studies in the United States and Canada have generally focused on different high elevation forest communities (e. g. BINKLEYet al. 2003, TOMBACKet al. 2001), while European researchers have mostly studied the dominating forest type in the Alps, the Norway spruce (Picea abies (L.) Karst.; PIAB) forests (e. g. BÜRKI1981, STROBEL1997, BACHOFENand ZINGG2001, STÖCKNER2002). Studies in other mountain forest communi-ties, such as forests dominated by Swiss stone pine (Pinus cembra L.; PICE), mountain pine (Pinus montana Miller; PIMO) or European larch (Larix decidua L.; LADE) have only rarely been the focus of scientific research (BRANG1989, PIUSSI1994, DEMASand PIUTTI1994, KRÜSIand MOSER2000). Therefore, little is known about stand structure and stand devel-opment of these communities. Since the percentage of forested areas in mountain regions has increased over the past two decades due to land abandonment (PRICE1995, BÄNTZING 1996, PIUSSI 2000), it is important to gain knowledge about stand structure and stand development of all subalpine forest types and how these forests will develop in the future. However, it is difficult to assess the natural long-term development of mountain forests in Western Europe since there are few areas with a history of no or little management.
The Swiss National Park (SNP) is one of the few areas in Western Europe that was not influenced directly by humans during most of the 20th century. Consequently, the
park provides the rare opportunity to investigate changes in stand structure and stand development. Since an extensive database exists for the SNP’s forests from the year 1957 (KURTHet al. 1960), we have the opportunity to investigate stand development during 45-years without human interference.
The park’s forests are composed of five conifer species. PIMO, PICE, and LADE are the dominant species, while Scots pine (Pinus sylvestris L.; PISY) and PIAB are less import-ant (ZOLLER 1995). PISY is not competitive in the cold climate at high elevations in the SNP (KELLERet al. 1998), and PIAB is not well adapted to the central alpine climate with relatively low rainfall, and mean annual temperatures lower than 1.5°C (ELLENBERG1996). Today, stands dominated by PIMO occupy large parts of the park, while other areas are covered with forests comprised of PICE, a mixture of PICE and LADE or mixed species stands. As an analysis of successional pathways revealed (RISCH et al. in print), PIMO dominated forests are the early to mid-successional forest type of the area, developing into mid-successional mixed species stands, and further to PICE/LADE stands. Since the Middle Ages, large parts of the PIMO forests in the SNP (but also elsewhere) were clear-cut on short rotations for firewood, but PICE and LADE forests were left standing until they were approximately 250 years old. Single trees were then cut selectively and used for construction purposes and furniture manufacture (cf. PAROLINI 1995). The clear-cut patches regenerated with PIMO forests. The date of the last clear-cuts is not known with certainty, but likely occurred in the middle of the 19thcentury. After the last clear-cuts,
selective timber extraction for some species was maintained up to 1914, but these activities were also stopped entirely after the founding of the Park (PAROLINI1995).
1.1 Objectives
The objective of this study was to examine stand structure and stand development in subalpine conifer forests of the SNP which are no longer managed. In particular, we investigated how the species composition of (a) living trees, (b) dead trees, and (c) saplings, as well as (d) stand density and (e) dead wood biomass changed in three different stand types over this period.
2 Study area and methods
The SNP is located in the southeastern part of Switzerland and extends over an area of approximately 170 km2, 50 km2of which are covered with forests. The elevation of the
area ranges from 1350 to 3170 meters above sea level (m.a.s.l.). The mean annual precipi-tation and mean annual temperature are 925 ± 162 mm and 0.2 ± 0.7°C, respectively.
2.1 Historical data and present data sampling design
KURTHet al. (1960) established a sampling design for the entire forested area of the SNP using a systematic grid of 143 m× 143 m. This resulted in a database in which all infor-mation on saplings (21 to 130 cm tall), trees (> 130 cm) and dead trees was aggregated to the stand level. For trees > 130 cm, diameter at breast height (DBH; 130 cm) was recorded (KURTH et al. 1960). Today, only the stand-level data are available but not the individual plot-level (grid-point level) information. This database forms the historical basis for our study.
In 2001 and 2002, we resampled 19 of the 131 stands delineated by KURTHet al. (1960). They were located within an area of approximately 80 km2 in the center of the park at
elevations ranging from 1700 to 2200 (m.a.s.l.). The stands were randomly selected in proportion to their abundance in 1957 (KURTH et al. 1960), and were then divided into stand types based on their species composition, tree and stand density in 1957: (1) stands dominated by PIMO (hereafter referred to as “mountain pine”); (2) stands dominated by PIMO but with considerable amounts of all other species (“mixed”); and (3) stands domi-nated by PICE (“stone pine”). These three groups contained six, six, and seven stands, respectively.
We sampled 16 points in each stand with the point-centered quarter method (GREIG -SMITH1983) on a systematic grid of 70 m× 70 m or 40 m × 40 m, depending on stand size. Four trees taller and four trees shorter than 130 cm were sampled separately at each of the points. Species name, distance to the midpoint of the sampling location (m), DBH (cm), condition of the tree (dead/alive; browsed/unbrowsed for saplings only), and tree height (m) (using a clinometer) were recorded. At each of the 16 points, canopy closure was measured with a densiometer, taking four measurements around the center of each sampling point in all cardinal directions (LEMMON1957).
At the stand center we conducted a woody residue survey to estimate the amount of laying dead wood (t/ha), using the planar intersect method described by BROWN(1974). Three transects, each 15.2 m long, were laid out dividing 360 degrees around the stand center into three equal sections. Woody debris on the forest floor and soil wood (main longitudinal axis buried below the forest floor surface) were measured along each transect. Woody debris was divided into four diameter classes: 0.6⫺2.5 cm, 2.5⫺7.6 cm, > 7.6 cm ‘sound’, and > 7.6 cm ‘rotten’. Diameter of ‘sound’ and ‘rotten’ woody residue was meas-ured. ‘Rotten’ was defined as over 50 % of the area of the stem showing advanced decay. Soil wood was categorized in brown and white rot decay classes, width and depth were measured. Woody residue was also measured in 1957, but the stand level data is not available. KURTHet al. (1960), however, gave estimates of woody residue for certain regions of the SNP. These values ranged from 0.01 to less than 5 m3.
2.2 Numerical analyses
We calculated tree density (number of stems/ha) for different DBH classes for the living trees (0 = 1⫺4 cm; 1 = 5⫺9 cm; 2 = 10⫺19 cm; 3 = 20⫺29 cm; 4 = 30⫺49 cm; 5 = > 50 cm) per species and stand, sapling density per species and stand as well as dead tree density per stand. To get an estimate for stand density we calculated a stand density index (SDI) for the living trees by using the midpoint of each DBH class weighed by the tree density in a particular DBH class (LONGand DANIEL1990). For the DBH class > 50 cm, the average of all trees with a DBH > 50 cm was used.
The data were then averaged for each of the three stand types (“mountain pine”, “mixed”, and “stone pine”). Since KURTHet al. (1960) distinguished between three differ-ent tree health conditions (‘alive’, ‘dead’ and ‘condition unknown’ [= heavily damaged, most likely dead]), we pooled the data for the dead trees and the trees of unknown condition from the year 1957. We then calculated the total biomass of standing dead trees in 1957 by multiplying the volume (m3) of standing dead trees per stand (available from
the historical data; KURTH et al. 1960) with the specific wood density for each species (PIMO: 0.8 g/cm3, PICE: 0.44 g/cm3, LADE: 0.55 g/cm3, PIAB: 0.43 g/cm3; PISY:
0.43 g/cm3; TRENDLENBURGand MAYER-WEGELIN1955, GUGGENBÜHL1962, STIFTUNGA
R-BEITSKREISSCHREINERMEISTER1991). Standing dead tree volume for 01/02 was calculated using allometric biomass equations for the different tree species (KAUFMANN2002). Total biomass per hectare was then calculated by multiplying biomass with specific wood den-sity, same as for the 1957 data.
Variance analyses were conducted for each of the three stand types to evaluate if living tree and stand density, sapling density, standing dead tree density, and standing dead tree biomass significantly changed over time. The same analyses were applied to evaluate stand type differences in canopy closure. The significance level α was 0.05 for all statistical analysis, differences between stand types were tested using the BONFERRONIpost-hoc test.
3 Results
3.1 Stand development: living trees and saplings
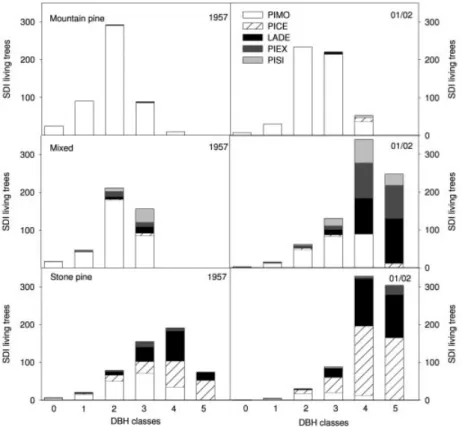
Between 1957 and 2001/02 significant decreases in total tree density were found for all stand types (“mountain pine”: -45 %; “mixed”:−57 %; “stone pine”: −56 %; Table 1) and shifts to larger DBH-classes were detected (Fig. 1). Changes in total tree density within all three stand types were strongly related to decreases in the number of PIMO trees, while the tree density of the other species did not reveal significant changes (Table 1). Total stand density (results given as SDI) significantly changed only in the “mixed” and “stone pine” stand type but not in the “mountain pine” type (Table 2). Despite the significant decreases of PIMO (stems/ha) in all three stand types, PIMO-SDI only changed significantly within the “stone pine” stand type. In the “stone pine” stand type the SDI of PICE also increased significantly, while a significant increase in the SDI of LADE and PIAB was observed in the “mixed” type (Table 2, Fig. 1). Between 1957 and 01/02 species composition (%), both in terms of stems/ha and SDI changed markedly in the “mixed” and “stone pine” stand types, but only showed minor changes in the “mountain pine” stand type (Table 1, Table 2). Canopy closure, measured in 2001/02, was lowest in the stand type with the lowest total SDI (“mountain pine”: 43.1 %), and significantly differed from the values measured in the other two stand types (“mixed”: 58.9 %, “stone pine”: 67.2 %; p = 0.0047).
Total sapling density (saplings/ha) significantly decreased during the 45 years of obser-vation within all three stand types (“mountain pine”: −65 %; “mixed”: −76 %; “stone pine”:−64 %; Table 3) as did total tree density. Sapling composition (%), however, only changed in the “mixed” stand type (Table 3). In the stand type with lowest canopy closure
Fig. 1. Species composition and SDI of all living trees > 130 cm for the different forest stand types in
1957 and 2001/02. Each bar shows the sum of SDI for all 5 species for each DBH class. DBH classes: 0 = 1⫺4 cm; 1 = 5⫺9 cm; 2 = 10⫺19 cm; 3 = 20⫺29 cm; 4 = 30⫺49 cm; 5 = >50 cm.
Abb. 1. Artenzusammensetzung und Bestandesdichte (SDI) aller lebenden Bäume > 130 cm in den
verschiedenen Bestandestypen in den Jahren 1957 und 01/02. Jeder Balken stellt die SDI-Summe für alle Arten einer Durchmesserklasse (BHD⫺ Brusthöhendurchmesser) dar. BHD-Klassen: 0 = 1⫺4 cm; 1 = 5⫺9 cm; 2 = 10⫺19 cm; 3 = 20⫺29 cm; 4 = 30⫺49 cm; 5 = >50 cm.
(“mountain pine”), the highest sapling density was observed. In 2001/02 the tallest sap-lings were those of PIMO, while PISY were the smallest (Table 3). Both PIAB and LADE were browsed heavily (apical shoots), while PIMO and PISY were less frequently subject to browsing (Table 3).
3.2 Stand development: dead trees and woody residue
The density of standing dead trees decreased significantly over the 45 years of observation in all three stand types (“mountain pine”: −72 %; “mixed”: −94 %; “stone pine”: −79 %; Fig. 2, Table 4). However, the biomass of standing dead trees (t/ha) significantly changed in the “stone pine” stand type only (Table 4). PIMO had the highest fraction of all standing dead trees in the two PIMO dominated stands (“mountain pine”: 1957⫺99.5 %, 01/02⫺99 %; “mixed”: 1957⫺93.5 %, 01/02⫺85.5 %), while PIMO, LADE, and PICE all contributed to the standing dead biomass in the “stone pine” type (Fig. 2). The percent-ages of dead trees of total standing trees (living and dead) in 1957 were 31 %, 49 %, and 29 % for “mountain pine”, “mixed” and “stone pine”, respectively, while the values in 01/02 were 19 %, 11 %, and 14 %, respectively.
Table 1. Tree density (stems/ha), and relative importance of the different tree species (%) in 1957 and
2001/02 per stand type. Standard errors are given in parentheses; differences between the two sampling years were tested separately for each stand type using ANOVA (significance level α = 0.05).
Tabelle 1. Stammzahl pro Hektar und prozentuale Anteile der verschiedenen Baumarten in den drei
Bestandestypen in den Jahren 1957 und 01/02. In Klammern ist der Standardfehler angegeben, die Unterschiede zwischen den beiden Probejahren wurden mittels ANOVA getestet.
Tree density (stems/ha)
Species Mountain pine Mixed Stone pine
1957 2001 p-value 1957 2001 p-value 1957 2001 p-value
PIMO 2431 (195) 1335 (225) < 0.01 1497 (142) 426 (68) < 0.01 529 (128) 114 (40) 0.01 PICE 0 (−) 6 (6) 0.34 24 (21) 32 (17) 0.63 167 (27) 214 (29) 0.25 LADE 4 (3) 7 (7) 0.71 38 (17) 93 (12) 0.12 141 (36) 131 (29) 0.84 PIAB 2 (2) 0 (−) 0.34 82 (26) 118 (30) 0.91 37 (28) 9 (9) 0.38 PISY 2 (2) 3 (3) 0.7 73 (21) 69 (25) 0.90 1 (1) 5 (5) 0.46 Total 2439 (196) 1351 (227) < 0.01 1714 (139) 738 (69) < 0.01 875 (113) 473 (55) 0.01 Distribution (%)
Species Mountain pine Mixed Stone pine
1957 2001 1957 2001 1957 2001 PIMO 99.7 98.8 87.3 57.7 60.5 24.1 PICE − 0.5 1.4 4.3 19.1 45.2 LADE 0.2 0.5 2.2 12.6 16.1 27.7 PIAB < 0.1 − 4.8 16.0 4.2 1.9 PISY < 0.1 0.2 4.3 9.4 0.1 1.1
Table 2. Stand density and relative importance of stand density expressed as SDI and % SDI,
respec-tively, for each stand type for both sampling periods. Standard errors are given in parentheses; differ-ences between the two sampling years were tested separately for each stand type using ANOVA.
Tabelle 2. Bestandesdichte und prozentualer Anteil der verschiedenen Baumarten ausgedrückt als SDI
und % SDI für die drei Bestandestypen in den Jahren 1957 und 01/02. In Klammern ist der Stan-dardfehler angegeben, die Unterschiede zwischen den beiden Probejahren wurden mittels ANOVA ge-testet.
Stand density (SDI)
Species Mountain pine Mixed Stone pine
1957 2001 p-value 1957 2001 p-value 1957 2001 p-value
PIMO 499 (42) 522 (79) 0.81 323 (44) 235 (85) 0.38 176 (41) 54 (19) 0.02 PICE 0 (−) 11 (11) 0.31 10 (8) 20 (12) 0.44 172 (26) 400 (54) < 0.01 LADE 2 (1) 6 (6) 0.49 23 (13) 227 (44) < 0.01 151 (35) 265 (68) 0.16 PIAB 2 (2) 0 (−) 0.34 29 (9) 199 (38) < 0.01 26 (35) 31 (31) 0.91 PISY 1 (1) 6 (6) 0.40 47 (13) 116 (35) 0.09 1 (1) 6 (6) 0.43 Total 503 (196) 545 (5) 0.67 432 (55) 798 (93) < 0.01 526 (55) 756 (68) 0.02 Distribution (%)
Species Mountain pine Mixed Stone pine
1957 2001 1957 2001 1957 2001 PIMO 99.2 95.8 74.8 29.5 33.5 7.1 PICE − 2.0 2.3 2.5 32.7 52.9 LADE 0.4 1.1 5.3 28.5 28.7 35.1 PIAB 0.4 − 6.7 25.0 4.9 4.1 PISY 0.2 1.1 10.9 14.5 0.2 0.8
Table 3. Sapling density (saplings/ha) and relative importance of sapling density (%) in each stand type
for both sampling periods, height and percentage of browsed saplings (apical shoots) in 2001/02. Number of saplings per species to calculate averages: PIMO = 598, PICE = 352, LADE = 37, PIAB = 150, PISY = 4. Standard errors are given in parentheses; differences between the two sampling years were tested separately for each stand type using ANOVA.
Tabelle 3. Anzahl Jungbäume pro Hektar und prozentualer Anteil der verschiedenen Baumarten in den
drei Bestandestypen in den Jahren 1957 und 01/02, durchschnittliche Jungbaumhöhe pro Art, sowie Verbissrate in %. Anzahl der auf Endtriebverbiss untersuchten Jungbäume: PIMO = 598, PICE = 352, LADE = 37, PIAB = 150, PISY = 4. In Klammern ist der Standardfehler angegeben, die Unterschiede zwischen den beiden Probejahren wurden mittels ANOVA getestet.
Sapling density (saplings/ha)
Species Mountain pine Mixed Stone pine
1957 2001 p-value 1957 2001 p-value 1957 2001 p-value
PIMO 3897 (682) 1307 (445) 0.01 2187 (311) 278 (75) < 0.01 238 (95) 82 (23) 0.14 PICE 85 (54) 95 (34) 0.88 168 (129) 93 (48) 0.60 765 (187) 275 (69) 0.03 LADE 0 (−) 0 (−) − 32 (17) 2 (2) 0.12 107 (33) 33 (12) 0.06 PIAB 0 (−) 2 (2) 0.34 155 (51) 232 (37) 0.33 16 (7) 21 (21) 0.82 PISY 0 (−) 0 (−) − 0 (−) 6 (4) 0.16 0 (−) 0 (−) − Total 3982 (722) 1404 (445) 0.01 2541 (327) 611 (134) < 0.01 1127 (232) 411 (100) 0.02 Distribution (%) Sapling condition
Browsed Species Mountain pine Mixed Stone pine Height
saplings 1957 2001 1957 2001 1957 2001 (cm) (%) PIMO 97.9 93.1 86.1 45.5 21.1 20.0 62.6 18.6 PICE 2.1 6.8 6.6 15.2 67.9 66.9 50.4 36.6 LADE − − 1.2 0.3 9.5 8.0 51.9 81.1 PIAB − 0.1 6.1 38.0 1.5 5.1 58.3 83.3 PISY − − − 1.0 − − 49.3 0
Fig. 2. Tree density (stems/ha) of dead trees and trees of unknown condition > 130 cm per hectare
for the three forest stand types in 1957 and 2001/02. The density for each species is represented by one bar. Dead and unknowns are added up.
Abb. 2. Stammzahl (Stämme/ha) aller toten und „nicht definierten“ (aber mit großer Wahrscheinlichkeit
toten) Bäume > 130 cm pro Hektar, Bestandestyp und Beprobungsjahr. Jede Art ist als separater Balken dargestellt. Tote und „nicht definierte“ Bäume wurden addiert.
Large amounts of non-standing dead wood (woody residue, t/ha) were found in all three stand types (Table 4). Our survey detected the highest amount in the “mixed” stand type where we also observed a decrease in standing dead wood biomass, suggesting that many of the dead trees that were still standing in 1957 tipped over in the past 45 years (Table 4).
Table 4. Standing dead tree density (dead trees/ha), standing dead tree biomass (t/ha) for 1957 and
2001/02, as well as woody residue (t/ha) and total dead wood biomass (t/ha) for 01/02. Standard errors are given in parentheses; differences between the two sampling years were tested separately for each stand type using ANOVA.
Tabelle 4. Anzahl stehende tote Bäume pro Hektar, und Biomasse der stehenden toten Bäume pro
Hektar (t/ha) in den drei Bestandestypen in den Jahren 1957 und 01/02, sowie die Biomasse des liegenden Totholzes (t/ha) und die Biomasse des stehenden und liegenden Totholzes in 01/02. In Klammern ist der Standardfehler angegeben, die Unterschiede zwischen den beiden Probejahren wurden mittels ANOVA getestet.
Mountain pine Mixed Stone pine
1957 2001 p-value 1957 2001 p-value 1957 2001 p-value
Standing dead tree 1121 (176) 307 (41) < 0.01 1618 (238) 94 (13) < 0.01 369 (55) 79 (13) < 0.01
density (stems/ha)
Standing dead wood 14.1 (3.4) 17.9 (4.6) 0.52 18.0 (3.9) 9.7 (2.7) 0.07 6.8 (1.5) 13.7 (2.4) 0.03
biomass (t/ha)
Woody residue (t/ha) na* 33.1 (12.8) − na* 57.4 (17.7) − na* 22.3 (4.2) − Total dead wood (t/ha) na 50.9 (15.6) − na 67.1 (97.3) − na 36.0 (5.5) − * KURTHet al. (1960) gave values of 0.1 to less than 5 m3(or 0.08 to 4 t/ha, assuming wood density of the most frequent tree species PIMO: 0.8 g/cm3) for different areas in the SNP, but no stand data is available.
4 Discussion
The three tree species dominating in the SNP, PIMO, PICE and LADE have different life history strategies. Understanding their ecological differences is important in order to grasp the development of high elevation forest communities in this part of the European Alps. Both PIMO and LADE are wind-dispersed, shade intolerant pioneer species (R I-CHARDSON and RUNDEL 1998, BERGE` S and CHEVALIER 2001). However, LADE can reach ages of 300 to 800 years (MCCOMB1955, RIOU-NIVERT2001) and will therefore be able to dominate over long periods of time, whereas an early successional stage dominated by PIMO is relatively short-lived. Seeds of both pioneer species require open mineral soil to germinate: PIMO seedlings are competitive in small openings (few cm), while LADE seedlings need larger patches caused by clear-cuts, avalanches, flooding or fire to establish successfully (SCHLOETH1998). Once established, LADE trees generally grow faster than other conifer species and quickly outgrow other pioneer species under favorable con-ditions (GOWER and RICHARDS 1990, SCHLOETH1998, KRÜSIand MOSER2000). PICE, in contrast, is a shade-tolerant species whose seeds are mainly dispersed by the European thickbilled nutcracker (Nucifraga caryocatactes caryocatactes) (LANNER 2000). PICE grows slowly but steadily once established. Although this species has, on average, a lower annual growth rate than LADE, its annual DBH and height increments equal those of PIMO under favorable conditions. Under low-light conditions the increments of PICE are, how-ever, considerably higher than those of both PIMO and LADE (KRÜSIand MOSER2000). While the survival of saplings is mostly determined by competition for light, compe-tition for water, nutrients and space becomes more important once the trees have success-fully established (OLIVER and LARSON 1996, BARNES et al. 1998). After pioneer cohort establishment, natural self-thinning (intraspecific competition) followed by vertical and horizontal stratification (interspecific competition) takes place. Eventually, the pioneer cohort will be lost and a late successional or old-growth stage will be reached (SPIESand FRANKLIN1996, FRANKLINet al. 2002).
In the present study we found high sapling density of PIMO in the early successional stages where canopy closure was lowest. After pioneer cohort establishment PIMO loses its competitive advantage in the sapling layer and shade tolerant PICE saplings start to establish themselves in the PIMO dominated forests. LADE, which under favorable
con-ditions (large openings in the mineral soil) establishes itself simultaneously with PIMO, grows much faster than PIMO and therefore is typically present in the overstory at the time PICE reaches this stratum. LADE will then remain a co-dominant species in the forest community even in the late successional stage dominated by PICE. With ongoing succession less light penetrates to the lower strata due to higher canopy closure and PICE becomes the most frequent species in the sapling layer. In our study area the successional changes during stand development were not affected by a considerable increase in the number of wild ungulates, especially red deer (Cervus elaphus L.), since 1940 (SCHÜTZet al. 2000), even though these ungulates were found to browse more heavily on PICE and PIAB saplings compared to pioneer PIMO saplings.
The lack of change in species composition and stand density over the time of obser-vation, the decrease of tree density and shift towards larger DBH classes between 1957 and 2001/02 as well as the high density of dead trees indicate that the development within the “mountain pine” stand type is still dominated by self-thinning processes (OLIVERand LARSON1996). A further indication that these stands are still in an early successional phase is the observation that the sapling layer still is composed mostly of PIMO. However, the slight increase in relative abundance of PICE saplings in the understory indicates that compositional changes will likely take place in the future. Yet, on the whole, these stands have not yet entered the understory reinitiation phase, suggesting that they are still largely even-aged.
In contrast, it is likely that self-thinning processes were completed in the “mixed” stand type already in 1957 as indicated by the high density of standing dead trees and the increased tree species diversity compared to the “mountain pine” stand type. Vertical and horizontal stratification were the main processes taking place in this forest type between 1957 and 2001/02, as indicated by the increase in tree species diversity with a slow drop-out of PIMO. The “mixed” stand type forests therefore are in a mid-successional stage today. Finally, in the “stone pine” stand type, many of the PIMO trees that were alive in 1957 died in the 45 years of observation due to vertical and horizontal stratification. This forest type has developed from a mid-successional stage, dominated by PIMO, LADE, and PICE, into a late successional stage, where PICE dominates and LADE is a significant stand component. The approximately 50 % decrease in tree density in all our stand types corresponds with the values reported in yield-tables for mono-culture forest stands of the same tree species (LANDESFORSTVERWALTUNGBADEN-WÜRTTEMBERG1966).
In agreement with the 50 % decrease in tree density we observed a strong increase in non-standing woody residue [1957: 0.1 to 5 m3, or 0.08 to 4 t/ha (assuming wood density
of the most frequent tree species PIMO: 0.8 g/cm3); 01/02: 36.0⫺67.1 t/ha]. In contrast,
standing dead wood biomass changed only slightly over the period of observation even though standing dead tree density decreased markedly. In 1957 most of the dead trees had low DBH (0.5 to 4 cm; KURTHet al. 1960), while in 2001/02 they belonged to much larger DBH classes.
Our results elucidated the successional development of continental subalpine forests after abandonment and our findings therefore mirror stand structural changes that might take place in similar mountain regions in the coming decades. However, we can only estimate how much time elapses until a pioneer stand dominated by PIMO reaches the late successional stage. Since the youngest stand type already was approximately 120 years old in 1957 and since 45 years were not enough time to proceed from “mountain pine” to “mixed” and from “mixed” to “stone pine”, respectively, we assume that the successional development in the SNP most likely takes longer than 250 years.
5 Acknowledgements
We thank Marty Jurgensen (Michigan Technological University) for many helpful com-ments and instructive linguistic adjustcom-ments on successive drafts of the manuscript. We are grateful to several volunteers for their help during data collection. This study was funded by the Swiss Federal Institute of Technology, Zurich (grant No. TH-1’/01⫺1). We also would like to express our gratitude to the Swiss National Park Service for the administrative and logistic support of our research in the SNP.
6 References
BÄNTZING, W., 1996: Landwirtschaft im Alpenraum unverzichtbar, aber zukunftslos? Landwirtschaft
im Alpenraum-unverzichtbar, aber zukunftslos: In: BÄNTZING, W. (ed.): Eine alpenweite Bilanz
der aktuellen Probleme und der möglichen Lösungen. Blackwell, Berlin. pp. 9⫺11.
BACHOFEN, H., ZINGG, A., 2001: Effectiveness of structure improvement thinning on stand structure
in subalpine Norway Spruce (Picea abies (L.) Karst.) stands. For. Ecol. Manag. 145: 137⫺149. BARNES, B.V., ZAK, D.R., DENTON, S.R., SPURR, S.H., 1998: Forest ecology. 4thed. Wiley, New York.
BEBI, P., KIENAST, F., SCHÖNENBERGER, W., 2001: Assessing structures in mountain forests as a basis for investigating the forest’ dynamics and protective function. For. Ecol. Manag. 145: 3⫺14. BECKER, A., BUGMANN, H., 2001: Global Change and mountain regions: initiative for collaborative
research. IGBP Report 49. IGBP Secretariat, Stockholm.
BERGE` S, L., CHEVALIER, R., 2001: Les exigencies e´cologiques des me´le`zes. In: RIOU-NIVERT, P. (ed.): Les guides du sylviculteur: Le me´le`ze. Institut pour le development forestier, Paris. pp. 52⫺59. BINKLEY, D., OLSSON, U., ROCHELLE, R., STOHLGREN, T. NIKOLOV, N., 2003: Structure, production and
resource use in some old-growth spruce/fir forests in the Front Range of the Rocky Mountains, USA. For. Ecol. Manag. 172: 271⫺279.
BRANG, P., 1989: Untersuchungen zur Zerfallsdynamik in unberührten Bergföhrenwäldern im
Schwei-zerischen Nationalpark. Schweiz. Z. Forstwes. 140: 155⫺163.
BROWN, J.K. 1974: Handbook for inventorying downed woody material. USDA For. Serv, Gen.
Tech. Rep., INT-GTR-16. Ogden, Utah.
BRUN, F., 2002: Multifunctionality of mountain forests and economic evaluation. Forest Policy and Economics 4: 101⫺112.
BÜRKI, A., 1981: Bestandesstrukturen im Gebirgsfichtenwald. Bei. Z. Schw. Forstw. 69.
CALLAWAY, R.M., 1998: Competition and facilitation on elevation gradients in subalpine forests in
the northern Rocky Mountains, USA. Oikos 82: 561⫺573.
DEMAS, G., PIUTTI, E., 1994: Structure of Swiss stone pine in northeastern Italy. In: SCHMIDT, W.,
HOLTMEIER, F.-K. (eds.): Proceedings ⫺ International Workshop on subalpine pines and their environment: the status of our knowledge. USDA For. Serv., Gen. Tech. Rep., INT-GTR-309, Ogden, Utah. pp. 226⫺239.
ELLENBERG, H., 1996: Vegetation Mitteleuropas und der Alpen in ökologischer, dynamischer und
historischer Sicht. 5thed., UTB, Stuttgart.
FRANKLIN, J.F., SPIES, T.A, VANPELT, R., CAREY, A.B., THORNBURGH, D.A., BERG, D.R., LINDENMAYER,
D.B., HARMON, M.E., KEETON, W.S., SHAW, D.C., BIBLE, K., CHEN, J., 2002: Disturbances and
structural development of natural forest ecosystems with silvicultural implications, using Douglas-fir forests as an example. For. Ecol. Manag. 155: 399⫺423.
GOWER, S.T., RICHARDS, J.H., 1990: Larches: deciduous conifers in an evergreen world. In their
harsh environments, these unique conifers support a net carbon gain similar to evergreens. BioScience 40: 818⫺826
GREIG-SMITH, P., 1983: Quantitative plant ecology. 3rd
ed. Blackwell, Oxford.
GUGGENBÜHL, P., 1962: Unsere einheimischen Nutzhölzer: Die gebräuchlichen Holzarten Mittel-und Nordeuropas. Stocker-Schmid, Dietikon-Zürich. 406 pp.
KAUFMANN, E., 2002: Schaftholz-Volumenfunktionen. Interner Bericht WSL, Birmensdorf.
KELLER, W., WOHLGEMUTH, T., KUHN, N., SCHÜTZ, M., WILDI, O., 1998: Waldgesellschaften der
Schweiz auf floristischer Grundlage. Mitt. Eidgenöss. Forsch. anst. Wald, Schnee, Landsch. 73: 93⫺357.
KIENAST, F., FRITSCHI, J., BISSEGGER, M., ABDERHALDEN, W., 1999: Modeling successional pattern of
high-elevation forests under changing herbivore pressure ⫺ responses at the landscape level. For. Ecol. Manage. 120: 35⫺46.
KRÜSI, B.O., MOSER, B., 2000: Impacts of snow and ungulates on the successional development of a mountain pine forest in the Swiss National Park. In: SCHÜTZ, M., KRÜSI, B.O., EDWARDS, P.J.
(eds.): Succession research in the Swiss National Park.. Sci. Council Swiss National Park, Liestal. pp. 131⫺164.
KURTH, A., WEIDMANN, A., THOMMEN, F., 1960: Beitrag zur Kenntnis der Waldverhältnisse im Schweizerischen Nationalpark. Mitt. Schweiz. Anst. forstl. Versuchswes. 36: 221⫺379.
LANDESFORSTVERWALTUNG BADEN-WÜRTTEMBERG 1966. Hilfstabellen für die Forsteinrichtung, Teil I.
Otto Kehrer KG, Freiburg i. Br. 163 pp.
LANNER, R.M., 2000: Seed dispersal in Pinus. In: RICHARDSON, D.M. (ed.): Ecology and biogeography
of Pinus. Cambridge Univ. Press, Cambridge. pp. 281⫺295.
LEMMON, P.E., 1957: A new instrument for measuring forest overstory density. J. For. 55: 667⫺668.
LONG, J.N., DANIEL, T.W., 1990: Assessment of growing stock in uneven-aged stands. W. J. Appl.
For. 5: 93⫺96.
MCCOMB, A. L., 1955: The European larch: its races, site requirements and characteristics. For. Sci. 1: 298⫺318.
OLIVER, C.D., LARSON, B.C., 1996: Forest stand dynamics. Wiley, New York. 520 pp.
PAROLINI, J.D., 1995: Zur Geschichte der Waldnutzung im Gebiet des heutigen Schweizerischen Nationalparks. Ph.D. Thesis, ETH, Zürich.
PIUSSI, P., 1994: Mixed cembran pine stands on the southern slope of the Eastern Alps. In:
SCHMIDT, W., HOLTMEIER, F.-K. (eds.): Proceedings ⫺ International Workshop on subalpine pines
and their environment: the status of our knowledge. USDA For. Serv., Gen. Tech. Rep., INT-GTR-309, Ogden, Utah. pp. 261⫺268.
PIUSSI, P., 2000: Expansion of European mountain forests. Forests in sustainable mountain
develop-ment: a state of knowledge report for 2000. In: PRICE, M.F., BUTT, N. (eds.): Task force
on forests in sustainable mountain forest development. IUFRO research series, CABI, Oxon. pp. 19⫺25.
PRICE, M.F., 1995: Mountain research in Europe: an overview of MAB Research from the Pyrenees
to Siberia In: JEFFERS, J.N.R. (ed.): Man and the Biospheres Series. UNESCO, Paris.
RICHARDSON, D.M., RUNDEL, P.W., 1998: Ecology and biogeography of Pinus: an introduction. In:
RICHARDSON, D.M. (ed.): Ecology and biogeography of Pinus. Cambridge Univ. Press, Cambridge. pp. 3⫺46.
RIEDERER, P., 1996: Berglandwirtschaft in der Schweiz. Landwirtschaft im Alpenraum-unverzichtbar,
aber zukunftslos: In: BÄNTZING, W., (ed.): Eine alpenweite Bilanz der aktuellen Probleme und
der möglichen Lösungen.. Blackwell, Berlin. pp. 117⫺139.
RIOU-NIVERT, P., 2001: Un re´sineux peu banal. In : RIOU-NIVERT, P., (ed.): Les guides du sylviculteur: Le me´le`ze. Institut pour le development forestier, Paris. pp. 10⫺16.
RISCH, A.C., SCHÜTZ, M., KRÜSI, B.O., KIENAST, F., WILDI, O., BUGMANN, H., submitted. An analysis
of successional pathways in subalpine forests using long-term empirical data. Plant Ecol. SCHLOETH, R., 1998: Die Lärche: ein intimes Baumporträt. 2nd edition. AT Verlag, Aarau. 112 pp.
SCHÖNENBERGER, W., 2000: Silvicultural problems in subalpine forests in the Alps. In: PRICE, M.F.,
BUTT, N., (eds.): Forests in sustainable mountain development: a state of knowledge report for
2000. Task force on forests in sustainable mountain forest development. IUFRO research series, CABI, Oxon. pp. 197⫺202.
SCHÜTZ, M., WOHLGEMUTH, T., ACHERMANN, G., KRÜSI, B.O., GRÄMIGER, H., 2000: Influence of
increasing grazing pressure on species richness in subalpine grassland in the Swiss National Park. In: SCHÜTZ, M., KRÜSI, B.O., EDWARDS, P.J.(eds.): Succession research in the Swiss National
Park.. Sci. Council Swiss National Park, Liestal. pp. 39⫺66.
SPIES, T.A., FRANKLIN, J.F., 1996: The diversity and maintenance of old-growth forests. In: SZARO,
R.C., JOHNSON, D.W. (eds.): Biodiversity in managed landscapes: theory and practice, Oxford,
New York, pp. 296⫺314.
STIFTUNG ARBIETSKREIS SCHREINERMEISTER 1991: Konstruktionsmappe Massivholz für Möbel- und
Innenausbau. DRW, Stuttgart.
STROBEL, G., 1997: Rottenstruktur und Konkurrenz im subalpinen Fichtenwald ⫺ eine modelhafte
STÖCKNER, G., 2002: Growth dynamics of Norway spruce (Picea abies (L.) Karst.) in natural spruce
forest ecosystems of the National Park Hochharz⫺ 2. Climax, ageing and decay phases. Forstw. Cbl. 121: 109⫺127.
TOMBACK, D.F., ARNO, S.F., KEANE, R.E., 2001: White bark pine communities: ecology and
resto-ration. Island Press, Washington, D.C.
TRENDLENBURG, R., MAYER-WEGELIN, H., 1955: Die Rohwichte des Holzes. In: MAYER-WEGELIN, H.
(ed.): Das Holz als Rohstoff Carl Hanser, München. pp. 292⫺346.
ZOLLER, H., 1995: Vegetationskarte des Schweizerischen Nationalparks. Erläuterungen. Nat. park⫺ Forsch. Schweiz. 85: 1⫺108.
Authors’ addresses: ANITA C. RISCH, MARTIN SCHÜTZ, BERTILO. KRÜSI, FELIX KIENAST, Swiss Federal
Institute for Forest, Snow and Landscape Research, Zürcherstrasse 111, 8903 Birmensdorf, Switzerland, E-Mail: anita.risch@wsl.ch, Fax: +41 1 739 22 15; LINDA M. NAGEL, Michigan Technological University, School of Forest Resources and Environmental Science, 1400 Townsend Drive, Houghton, MI 49931, USA; HARALD BUGMANN, Mountain Forest Ecology, Dept. of Forest Sciences, Swiss