REVIEW
Analytical techniques for single-cell metabolomics:
state of the art and trends
Andrea Amantonico&Pawel L. Urban&Renato Zenobi
Received: 30 March 2010 / Revised: 9 May 2010 / Accepted: 13 May 2010 / Published online: 11 June 2010 # Springer-Verlag 2010
Abstract Single-cell metabolomics is an emerging field that addresses fundamental biological questions and allows one to observe metabolic phenomena in heterogeneous populations of single cells. In this review, we assess the suitability of different detection techniques and present considerations on sample preparation for single-cell metabolomics. Although targeted analysis of single cells can readily be conducted using fluorescent probes and optical instruments (microscopes, fluorescence detectors), a comprehensive metabolomic approach requires a powerful label-free method, such as mass spectrometry (MS). Mass-spectrometric techniques applied to study small molecules in single cells include electrospray MS, matrix-assisted laser desorption/ionization MS, and secondary ion MS. Sample preparation is an important aspect to be taken into account during further development of methods for single-cell metabolomics.
Keywords Cell individuality . Cell-to-cell variability . Single-cell analysis . Small-molecule analysis . Ultrasensitive analysis
Introduction
One of the biggest challenges in bioanalysis is to detect and quantify molecules in single biological cells. Although the invention of optical microscopy provided the initial tool for observing single cells, analysis of chemical components of
cells requires implementation of much more sophisticated techniques and methods. Metabolomics is a rapidly growing field of biochemistry, targeting the analysis of low molecular weight species (molecular weight typically below 3,000), referred to as metabolites. The cell metabolome can be defined
as the set of all the metabolites present in cells [1,2] and it can
be considered the best indicator of an organism’s phenotype [3]. Changes in the metabolome represent the final response of an organism to genetic modification, disease, or environ-mental influences. In comparison with the proteome or transcriptome, the metabolome is much more chemically and physically diverse [4] and more dynamic. The range of metabolite concentrations can vary over several orders of
magnitude [4,5]. The Human Metabolome Database (http://
www.metabolomics.ca) contains hundreds of entries, and this covers only a small fraction of the metabolites present in eukaryotic cells. Accumulation of metabolomic data is generally constrained by the moderate throughput of the existing technology and sometimes by a limited availability of biological samples (e.g., blood and other tissues). Most current technologies only collect metabolomic data averaged over many cells. Although cell populations often exhibit phenotypic heterogeneity, one can hypothesize that individ-ual cells may also differ with respect to the content of various metabolites. In particular, phenotypic heterogeneity of cell populations is known to be related to the occurrence of pathological events, such as cancerogenesis [6], as well as important physiological processes, such as bistability in gene expression [7]. Since the metabolome provides an impres-sion of various processes occurring in the cells, one can expect that the information contained in the cellular metabolomes would allow important insights into biochem-ical heterogeneity of cell populations. Therefore, it is imperative to establish a reliable method for single-cell metabolomic studies.
Published in the special issue on Focus on Bioanalysis with guest editors Antje J. Baeumner, Günter Gauglitz, and Frieder W. Scheller. A. Amantonico
:
P. L. Urban:
R. Zenobi (*)Department of Chemistry and Applied Biosciences, ETH Zurich, 8093 Zurich, Switzerland
e-mail: [email protected] DOI 10.1007/s00216-010-3850-1
Several approaches have already been established that permit single-cell studies of the genome [8–12] and the
proteome [13–21]; however, numerous technical difficulties
hinder developments in single-cell metabolomics. A num-ber of initial studies, reviewed in this article, attempted to address this gap and it is expected that, in the future, gathering information on the metabolomes of individual cells will be as straightforward as obtaining genetic information is nowadays. Although the introduction of polymerase chain reaction in molecular biology enabled amplification and genetic analysis of DNA isolated from single cells and dramatically accelerated the development of genomics, we believe that the availability of high-throughput methods for analysis of metabolites in single cells will substantially enhance our abilities to gain insight into biochemical reaction networks.
The aim of this article is to provide a critical account of different strategies to study metabolism in single cells. For a general overview of single-cell studies, the reader is referred to the article by Borland et al. [22] and the books edited by Anselmetti [23] and Lu [24]. Presently, only a limited number of analytical techniques can cope with the stringent requirements of metabolomic analysis of single cells, which include a need for very high sensitivity, high throughput, and the capability to detect a wide range of analytes. We focus our discussion on the methods that fulfill at least some of these requirements; giving highest priority to mass spec-trometry (MS), which we consider a particularly promising platform for single-cell metabolomics.
Detection techniques for single-cell metabolomics Fluorescence detection
Fluorometric assays are generally based on the presence of fluorescent tags or probes. Only very few metabolites can be analyzed directly in single cells by autofluorescence; for example, An et al. [25] developed a protocol for label-free quantitative analysis of intracellular carotenoids in cells of red yeast (Phaffia rhodozyma), which is based on the intrinsic fluorescence of these compounds. In many cases, fluorometric assays can be applied in targeted analysis of small-molecule compounds in cells and cell extracts [15, 26–32]. The key advantages of fluorescence detection of intracellular metabolites include high sensitivity, capabili-ties for performing studies on concentration dynamics, its nondestructive nature, and high-throughput capabilities.
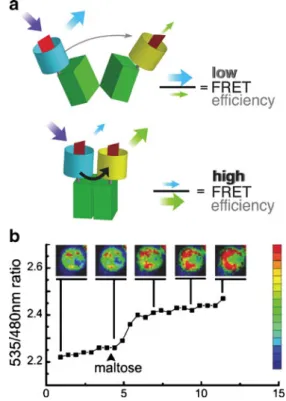
In general, following the introduction of a fluorescent probe into the cell, the readout can be done with an established technique, i.e., fluorescence microscopy. For example, the group of Frommer [28] developed a protein-based nanosensor for detection of maltose uptake by living
yeast cells. The nanosensor was expressed in yeast cells, allowing direct monitoring of changes in cytosolic maltose concentrations in response to the external supply of the nutrient. This strategy makes use of bacterial periplasmic binding proteins: on binding the substrate, the probe proteins transform their hinge-bend movement into in-creased fluorescence resonance energy transfer between
two coupled green fluorescent proteins (Fig.1a). With use
of fluorescence microscopy, relative concentrations of
maltose can be monitored in individual cells (Fig. 1b).
The method has been further adapted for detection of glutamate release from neurons [33]: in this case, the fluorescent indicator protein for glutamate consists of the glutamate/aspartate binding protein (ybeJ) from Escher-ichia coli, expressed on the surface of rat hippocampal neurons or PC12 cells.
In another study, a genetically encoded fluorescent sensor of adenylate nucleotides was developed [26]. This combines a circularly permuted variant of green fluorescent protein with a bacterial regulatory protein, GlnK1. Confor-mational changes in such a fusion protein, caused by the
binding of the analyte to the adenosine 5′-triphosphate
Fig. 1 (a) Substrate-induced conformational changes. The enhanced cyan fluorescent protein donor chromophore was fused to the N terminus of maltose-binding protein; the enhanced yellow fluorescent protein acceptor chromophore was attached to the C terminus. Binding of maltose brings the N and C termini, which are located at the distal ends of the two lobes, respectively, closer together, thereby increasing fluorescence resonance energy transfer (FRET). (b) Visualization of dynamic maltose concentration change in the cytosol of yeast. (Adapted from [28]. Copyright 2002 National Academy of Sciences, USA)
(ATP)-binding domain lead to changes in fluorescence intensity. According to the authors, at physiological ATP
and adenosine 5′-diphosphate (ADP) concentrations, the
binding site is saturated, but competition between the two substrates causes the sensor to behave as a reporter of the ATP to ADP concentration ratio [26].
The fluorescent probes described above are expressed in living cells. One can expect that production of these foreign complexes by the cells may lead to alteration of the native physiological status of the cells on the proteome level as well as the metabolome level; therefore, the applicability of this strategy in single-cell metabolomic studies may be limited. Although nanosensor probes can, in principle, be developed for different analytes, fluorescence detection poses a limit on the number of compounds detectable simultaneously. Although current studies involving the application of fluorescent probes to metabolites make use of fluorescence microscopy, implementation of such assays in combination with flow cytometry or fluorescence-activated cell sorting [34] could enable studies of intracel-lular metabolites in large populations of cells. Since cytometry can already be realized in microchip format [35], such microscale cell handling and signal readout could be applied to record signals from metabolite probes in cell populations. In fact, a number of cytometric assays probing cell viability, metabolic functions, and redox states or determining the content of lipids and certain secondary metabolites (e.g., photosynthetic dyes) in single cells, with (or, in some cases, without) staining, are available (for more information, see the review by Davey and Kell [34]).
Fluorescence detection is often used in combination with sample preparation steps. These can include single-cell lysis and separation of analytes by capillary electrophoresis (CE)
(see also “Sample preparation: a key challenge”). In an
early study by Kennedy et al. [36], amino acids could readily be analyzed in extracts from individual neuron cells obtained from snails. Naphthalene-2,3-dicarboxyaldehyde was used to label amino acids in the cell extract to enable analysis by CE with laser-induced-fluorescence (LIF) detection. Several studies using CE-LIF analysis, focusing among others on analysis of neurotransmitters in single
cells, were conducted by the group of Sweedler [29, 37].
Chang and Yeung [27] analyzed catecholamines, such as epinephrine and norepinephrine, in single adrenal medul-lary cells by CE-LIF, taking advantage of the native fluorescence of these compounds. Very recently the same group demonstrated an interesting CE-LIF-based assay for
ultrasensitive detection of cellular NAD+ and NADH,
which incorporates in-capillary enzymatic amplification [38].
The group of Dovichi [15] introduced the concept of chemical cytometry and developed a range of methods for chemical analysis of single cells, normally using CE with
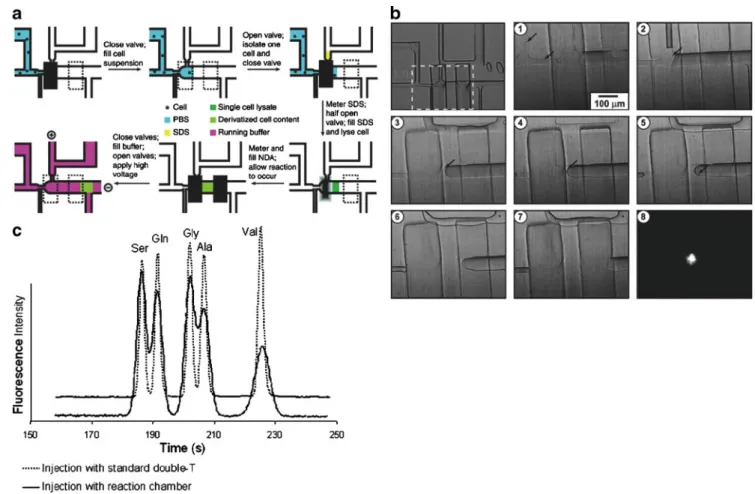
LIF detection. The same group also pioneered the develop-ments in single-cell proteomics. Moreover, an attempt has recently been made to adapt chemical cytometry to study large metabolite molecules extracted from single cells [39]. In this study, the ganglioside GM1, tagged with a fluorescent dye, tetramethylrhodamine, was taken up and metabolized by pituitary tumor cells. Following in-capillary lysis, the glycosphingolipids released were separated by CE and detected by LIF. Nonetheless, it should be pointed out that glycosphingolipids are relatively large metabolites (molecular weight above 1,200); therefore, it can be assumed that the labeled ganglioside GM1 has the same physiological behavior as the nonlabeled molecules. How-ever, since fluorescent tags are usually large compared with the vast majority of metabolites, this approach generally cannot be applied in single-cell metabolomics. In another example, tags were introduced into analyte molecules after cell lysis to enable detection by LIF. This strategy was implemented in the work of Wu et al. [40] using a
multifunction microchip (Fig. 2). In fact, the notion of
LIF detection on a microchip has gained popularity. For instance, Chen et al. [41] recently used microchip CE-LIF to determine glutathione and hydrogen peroxide in mito-chondrial compartments of apoptotic cells.
Electrochemical detection
The high sensitivity of electrochemical detectors makes them suitable for applications in single-cell analysis. In fact, they can be used as intra—or extracellular probes for label-free detection of metabolites present in the cell and those released to the extracellular microenvironment. However, only electroactive species can be analyzed, which makes the electrochemical methods applicable only to targeted studies of metabolites in single cells. A range of microscale electrochemical methods were introduced to monitor various physiological processes [42]; for example, release of metabolites, such as catecholamines and oxygen, can be readily measured electrochemically [43]. Several other articles focus on the monitoring of exocytosis using various
types of microelectrodes [44,45].
Electrochemical sensors can also be used as detectors after electrophoretic separations. CE in conjunction with less selective electrochemical probes can provide a platform for analysis of a larger number of metabolites than electrochemical sensors used directly without a separation step. In the aforementioned early work of Kennedy et al. [36], neurotransmitters were detected in snail neuron cells by CE with voltammetric detection. Another outstanding example is the study by Olefirowicz and Ewing [46]. They used very thin capillaries to sample the cytoplasm contents from single nerve cells of a snail. This was followed by CE separation and amperometric detection with a two-electrode
configuration. Excellent selectivity of this method was demonstrated for catecholamine and indolamine neuro-transmitters and their metabolites. Cells can also be lysed in capillary prior to analysis [47]. Recently, Weng and Jin [48] presented a simple assay for detection of amino acids in individual lymphocytes by CE with electrochemical detection. Femtomole to attomole levels of four amino acids could be detected with this method. In other work, tryptophan and glutathione were simultaneously analyzed in individual rat hepatocytes by CE [49]. A dual electrode consisting of two different materials (carbon fiber and Au/ Hg) was used. Ai et al. [50] fabricated an amperometric sensor based on electrochemical deposition of platinum nanoparticles on the surface of carbon fiber microdisk electrodes via nanopores containing a polymer matrix, and subsequently used it for real-time monitoring of oxidative bursts from single plant protoplasts. Amperometric detec-tion has also been used in combinadetec-tion with microfluidics [51]: cell injection, loading, cell lysis, electrokinetic
transportation, and detection were all integrated in the microchip with a double-T injector coupled with an end-channel amperometric detector. In this fashion, ascorbic acid could be quantified in single plant cells [51].
Mass-spectrometric detection
MS is a label-free analytical technique which permits identification of virtually any analyte, and moreover provides structural information. During the past few years, the popularity of mass-spectrometric analysis of small molecules has increased dramatically, and MS has become a key
enabling tool in the field of metabolomics [3, 52, 53].
Methodological progress has also been made to adapt MS for single-cell analysis. Single-cell MS has been demonstrated
by a number of examples, using various types of cells [54–
57], however, relatively few studies have presented mass-spectrometric analysis of metabolites in single cells;
repre-sentative examples are listed in Table1.
Fig. 2 Single-cell lysis and derivatization. (a) The process of single-cell analysis on an integrated microchip. (b) Frames of a video of single-cell analysis corresponding to a. The first picture shows the overview of the system with all inlets; the dashed box denotes the area of the video that has been taken. The numbered video frames are in order of appearance. The last frame shows the fluorescence of the naphthalene-2,3-dicarboxyaldehyde (NDA)-derivatized contents of a
single cell in the reaction chamber when illuminated with a focused 405-nm diode laser. Arrows point to the positions of individual cells. (c) On-chip reaction and separation. Electropherograms of micellar electrokinetic chromatography separations of five NDA-derivatized amino acids on the chip. PBS phosphate-buffered saline, SDS sodium dodecyl sulfate (Adapted from [40]. Copyright 2004 National Academy of Sciences, USA)
T able 1 Examples of studies demonstrating the analysis of metabolites in single cells by mass spectrometry T ype of cell Focus metabolites Cell selection/isolation Sample treatment Analytical technique References Basophil leukemia (RBL-2H3) cells, rat Histamine, serotonin, leukotriene B4 and other compounds Cell contents extracted with a gold-coated glass capillary nanospray tip – NanoESI-Q- T OF-MS [ 73 , 11 4 ] Neurons, Aplysia californica Neurotransmitters Microdissection Cell extracts injected into CE capillary CE-nanoESI-MS [ 75 ] Plant cells, Allium cepa and Nar cissus pseudonar cissus Carbohydrates, amino acids In situ tissue analysis, sampling with laser T issue mounted on a glass slide LAESI-MS [ 74 ] Peritoneal mast cells, rat Serotonin, histamine Flow cytometry –
Laser vaporization/ ionization
MS [ 11 5 ] Bone marrow , mouse Histamine and other intracellular metabolites Microsuction pipette – MALDI-TO F-MS [ 72 , 11 6 ] Neurons, Aplysia californica Neuropeptides Microdissection Direct deposition on a MALDI plate MALDI-MS [ 63 ] Leaf and bulb, T ulipa gesneriana Underivatized carbohydrates Pressure probe glass microcapillary – MALDI-TO F-MS [ 11 7 ] Neurons, Aplysia californica Cell — cell signaling peptides Microdissection Sur gical dissection of cerebral ganglia, protease MALDI-TO F/ T OF-MS [ 11 8 ] Neurons, Aplysia californica Neuropeptides Microdissection Stretched sample method aided with glass beads and Parafilm MALDI-MS, MS imaging [ 64 ] Dark glands on leaves, placenta, stamens and styli, pollen, Hypericum sp., Arabidopsis thaliana Naphthodianthrones, flavonoids Cell sampling using microcapillaries and laser microdissection – LDI-MS, MS imaging [ 69 ] Arabidopsis thaliana Alkanes, alcohol, fatty acids – T issue sprayed with a matrix MALDI-MS, MS imaging [ 70 ] Neurons, Aplysia californica Lipids Microdissection Cell homogenized, centrifuged, supernatant injected into CE capillary CE-MALDI-MS [ 62 ] MDA-MB-231 cancer cell Unidentified small-molecule metabolites Cells deposited on the NIMS support, visualized by fluorescence microscopy Fixing with paraformaldehyde, permeabilization with methanol NIMS [ 71 ] J774 cells Cholesterol, fatty acids Spotted on tar get plate Cooling under vacuum, removal of water T OF-SIMS, MS imaging [ 76 ] Benign prostatic hyperplasia (BPH), HeLa, human cheek cells Adenine, phosphocholine, cholesterol, phospholipids – Samples flash-frozen T OF-SIMS (C 60 ), MS imaging [ 11 9 ] Human breast cancer (MCF7), Madin — Darby canine kidney (MDCK) cells, and mouse fibroblasts (NIH/3 T3) Phosphocholine – Imaging/profiling T OF-SIMS [ 120 ] Basophilic leukemia (RBL -2H3) mast cells, rat Cholesterol, phospholipids Spotted on tar get plate Cooling under vacuum, removal of water T OF-SIMS, MS imaging [ 77 ] Bacillus atr ophaeus Amino acids, or ganic acids Single cells samples and separated according to aerodynamic diameters – BAMS [ 79 ] Oocyte, Xenopus laevis Carbohydrates, o rganic acids, fatty acids Sampling inside the cell using a micromanipulator and capillary Miniaturized at-line derivatization GC-MS [ 84 ] ESI electrospray ionization, Q quadrupole, TO F time of flight, MS mass spectrometry , CE capillary electrophoresis, LAESI laser -ablation electrospray ionization, MALDI matrix-assisted laser desorption/ionization, LDI laser desorption/ionization, NIMS nanostructure initiator mass spectrometry , SIMS secondary ion mass spectrometry , BAMS bioaerosol mass spectrometry , GC gas chromatography
Laser desorption/ionization and matrix-assisted laser
desorption/ionization (MALDI) [58, 59] are versatile soft
ionization techniques, widely utilized in bioanalysis. Al-though most applications of MALDI-MS are in proteomics, its potential in metabolomics has recently been shown in cases where selected MALDI matrices do not blanket the
low mass range with background peaks [60,61]. MALDI is
a straightforward, direct analytical technique, which in many cases does not require extensive sample preparation. The measurements are normally not strongly dependent on the sample matrix, compared with other techniques such electrospray ionization (ESI). A large number of single-cell studies employing MALDI-MS were conducted in the group of Sweedler. Methods for analysis of peptides and proteins in single neurons of animals, such as Aplysia
californica, have been developed [55,56,62–64].
MALDI-MS has also been shown to have outstanding sensitivity for primary metabolites, such as nucleotides [65]: the sensitiv-ity is sufficient to detect nucleotides in single yeast cells. Moreover, extensive sample treatment, including enzymatic amplification [66], can be carried out directly on a MALDI plate to increase the sensitivity of the measurements. MALDI-MS imaging (for a review, see [67]) can provide information on the spatial distribution of metabolites in
biological specimens [68], including single cells [69, 70].
Overall, it can be considered a powerful platform for ultrastructural chemical analysis of microscale samples. Recently, a new MS approach, called nanostructure initiator MS, has also been shown to be capable of detecting small
molecules in single cells [71] (Fig.3).
Several articles on MS-based single-cell metabolomics originated from the group of Masujima. These researchers presented an early study in which histamine was detected in single bone-marrow-derived mast cells [72]. The single cells were initially sucked into a microcapillary and released onto a hydrophobic MALDI plate where co-crystallization with a MALDI matrix took place. More recently, they presented a similar micromanipulator-based method for cell selection [73]; however, this time the contents of the cell were aspirated into a nanoESI tip. This was followed by electrospraying and ionization of the sample in front of the orifice of a mass spectrometer. The strong point of this study is that the mass spectra appear to be full of interesting features, some of which are metabo-lites with biological relevance. In fact, metabometabo-lites such as histamine, serotonin, and leukotriene B4 could be detected and identified by MS/MS in samples containing larger numbers of mammalian cells. Interestingly, even the subcellular distribution of the target metabolites could be studied.
Another innovative method for metabolic profiling of single plant cells is based on laser-ablation ESI (LAESI) [74]. LAESI uses a focused mid-IR laser beam with a
wavelength of 2.94 µm, which is absorbed by water, to sample material directly from live tissue. The resulting ablation plume undergoes postionization by an electrospray
(Fig. 4a). Ablation is conducted using an etched optical
fiber tip, which approaches to within approximately 30 µm
of the cell surface (Fig.4b). The spatial resolution was also
in the 30-µm range, limiting LAESI to the analysis of fairly large plant cells and small cell populations, e.g., of onion
and daffodil bulb epidermal cells. Figure 4c shows a
spectrum with a number of peaks with high signal-to-noise ratios. One of the advantages of LAESI, compared with other laser-ablation-based techniques, such as MALDI-MS, is that there is virtually no chemical back-ground. Another advantage of this method, compared with the nanoESI approach outlined above, is that the single-cell sampling appears to be straightforward; cells of a tissue can be analyzed directly in situ. Although LAESI uses laser light to sample intracellular metabolites, other ambient ionization techniques could potentially be applied in single-cell analysis, including extractive ESI and desorption ESI. However, presently, restrictions in the spatial resolution of these techniques pose limits on their applicability in this field.
Similarly to fluorescence and electrochemical methods, MS can greatly benefit from coupling with CE. Along these lines, an interesting approach to single-cell metabolomics was demonstrated by the group of Sweedler [75]. Low molecular weight compounds were analyzed in single neurons of Aplysia californica by CE coupled with
nanoESI-MS (Fig. 5). The inherent advantage of the
CE-MS approach is the ability to analyze metabolites in complex samples, such as single-cell extracts. The limits of detection obtained with this CE-nanoESI-MS method were in the low nanomolar range. In addition, MS/MS was used to identify unknown metabolites.
Secondary ion MS (SIMS) is a less common mass-spectrometric method in the field of single-cell metabolo-mics, but its application to analysis of small molecules in
single cells has been successfully demonstrated [76, 77].
On the other hand, bioaerosol MS (BAMS) [78] is a real-time analytical technique that has been used to follow biochemical and morphological changes within populations of single bacterial cells [79]. Both techniques provide outstanding sensitivity. However, the amount of chemical information obtained from SIMS and BAMS spectra is relatively low; therefore, we think that these two techniques will find some specific applications in which accurate chemical information on the identities of many intracellular metabolites is not required. For example, nanoSIMS [80, 81] could potentially be applied to resolve isotopic
variations in metabolites of microbial cells [82,83].
An exceptional approach was recently presented by Koek et al. [84]. These researchers demonstrated the
feasibility of gas chromatography (GC)-MS for metabolic profiling of extremely large cells (frog oocytes). Although comprehensive single-cell metabolomics of smaller cells by GC-MS is not feasible at the moment, miniaturization of this technique could potentially lead to further applications. Other techniques
Specific methods targeting particular metabolic pathways in single cells have been in use for a long time. These include autoradiography of cells preincubated with a radioisotopi-cally labeled compound [85]. In the case of certain metabolites of particular biological interest, for example, cyclic adenosine 3′,5′-monophosphate, assays can be con-ducted routinely by standard methods described in the literature [32], some of which might also be applicable to single cells.
Spectroscopic methods other than those outlined above are also applicable to analysis of metabolites in single cells. For instance, glycogen metabolism was studied in yeast cells by single-cell spectroscopy in conjunction with image analysis [86]. In other work, Shinohara and Wang [87] studied dopamine release from a mammalian nerve cell,
after incubation with a drug, by using an enzyme-catalyzed luminescence method. The method provided high sensitiv-ity, rapid measurement, and did not require any pretreat-ment of the single-cell sample. Goff et al. [88] demonstrated a method for measurement of ethanol formation in single living cells of unicellular algae, using synchrotron Fourier transform infrared spectromicroscopy.
Both methods [87, 88] are label-free and can be used to
observe intracellular dynamics of metabolite concentra-tions. However, the above-mentioned approaches are mainly applicable to targeted metabolomic studies in cells. Several studies have also been done using Raman spectroscopy [89–92]; they demonstrated detection of nucleic bases and amino acids in single cells. Very recently, Moritz et al. [93] studied the effect of a drug on metabolic states of individual Escherichia coli cells by following their Raman signatures. However, using Raman spectroscopy, it is not possible to distinguish the free species from the corresponding molecules incorporated into large biomole-cules. Nuclear magnetic resonance (NMR) is yet another powerful tool for structural characterization of organic
compounds, including metabolites [94, 95]. Nevertheless,
owing to relatively low sensitivity, NMR has found only
Fig. 3 Laser nanostructure initiator mass spectrometry (NIMS) and fluorescent analysis of a single cancer cell. (a) Fluorescent image of an MDA-MB-231 cancer cell after laser NIMS analysis, fixing with paraformaldehyde, permeabilization with methanol, and staining with both 4,6-diamidino-2-phenylindole (blue) and Alexa 555-cytokeratin antibodies (red). The cell’s location is indicated by being surrounded by a green fluorescent box formed with the same laser as that used for mass analysis at high intensity. (b) Higher-resolution fluorescent image of the cell. (c) Mass spectra from the cell with the use of laser
NIMS (blue) compared with 100 cells measured with ion NIMS (green), matrix-assisted laser desorption/ionization analysis of 400 cells (red), and 500 cells measured with nanoelectrospray ionization (black). Laser NIMS spectra were performed with bis(tridecafluoro-1,1,2,2-tetrahydrooctyl)tetramethyl disiloxane initiator calibrated with Na+, K+, phosphocholine, and 1-palmitoyllysophosphatidylcholine. Scale bar 28 μm, asterisk matrix background ion. (Reprinted from [71] with permission from Macmillan Publishers Ltd, copyright 2007)
scarce applications in chemical analysis of high abundance metabolites in large neurons Grant et al. [96]. An interesting report was presented by Krojanski et al. [97].
These authors designed a microslot NMR probe for metabolomic studies. The sensitivity was in the 100-pmol range. Therefore, further efforts need to be made to render NMR applicable to metabolomic analysis of single biolog-ical cells.
Sample preparation: a key challenge
Apart from the development of sensitive and comprehen-sive detection systems, a big challenge in single-cell metabolomics is to cope with the fast changes of intracel-lular concentrations of metabolites. This imposes stringent
requirements on the sample preparation [98, 99]. In our
opinion, not enough attention has been paid to this aspect so far, and the choice of a particular single-cell sample preparation protocol has often been dictated by the detection technique used. Standard methods used in metabolomic studies performed on bulky samples are not directly applicable to single-cell metabolomics. We also believe that microdissection of single cells from tissues, which has gained popularity in genetic analysis of excised cells, has limited applicability in single-cell metabolomics; the content of more labile metabolites might be altered when performing this invasive procedure. Therefore, in addition to the main challenges imposed by single-cell analysis (cell selection and handling, minute amounts of analytes, etc.), sample preparation protocols that do not alter the metabolic status of the cells analyzed must be developed. Obviously, they must include an efficient quenching step of the cellular metabolism. Moreover, slow lysis methods, such as chemical lysis of cells with a thick cell wall layer using surfactants, might induce an undesired physiological reaction of cells, and consequently hinder the detection of relevant metabolic phenomena. Hence, it is imperative to develop fast lysis methods that do not affect the natural metabolic status of the cells studied. One should also take the necessary precautions to prevent decomposi-tion of the analytes following their release from the cells; this can be achieved, for example, by lowering the temperature or by application of organic solvents.
Frequently, additional sample treatment steps need to be incorporated into the single-cell analytical platform to ensure efficient detection of the target molecules. These may include purification and separation. In-capillary sepa-rations have frequently been incorporated into platforms for single-cell proteomics [15]. CE can be considered a general-purpose sample preparation technique for the
analysis of cells [100, 101]. However, the disadvantage of
using CE is the difficult introduction of single cells to microcapillaries.
Although many of the issues related to the preparation of single cells for metabolomic studies have been addressed in
Fig. 4 (a) Instrumental setup for single-cell analysis by laser-ablation electrospray ionization (LAESI) mass spectrometry. The mid-IR ablation products (red dots) generated by the etched optical fiber tip (F) are intercepted by the electrospray plume (black dots) and postionized to form ions (green dots) sampled by the mass spectrometer (MS). A long-distance video microscope (fiber monitor, FMM) is utilized to maintain a constant distance between the fiber tip and the sample surface (S). The sample is placed on a three-axis translation stage (TS), and a second video microscope (cell spotting microscope, CSM) is used to target the cells. The electrospray is produced by applying a high voltage (HV) to the capillary emitter (E) and by maintaining a constant solution flow rate with a syringe pump (SP). Pulses from the mid-IR optical parametric oscillator (OPO) are coupled to the optical fiber, adjusted by a fiber chuck (C) and a five-axis fiber mount (FM), using two Au-coated mirrors (M) and a CaF2
lens (L). (b) The Etched optical fiber tip and the raised surface of turgid epidermal cells of Allium cepa were approximately 30 μm apart. For optimum coupling of the laser energy, this distance was similar to the diameter of the tip. Further removal of the fiber tip from the cell surface resulted in no ablation, whereas closer approach often led to damage to the cell or the fiber tip. (c) LAESI mass spectrum produced by 100 laser pulses for A. cepa. The inset depicts the eight fragments in the tandem mass spectrum of the nominal m/z 175 ion produced by collision-activated dissociation. (Adapted with permis-sion from [74]. Copyright 2009 American Chemical Society)
the literature, there are not many examples of platforms integrating various sample preparation steps. Many of the problems related to single-cell sample preparation, offering advantages in terms of integration of multiple steps as well as miniaturization, can be solved by employing micro-fluidics [102–106]. An example of this direction is the study carried out by Wu et al. [40]: the authors used a microfluidic chip to address different sample preparation steps, including cell handling, lysis, chemical derivatiza-tion, separaderivatiza-tion, and detection of several amino acids
(Fig.2).
Conclusions and future trends
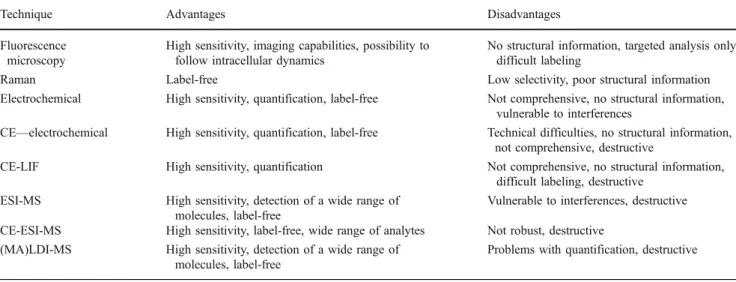
Table 2 presents a critical evaluation of the suitability of
different detection techniques for single-cell metabolomic studies. The reports cited in this review presented analyses of only a handful of metabolites in single cells. Although electrochemical, fluorescence, and Raman-based methods limit the number of compounds that can
be analyzed simultaneously, mass-spectrometric methods can potentially provide information on a large number of chemical species. In fact, since MS has already proven to be a very powerful option for metabolomic studies on macroscopic samples, we expect that MS will become the main analytical platform for single-cell metabolo-mics. Various modes of MS provide sensitive and versatile platforms for analysis of a wide range of chemically diverse metabolites in numerous types of
cells (Table 1). However, further development is needed
in the areas of sample preparation and interfacing. Implementation of new interfaces which could provide efficient transfer of single-cell lysates to a mass spectrom-eter, and high-throughput analysis will open up the possibility to perform single-cell metabolomics on large populations of cells. This can be accomplished by the introduction of discrete plugs of samples delivered within microscale capillaries [107] or channels in microchips [108]. Such miniature interfaces are also highly compat-ible with microscale sample handling and the preparation steps imposed by the small size of the samples involved.
Fig. 5 Different subcellular regions of the R2 neuron (neurite versus soma) yield different metabolite profiles. In this case, compounds with m/z 146±0.5 Da are compared in the extracted ion electropherograms
shown. The inset shows an image of an isolated Aplysia R2 neuron and neurite. (Reprinted with permission from [75]. Copyright 2009 American Chemical Society)
Table 2 Features characteristic of the main techniques considered for application in single-cell metabolomics Technique Advantages Disadvantages Fluorescence
microscopy
High sensitivity, imaging capabilities, possibility to follow intracellular dynamics
No structural information, targeted analysis only, difficult labeling
Raman Label-free Low selectivity, poor structural information Electrochemical High sensitivity, quantification, label-free Not comprehensive, no structural information,
vulnerable to interferences
CE—electrochemical High sensitivity, quantification, label-free Technical difficulties, no structural information, not comprehensive, destructive
CE-LIF High sensitivity, quantification Not comprehensive, no structural information, difficult labeling, destructive
ESI-MS High sensitivity, detection of a wide range of molecules, label-free
Vulnerable to interferences, destructive CE-ESI-MS High sensitivity, label-free, wide range of analytes Not robust, destructive
(MA)LDI-MS High sensitivity, detection of a wide range of molecules, label-free
Problems with quantification, destructive
New sample handling tools are also emerging in the field of nanotechnology, and could potentially support some of the steps required in single-cell metabolomics, including sampling of metabolites from individual cells [109]. The development of such enabling technologies could also give rise to new discoveries in the new fields of scientific
inquiry, such as micrometabolomics [110,111] and
single-cell microbiology [112,113] .
The majority of studies on metabolites in single cells are related to the analysis of neurotransmitters in neurons
(Table 1). This parallels the rapid developments in
neuroscience. In fact, many studies focused on large neuronal cells, which proved to be convenient test samples for demonstrating various analytical methods targeting single cells. On the other hand, the analysis of small unicellular microorganisms is especially appealing owing to the potential for addressing fundamental questions in bioscience. Individual unicellular microorganisms can preserve their physiological function when studied sepa-rately, whereas the cells obtained from a tissue are expected to have altered metabolism. Another problem is that presently it is only possible to analyze a handful of target metabolites in single cells. On top of that, reference materials for single-cell analysis are still missing; therefore, attention should also be paid to this aspect. Without analytical standards and quality control rules, quantification of individual metabolites and validation of the new single-cell metabolomic methods will not be possible.
Soon, it may be feasible to link the developmental and/or physiological state of a cell with its metabolome. It should also become possible to apply single-cell metabolomic tools to distinguish subsets of cells with different metabolomes within individual cancers, which would complement standard methods used for evaluation of phenotypic heterogeneity of cancer cells [6], and possibly lead to further developments in fundamental cancer research.
In conclusion, the studies reviewed here point to the fact that single-cell metabolomics is still in the early stage of development. With numerous limitations of present analyt-ical approaches, it is not possible to conduct routine analyses of many metabolites in single cells, as it is in the case of conventional metabolomics involving macroscopic samples. Hence, the next challenge in bioanalytics is to develop even more sensitive and comprehensive assays for detection and quantification of various metabolites of biological interest in single cells, including smaller unicel-lular organisms, such as yeast and bacteria. These methods will certainly become a key enabling technology for research in systems biology. The data obtained from single-cell metabolomic studies will result in the creation of models of cellular metabolism that will not be biased by averaging the metabolite concentrations over multiple cells. Such models should find applications in fundamental
studies but could also be extrapolated to applied research, for example, when considering the cellular responses to chemotherapeutics.
Acknowledgements We would like to thank Matthias Heinemann and Thomas Schmid for stimulating discussions. P.L.U. was funded by a Marie Curie Intra European Fellowship received within the Seventh European Community Framework Programme (contract no. PIEF-GA-2008-219222—MESEL).
References
1. Hollywood K, Brison DR, Goodacre R (2006) Proteomics 6:4716–4723
2. Ryan D, Robards K (2006) Anal Chem 78:7954–7958 3. Blow N (2008) Nature 455:697–700
4. Dunn WB, Bailey NJ, Johnson HE (2005) Analyst 130:606–625 5. Bennett BD, Kimball EH, Gao M, Osterhout R, Van Dien SJ,
Rabinowitz JD (2009) Nat Chem Biol 5:593–599
6. Diks SH, Peppelenbosch MP (2004) Trends Mol Med 10:574–577 7. Davidson CJ, Surette MG (2008) Annu Rev Genet 42:253–268 8. Lange BM (2005) Curr Opin Plant Biol 8:236–241
9. Locke JC, Elowitz MB (2009) Nat Rev Microbiol 7:383–392 10. Walker A, Parkhill J (2008) Nat Rev Microbiol 6:176–177 11. Zeng Y, Novak R, Shuga J, Smith MT, Mathies RA (2010) Anal
Chem 82:3183–3190
12. Zhang K, Martiny AC, Reppas NB, Barry KW, Malek J, Chisholm SW, Church GM (2006) Nat Biotechnol 24:680–686 13. Cai L, Friedman N, Xie XS (2006) Nature 440:358–362 14. Choi PJ, Cai L, Frieda K, Xie XS (2008) Science 322:442–446 15. Cohen D, Dickerson JA, Whitmore CD, Turner EH, Palcic MM,
Hindsgaul O, Dovichi NJ (2008) Annu Rev Anal Chem 1:165–190 16. Gutstein HB, Morris JS, Annangudi SP, Sweedler JV (2008)
Mass Spectrom Rev 27:316–330
17. Huang B, Wu H, Bhaya D, Grossman A, Granier S, Kobilka BK, Zare RN (2007) Science 315:81–84
18. Newman JR, Ghaemmaghami S, Ihmels J, Breslow DK, Noble M, DeRisi JL, Weissman JS (2006) Nature 441:840–846 19. Raj A, van Oudenaarden A (2008) Cell 135:216–226 20. Raser JM, O'Shea EK (2004) Science 304:1811–1814
21. Shim JU, Olguin LF, Whyte G, Scott D, Babtie A, Abell C, Huck WT, Hollfelder F (2009) J Am Chem Soc 131:15251–15256 22. Borland LM, Kottegoda S, Phillips KS, Allbritton NL (2008)
Annu Rev Anal Chem 1:191–227
23. Anselmetti D (ed) (2009) Single cell analysis: technologies and applications. Wiley-VCH, Weinheim
24. Lu C (ed) (2010) Chemical cytometry: ultrasensitive analysis of single cells. Wiley-VCH, Weinheim
25. An GH, Suh OS, Kwon HC, Kim K, Johnson EA (2000) Biotechnol Lett 22:1031–1034
26. Berg J, Hung YP, Yellen G (2009) Nat Meth 6:161–166 27. Chang HT, Yeung ES (1995) Anal Chem 67:1079–1083 28. Fehr M, Frommer WB, Lalonde S (2002) Proc Natl Acad Sci
USA 99:9846–9851
29. Fuller RR, Moroz LL, Gillette R, Sweedler JV (1998) Neuron 20:173–181
30. Moro AJ, Cywinski PJ, Korsten S, Mohr GJ (2010) Chem Commun 1085–1087
31. Secrist JA 3rd, Barrio JR, Leonard NJ (1972) Science 175:646– 647
32. Williams C (2004) Nat Rev Drug Discov 3:125–135
33. Okumoto S, Looger LL, Micheva KD, Reimer RJ, Smith SJ, Frommer WB (2005) Proc Natl Acad Sci USA 102:8740–8745
34. Davey HM, Kell DB (1996) Microbiol Rev 60:641–696 35. Srisa-Art M, Bonzani IC, Williams A, Stevens MM, DeMello
AJ, Edel JB (2009) Analyst 134:2239–2245
36. Kennedy RT, Oates MD, Cooper BR, Nickerson B, Jorgenson JW (1989) Science 246:57–63
37. Lapainis T, Scanlan C, Rubakhin SS, Sweedler JV (2007) Anal Bioanal Chem 387:97–105
38. Xie W, Xu A, Yeung ES (2009) Anal Chem 81:1280–1284 39. Whitmore CD, Hindsgaul O, Palcic MM, Schnaar RL, Dovichi
NJ (2007) Anal Chem 79:5139–5142
40. Wu H, Wheeler A, Zare RN (2004) Proc Natl Acad Sci USA 101:12809–12813
41. Chen Z, Li Q, Wang X, Wang Z, Zhang R, Yin M, Yin L, Xu K, Tang B (2010) Anal Chem 82:2006–2012
42. Huang L, Kennedy RT (1995) Trends Anal Chem 14:158–164 43. Cannon DM Jr, Winograd N, Ewing AG (2000) Annu Rev
Biophys Biomol Struct 29:239–263
44. Kozminski KD, Gutman DA, Davila V, Sulzer D, Ewing AG (1998) Anal Chem 70:3123–3130
45. Zhang B, Adams KL, Luber SJ, Eves DJ, Heien ML, Ewing AG (2008) Anal Chem 80:1394–1400
46. Olefirowicz TM, Ewing AG (1990) Anal Chem 62:1872–1876 47. Swanek FD, Chen GY, Ewing AG (1996) Anal Chem 68:3912–
3916
48. Weng QF, Jin WR (2003) Anal Chim Acta 478:199–207 49. Jin W, Li X, Gao N (2003) Anal Chem 75:3859–3864 50. Ai F, Chen H, Zhang SH, Liu SY, Wei F, Dong XY, Cheng JK,
Huang WH (2009) Anal Chem 81:8453–8458
51. Xia F, Jin W, Yin X, Fang Z (2005) J Chromatogr A 1063:227–233 52. Dettmer K, Aronov PA, Hammock BD (2007) Mass Spectrom
Rev 26:51–78
53. Han J, Datla R, Chan S, Borchers C (2009) Bioanalysis 1:1665– 1684
54. Li L, Golding RE, Whittal RM (1996) J Am Chem Soc 118:11662–11663
55. Romanova EV, Rubakhin SS, Monroe EB, Sweedler JV (2009) In: Anselmetti D (ed) Single cell analysis: technologies and applications. Weinheim, Wiley-VCH
56. Rubakhin SS, Sweedler JV (2007) Nat Protoc 2:1987–1997 57. van Veelen PA, Jimenez CR, Li KW, Geraerts WPM, Tjaden UR,
van der Greef J (1994) J Control Release 29:223–229
58. Hillenkamp F, Peter-Katalinić J (2007) MALDI MS: a practical guide to instrumentation, methods and applications. Wiley-VCH, Weinheim
59. Karas M, Bachmann D, Bahr U, Hillenkamp F (1987) Int J Mass Spectrom Ion Process 78:53–68
60. Edwards JL, Kennedy RT (2005) Anal Chem 77:2201–2209 61. Nordstrom A, Want E, Northen T, Lehtio J, Siuzdak G (2008)
Anal Chem 80:421–429
62. Page JS, Rubakhin SS, Sweedler JV (2000) Analyst 125:555–561 63. Rubakhin SS, Greenough WT, Sweedler JV (2003) Anal Chem
75:5374–5380
64. Zimmerman TA, Rubakhin SS, Romanova EV, Tucker KR, Sweedler JV (2009) Anal Chem 81:9402–9409
65. Amantonico A, Oh JY, Sobek J, Heinemann M, Zenobi R (2008) Angew Chem Int Ed 47:5382–5385
66. Urban PL, Amantonico A, Fagerer SR, Gehrig P, Zenobi R (2010) Chem Commun 2212–2214
67. Reyzer ML, Caprioli RM (2007) Curr Opin Chem Biol 11:29–35 68. Benabdellah F, Touboul D, Brunelle A, Laprevote O (2009) Anal
Chem 81:5557–5560
69. Holscher D, Shroff R, Knop K, Gottschaldt M, Crecelius A, Schneider B, Heckel DG, Schubert US, Svatos A (2009) Plant J 60:907–918
70. Jun JH, Song Z, Liu Z, Nikolau BJ, Yeung ES, Lee YJ (2010) Anal Chem 82:3255–3265
71. Northen TR, Yanes O, Northen MT, Marrinucci D, Uritboonthai W, Apon J, Golledge SL, Nordstrom A, Siuzdak G (2007) Nature 449:1033–1036
72. Shimizu M, Ojima N, Ohnishi H, Shingaki T, Hirakawa Y, Masujima T (2003) Anal Sci 19:49–53
73. Mizuno H, Tsuyama N, Harada T, Masujima T (2008) J Mass Spectrom 43:1692–1700
74. Shrestha B, Vertes A (2009) Anal Chem 81:8265–8271 75. Lapainis T, Rubakhin SS, Sweedler JV (2009) Anal Chem
81:5858–5864
76. Ostrowski SG, Kurczy ME, Roddy TP, Winograd N, Ewing AG (2007) Anal Chem 79:3554–3560
77. Piehowski PD, Davey AM, Kurczy ME, Sheets ED, Winograd N, Ewing AG, Heien ML (2009) Anal Chem 81:5593–5602 78. Gard E, Mayer JE, Morrical BD, Dienes T, Fergenson DP,
Prather KA (1997) Anal Chem 69:4083–4091
79. Tobias HJ, Pitesky ME, Fergenson DP, Steele PT, Horn J, Frank M, Gard EE (2006) J Microbiol Meth 67:56–63
80. Lechene C, Hillion F, McMahon G, Benson D, Kleinfeld AM, Kampf JP, Distel D, Luyten Y, Bonventre J, Hentschel D, Park KM, Ito S, Schwartz M, Benichou G, Slodzian G (2006) J Biol 5:20
81. Mcmahon G, Glassner BJ, Lechene CP (2006) Appl Surf Sci 252:6895–6906
82. Kuypers MM, Jorgensen BB (2007) Environ Microbiol 9:6–7 83. Orphan VJ, House CH, Hinrichs KU, McKeegan KD, DeLong
EF (2001) Science 293:484–487
84. Koek MM, Bakels F, Engel W, van den Maagdenberg A, Ferrari MD, Coulier L, Hankemeier T (2010) Anal Chem 82:156–162 85. Fliermans CB, Schmidt EL (1975) Appl Microbiol 30:676–
684
86. Cahill G, Walsh PK, Donnelly D (2000) Biotechnol Bioeng 69:312–322
87. Shinohara H, Wang F (2007) Anal Sci 23:81–84
88. Goff KL, Quaroni L, Wilson KE (2009) Analyst 134:2216–2219 89. Buckmaster R, Asphahani F, Thein M, Xu J, Zhang M (2009)
Analyst 134:1440–1446
90. Hedegaard M, Krafft C, Ditzel HJ, Johansen LE, Hassing S, Popp J (2010) Anal Chem 82:2797–2802
91. Hermelink A, Brauer A, Lasch P, Naumann D (2009) Analyst 134:1149–1153
92. Schuster KC, Reese I, Urlaub E, Gapes JR, Lendl B (2000) Anal Chem 72:5529–5534
93. Moritz TJ, Taylor DS, Polage CR, Krol DM, Lane SM, Chan JW (2010) Anal Chem 82:2703–2710
94. Beckonert O, Keun HC, Ebbels TM, Bundy J, Holmes E, Lindon JC, Nicholson JK (2007) Nat Protoc 2:2692–2703
95. Motta A, Paris D, Melck D (2010) Anal Chem 82:2405–2411 96. Grant SC, Aiken NR, Plant HD, Gibbs S, Mareci TH, Webb AG,
Blackband SJ (2000) Magn Reson Med 44:19–22
97. Krojanski HG, Lambert J, Gerikalan Y, Suter D, Hergenroder R (2008) Anal Chem 80:8668–8672
98. Canelas AB, ten Pierick A, Ras C, Seifar RM, van Dam JC, van Gulik WM, Heijnen JJ (2009) Anal Chem 81:7379–7389 99. Winder CL, Dunn WB, Schuler S, Broadhurst D, Jarvis R,
Stephens GM, Goodacre R (2008) Anal Chem 80:2939–2948 100. Huang WH, Ai F, Wang ZL, Cheng JK (2008) J Chromatogr B
866:104–122
101. Woods LA, Roddy TP, Ewing AG (2004) Electrophoresis 25:1181–1187
102. El-Ali J, Sorger PK, Jensen KF (2006) Nature 442:403–411 103. Le Gac S, van den Berg A (2010) Trends Biotechnol 28:55–62 104. Price AK, Culbertson CT (2007) Anal Chem 79:2614–2621 105. Roman GT, Chen Y, Viberg P, Culbertson AH, Culbertson CT
(2007) Anal Bioanal Chem 387:9–12
107. Pei J, Li Q, Lee MS, Valaskovic GA, Kennedy RT (2009) Anal Chem 81:6558–6561
108. Fidalgo LM, Whyte G, Ruotolo BT, Benesch JL, Stengel F, Abell C, Robinson CV, Huck WT (2009) Angew Chem Int Ed 48:3665–3668 109. Meister A, Gabi M, Behr P, Studer P, Voros J, Niedermann P, Bitterli J, Polesel-Maris J, Liley M, Heinzelmann H, Zambelli T (2009) Nano Lett 9:2501–2507
110. Kraly JR, Holcomb RE, Guan Q, Henry CS (2009) Anal Chim Acta 653:23–35
111. Moco S, Schneider B, Vervoort J (2009) J Proteome Res 8:1694– 1703
112. Brehm-Stecher BF, Johnson EA (2004) Microbiol Mol Biol Rev 68:538–559
113. Dethlefsen L, Relman DA (2007) Environ Microbiol 9:8–10
114. Mizuno H, Tsuyama N, Date S, Harada T, Masujima T (2008) Anal Sci 24:1525–1527
115. Fung EN, Yeung ES (1998) Anal Chem 70:3206–3212 116. Shimizu M, Levi-Schaffer F, Ojima N, Shingaki T, Masujima T
(2002) Anal Sci 18:107–108
117. Gholipour Y, Nonami H, Erra-Balsells R (2008) J Am Soc Mass Spectrom 19:1841–1848
118. Rubakhin SS, Sweedler JV (2008) Anal Chem 80:7128– 7136
119. Fletcher JS, Rabbani S, Henderson A, Blenkinsopp P, Thompson SP, Lockyer NP, Vickerman JC (2008) Anal Chem 80:9058– 9064
120. Berman ES, Fortson SL, Checchi KD, Wu L, Felton JS, Wu KJ, Kulp KS (2008) J Am Soc Mass Spectrom 19:1230–1236