ORIGINAL ARTICLE
Estrogen Modulates Hepatic Gene Expression and Survival
of Rainbow Trout Infected with Pathogenic Bacteria
Yersinia
ruckeri
Michael Wenger&Aleksei Krasnov&Stanko Skugor&
Elinor Goldschmidt-Clermont&Ursula Sattler&
Sergey Afanasyev&Helmut Segner
Received: 22 February 2012 / Accepted: 3 July 2012 / Published online: 24 July 2012 # Springer Science+Business Media, LLC 2012
Abstract In the aquatic environment, fish are exposed to various stimuli at once and have developed different re-sponse mechanisms to deal with these multiple stimuli. The current study assessed the combined impacts of estro-gens and bacterial infection on the physiological status of fish. Juvenile rainbow trout were exposed to two different
concentrations of 17β-estradiol (E2) (2 or 20 mg/kg feed)
and then infected with three concentrations of Yersinia ruck-eri, a bacterial pathogen causing massive losses in wild and farmed salmonid populations. Organism-level endpoints to assess the impact of the single and combined treatments
included hepatic vitellogenin transcript expression to evalu-ate the E2 exposure efficiency and survival revalu-ate of pathogen-challenged fish. The two E2 doses increased vitellogenin levels within the physiological range. Infection with Y. ruck-eri caused mortality of trout, and this effect was significant-ly enhanced by a simultaneous exposure to high E2 dose.
The hormone reduced survival at intermediate and high (104
and 106colony forming units, cfu) bacterial concentrations,
but not for a low one (102 cfu). Analysis of hepatic gene
expression profiles by a salmonid 2 k cDNA microarray chip revealed complex regulations of pathways involved in immune responses, stress responses, and detoxicification pathways. E2 markedly reduced the expression of several genes implicated in xenobiotic metabolism. The results sug-gest that the interaction between pathogen and E2 interfered with the fish’s capability of clearing toxic compounds. The findings of the current study add to our understanding of multiple exposure responses in fish.
Keywords Disease resistance . 17β-Estradiol . Immunity .
Xenobiotics metabolism . Rainbow trout . Yersinia ruckeri
Introduction
In their natural and farm environments, fish are exposed to multiple external and internal stimuli, including endocrine perturbations, pollutants, and pathogens. In the past, studies
of“single stimulus, single effect” prevailed. Limitations of
this research strategy are obvious in light of the growing body of evidence that combined exposures lead to altera-tions that can be markedly different from the effects of
single stressors (e.g., Kiesecker 2002; Sexton and Hattis
2007; Crain et al. 2008; Wenger et al. 2011). Therefore,
interest for a better understanding of interactive and
Electronic supplementary material The online version of this article (doi:10.1007/s10126-012-9473-0) contains supplementary material, which is available to authorized users.
M. Wenger (*)
Neuro-Endocrine Immune Interactions Research Group, Institute of Anatomy, University of Zurich,
Winterthurerstrasse 190, 8057 Zurich, Switzerland e-mail: [email protected] A. Krasnov
:
S. Skugor:
S. Afanasyev Nofima,Postbox 210, 1431 Ås, Norway E. Goldschmidt-Clermont
Institute of Veterinary Bacteriology, University of Bern, Länggass-Strasse 122,
3012 Bern, Switzerland U. Sattler
:
H. SegnerCenter for Fish and Wildlife Health, Department of Pathobiology, University of Berne,
Laenggassstrasse 122, 3012 Bern, Switzerland S. Afanasyev
Sechenov Institute of Evolutionary Physiology and Biochemistry, St. Petersburg 194223, Russia
cumulative effects of joint exposures is increasingly grow-ing. Recent advances of high-throughput analytical techni-ques enable researchers to combine targeted experimental studies on multiple stressors with hypotheses-free screening of molecular responses that may reveal biological effects, which are hard to predict based on existing knowledge on the response to single exposures.
Sex steroid hormones are known as immunomodulators in mammals and may act in a similar way in fish
(Casanova-Nakayama et al.2011; Milla et al.2011; Liarte et al.2011).
The potential role of sex steroids for disease resistance of fish is of substantial interest and importance for aquaculture as well as in environmental research. Effects of androgens on various components of fish immune system have been addressed in studies with different species and isolated cells
(reviewed in Milla et al. (2011)). While the action of
andro-gens appears to be predominantly suppressive, estroandro-gens have been reported to both stimulate and inhibit immune
processes (Straub2007; Milla et al.2011). Estrogen effects
on the fish immune system were found to be primarily suppressive, be it at the level of immune gene expression
(e.g., Tilton et al.2006), soluble immune factors such as
lysozyme or immunoglobulins (e.g., Thilagam et al.2009),
immune cell functions such as phagocytosis activity
(Watanuki et al. 2002), or overall immunocompetence
against pathogens (Wenger et al. 2011). The suppressive
effect might be explained by competition between the im-mune system and the reproductive system for energy resour-ces. Thus, E2 would mediate a trade-off between two energy-costly processes, immune defense and reproduction, as it has been shown for other vertebrates (French et al.
2009; Barber et al. 2011). There exists circumstantial
evi-dence that the immunocompetence of reproducing fish is
compromised (Rice2001; Yada and Nakanishi2002).
Cur-rently, however, we lack understanding of the drivers and mechanisms behind this phenomenon. Also, environmental substances with sex steroid-like activities may be able to modulate the immune system of exposed fish
(Casanova-Nakayama et al. 2011; Milla et al. 2011). The aquatic
environment receives a variety of hormonally active com-pounds from sewage treatment plants, industry, animal farms,
etc. (Sumpter and Johnson 2005). Many of these so-called
endocrine disruptors are able to bind to estrogen receptors (ER), thereby mimicking the activity of endogenous ER
ligands; they include both natural estrogens such as 17
β-estradiol (E2) and synthetic chemicals such as ethinylβ-estradiol. To date, studies on the effects of environmental estrogen-active compounds on fish focused on disturbances of reproduction and sexual development, for example, feminization of male fish
(e.g., Jobling et al.1998; Fenske et al.2005). More recently, the
potential of estrogen-active environmental contaminants to modulate immunocompetence of exposed fish has attracted
attention (Shved et al.2009; Thilagam et al.2009; Jin et al.
2010; Cabas et al.2012). However, the ability of environmental
estrogen-active compounds to modulate the immune parame-ters of exposed fish does not necessarily implicate an influence on disease resistance. To assess the potential impact of envi-ronmental estrogens on the immunocompetence of fish, chal-lenge experiments, in which fish are exposed to pathogens, are needed. Strong evidence for the reduced capability of estrogen-exposed fish to combat a bacterial pathogen was recently
provided by Wenger et al. (2011). Juvenile rainbow trout
(Oncorhynchus mykiss) exposed to E2 showed significantly reduced survival after infection with Yersinia ruckeri compared to a non-E2-exposed control group challenged with the patho-gen. The effect of the hormone on pathogen resistance coincid-ed with a rcoincid-educcoincid-ed ability to up-regulate several complement
genes in response to the bacterial infection (Wenger et al.2011).
The present study aims to gain a broader understanding of how environmental estrogens influence the physiological status of rainbow trout under bacterial pathogen challenge. To this end, gene expression profiles in the liver of bacteria-infected fish kept under control conditions or under E2 exposure were assessed using a salmonid cDNA microarray chip designed for studies of responses to stressors and
pathogens (Krasnov et al. 2005; Jorgensen et al. 2008).
The liver was selected as a target organ due to its important
role in the (innate) immunity of fish (Rice2001) and, on the
other hand, because it is the central metabolic organ of the vertebrate body executing a broad range of metabolic
pro-cesses and functions (Hinton et al. 2008). Experimentally,
we applied a multi-factorial design using different levels of E2 and bacteria in various combinations. The efficiency of the E2 treatment was assessed by measuring the hepatic mRNA levels of vitellogenin (vtg), which is under direct control of the estrogen receptor being the most widely used biomarker for an estrogenic exposure.
Materials and Methods Experimental Setup
Juvenile rainbow trout (average weight, 1.15 g; average length, 5 cm) were obtained from a local trout farm (Pisci-culture de la Gruyère, Neirivue, Switzerland) and kept in aerated glass tanks with a flow-through of 1 l/s of normal tap water (municipally non-chlorinated, but UV-treated water, which is a mix of groundwater and spring water with an average water temperature of 13.5±0.9 °C) until 3 days before the challenge experiment. The fish were divided into three groups with two replicates per group to obtain three
different 17beta-estradiol (E2) treatments (no E2−control
feed0NE2, low-dose E202 mg E2/kg food0LE2,
high-dose E2020 mg E2/kg food0HE2; Fig.1). Five individuals
bacteriologically before the start of the treatment. Feeds
were prepared as described in Wenger et al. (2011). Shortly,
commercially available dry trout food (Biomar, Brande, Denmark) was spiked with E2 (Sigma, Buchs, Switzerland) and then processed according to the alcohol evaporation
method as described by Guerrero (1975). The initial feeding
level was at 3 % of body weight for 5 weeks and was adjusted accordingly every 2 weeks. During the experiment, feeding level was reduced to 1.5 % of body weight per day until the end of the experiment and included the E2-enriched diet. Three days before the challenge experiment, the three groups were sub-divided into 12 challenge groups with two replicates per group and 75 fish/replicate. Each replicate was kept in a separate aerated glass tank (volume, 120 l; flow-through, 0.8 l/s; average temperature, 13.8±0.1 °C) for the duration of the experiment.
Infection with Y. ruckeri
Y. ruckeri strain JF3685 was grown overnight in Luria Bertani broth at 25 °C with aeration. Cell suspensions were then prepared in sterile phosphate-buffered saline (pH 7.4).
The bacterial concentration was adjusted according to the optical density at 600 nm, confirmed by plate count from serial dilutions, and indicated as colony forming units (cfu)/ ml solution. Infection with Y. ruckeri was conducted as
previously described in Wenger et al. (2011). For infection,
fish (n075/treatment group) were transferred and kept in
aerated 30-l tanks/replicate filled with 5 l of normal tap water (non-chlorinated but UV-treated municipal water, temperature 13.8±0.7 °C) for 1 h with four different
bacte-rial concentrations (no Yersinia0negative control, 102
colo-ny forming units/ml (cfu)0Y2, 104 cfu0Y4, 106cfu0Y6;
Fig.1) and then re-transferred to their original tanks. Next,
fish were sampled at day 0 (before infection), day 3, and day 10 post-infection (p.i.). At each sampling, ten fish/replicate (total, 20 fish/treatment group) were sacrificed using MS-222 (ready-to-use, buffered 3-aminobezoic acid ethyl ester methanesulphonate, Argent Chemical Laboratories, Red-mont, CA, USA, dose 150 mg/L). Fish length and weight were first measured and then liver, head kidney, and spleen were carefully dissected and placed in 1 ml RNAlater© (Ambion, Austin, TX, USA) at 4 °C for 24 h and afterwards
stored at−20 °C until further processing. Ten liver samples
Fig. 1 Experimental design with treatment groups and respective nomenclature. All measurements and results were compared to the negative control group NE2. The design of microarray and qPCR analyses and numbers of differentially regulated genes are shown
(treatment groups included in the analyses are in bold). More details are presented in“Materials and Methods”. E2 17β-estradiol, cfu colo-ny forming units/milliliter
per treatment group were used for vitellogenin transcript measurements and five samples (three plus two per repli-cate) were used for microarray analysis. The experiment ended at day 15 p.i. when no more mortality occurred.
To confirm the Yersinia infection as the cause of mortal-ity, a re-isolation of Y. ruckeri from infected fish was per-formed after every sampling as described in Wenger et al.
(2011). Samples were taken freshly from the liver (before
storing), spleen, and head kidney of five sampled fish, plated on blood agar, and incubated for 48 h at 22 °C. Re-isolated bacteria were identified phenotypically using the API20E® system (BioMérieux (Suisse) SA, Geneva, Swit-zerland). The identity was then confirmed by sequencing of
the 16 S rRNA gene according to Kuhnert et al. (2002).
Survival rate analysis was performed using Mantel–Haens-zel log-rank test to detect differences (p<0.05 for significant and p<0.001 for highly significant) between negative con-trol and treatment groups as well as within and between different treatment groups. The software used to perform this statistical analysis was NCSS 2004 (NCSS, Kaysville, UT, USA).
Microarray Analyses
Microarray analyses were performed in three treatment E2 groups (Y6-NE2, Y6-LE2, and Y6-HE2; n05 fish (three plus two per replicate) randomly picked and analyzed per
treatment group; see Fig.1) infected with a high
concentra-tion of bacteria, totalling in 15 microarrays, and compared to a pool of five fish from negative control (NE20no E2, no Y. ruckeri). Total RNA was extracted and purified from the sampled livers by using a combined Trizol Plus/PureLink RNA Mini Kit (Invitrogen, Basel, Switzerland) extraction
method according to the manufacturer’s protocol. Yield and
purity of extracted RNA were tested on a NanoDrop® ND-1000 (NanoDrop Technologies Inc., Wilmington, DE, USA). The salmonid fish cDNA microarray platform SFA2.0 (GEO Omnibus GPL6154) includes 1,800 genes, each printed in six spot replicates. Synthesis of cDNA and hybridization were carried out as described in Koskinen et
al. (2004). Shortly, samples with 10μg RNA in each were
labeled with Cy3-dUTP (pooled sample of untreated fish used as reference) and Cy5-dUTP (fish from the exposed groups) (Amersham Biosciences, UK); labels were intro-duced during cDNA synthesis using SuperScript III RT (Invitrogen, Basel, Switzerland). The cDNA synthesis was
performed at 46 °C for 3 h in 25-μl reaction volumes. RNA
was degraded by adding 2.5 M NaOH at 37 °C for 15 min and alkaline was neutralized with 2 M HEPES buffer. Tar-gets were then combined and purified using Microcon YM-30 filter (Millipore, Billerica, USA). The microarray slides were pretreated with blocking solution (1 % BSA fraction V, 20× SSC, and 5 % SDS) at 50 °C for 30 min, then washed
with 2× SSC (3 min) and 0.2× SSC (3 min). For hybridiza-tion, Lifter Slips (Erie Scientific, Portsmouth, NH, USA)
were placed on the slides. Labels were adjusted to 80-μl
volumes and contained 1.3× Denhardt’s, 3× SSC, 0.3 %
SDS, 0.67μg/μl polyadenylate, and 1.4 μg/μl yeast tRNA.
Hybridization was carried out overnight at 60 °C in a water bath; ArrayIt® Hybridization Chamber was used. Next, slides were washed in 0.5× SSC/0.1 % SDS (15 min), 0.5× SSC/0.01 % SDS (15 min), and twice in 0.06× SSC (3 min each) at room temperature in dim lighting with gentle agitation. Slides were dried using ArrayIt® Microarray High-Speed Centrifuge. Scanning was performed on a Gen-ePix Personal 4100A microarray scanner (Molecular Devi-ces, CA, USA) and images were processed with GenePix
Pro 6.0. The spots were filtered by criterion (I−B)/(SI+SB)≥
0.6, where I and B are the mean signal and background
intensities and SIand SBare the standard deviations,
respec-tively. The low-quality spots were excluded from analyses and the genes presenting with less than three high-quality spots on a slide were discarded. After subtraction of median
background from median signal intensities, the log2-ER (test
to control expression ratios) was calculated. Lowess nor-malization was performed first for the whole slide and next for 12 metarows and four metacolumns per slide. The data were submitted to GEO Omnibus (GSE38763).
Statistical analyses were performed in three stages: first, technical accuracy was assessed by difference of the mean
log2-ER from zero (six spot replicates per each gene;
Stu-dent's t-test, p < 0.01); second, the genes with technically significant changes in at least three of five samples in at least one study group were selected and difference from
uninfected control (log2-ER equal to zero) was assessed
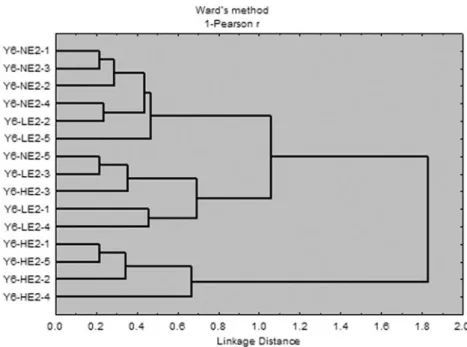
(one sample t-test, p< 0.05). The differentially expressed genes that responded to Yersinia were selected at this stage. Finally, effects of E2 were assessed with one-way ANOVA followed with Newman–Keuls test (p<0.05). All study groups analyzed with microarray were infected with the pathogen and E2 was the only differential factor. Hierarchi-cal clustering of samples was performed by profiles of differentially expressed genes. Pearson’s r was used as a distance metric and a tree was constructed with Ward’s method.
Quantitative Real-Time RT-PCR
The qPCR analyses were carried out with six treatment groups and five fish/replicate of treatment group (total of ten fish/treatment group). Total RNA was extracted from liver tissue using RNEasy Mini Kit (Qiagen AG,
Hombrech-tikon, Switzerland) according to the manufacturer’s
proto-col. Possible genomic DNA contamination was removed using TURBO DNA-free™ (Ambion, Austin, TX, USA). Yield and purity of extracted RNA were tested on a
NanoDrop® ND-1000 (NanoDrop Technologies Inc., Wil-mington, DE, USA) according to the manufacturer’s proto-col. Measurements of 260/280 ratio and 260/230 ratio were made in triplicate and only samples with a range of 1.8–2.1 (260/280 ratio) and 1.7–2.0 (260/230 ratio) were used for subsequent steps. For cDNA synthesis, total RNA amount
was adjusted to 1 μg per 8-μl solution and then
reverse-transcribed using the following reagents per 8μl sample: 80
U RNAse inhibitor, 10 mM of each dNTP, 200 U M-MLV Reverse Transcriptase, 500 ng Random Primers (all
Prom-ega AG, Wallisellen, Switzerland), and 1μg total RNA.
Primers and probes (Table1) were designed using Primer
Express Version 3.0 software (Applied Biosystems, Rotkreuz, Switzerland) produced by Microsynth (Balgach, Switzerland) and spanned intron/exon boundaries when appropriate infor-mation was accessible. Internal probes were labeled at the 5’ end with carboxyfluorescein (FAM) and at the 3’ with 6-carboxytetramethylrhodamine (TAMRA). Primer and probe efficiencies were assessed by generating a dilution curve representing tenfold dilution steps with at least five measure-ment points in triplicate and calculated according to the
equa-tion E010(−1/slope)−1 where E02 equals 100 % efficiency
corresponding to a slope of−3.32. Quantification was
per-formed using the TaqMan® real-time RT-PCR assay (Applied Biosystems). All analyses were conducted on an Applied Biosystems 7500 Fast Real-Time PCR System (Applied Bio-systems) in triplicate with the following steps: 2 min at 50 °C, 10 min at 95 °C, and 45 cycles of 15 s at 95 °C and 1 min at 60 °C (point of data collection). Each sample contained
12.5μl Taqman® PCR Universal Master Mix (Applied
Bio-systems, Rotkreuz, Switzerland), 500 nM of forward primer
and reverse primer, respectively, 160 nM internal probe, 6μl
DEPC-treated water (Ambion Inc.), and 2μl of template to a
final volume of 25μl. DEPC-treated water (Ambion Inc.) was
used as a negative control template in each analysis. Expres-sion levels of all target transcripts were normalized against 18 S rRNA, which was used as a reference gene and measured using the TaqMan® Ribosomal RNA Control Reagents kit (Applied Biosystems) according to the manufacturer’s proto-col. 18 S rRNA expression did not show a significant variation between samples and was therefore considered suitable as a reference gene. The efficiency of the supplied primers for the reference gene was tested by generating a dilution curve representing tenfold dilution steps as previously described. ER of the different treatment groups were calculated using REST 2009—Relative Expression Software Tools, version
2.0.13 (Pfaffl et al.2002). Differences between the expression
ratios of the treatment groups were determined using Pair
Wise Fixed Reallocation Randomisation Test© (Pfaffl et al.
2002). To test for significant differences between replicates
within the treatment groups at each sampling point, one-way analysis of variance (ANOVA) for normally distributed data
and Kruskal–Wallis ANOVA for unequal distributed data
were used. These statistical analyses were performed using NCSS 2004 (NCSS, Kaysville, UT, USA). All differences with p<0.05 were considered as statistically significant and p<0.001 as highly significant.
Results
Hepatic Vitellogenin Expression
The efficiency of exposure to E2 was tested by measuring hepatic vtg mRNA expression using quantitative real-time
RT-PCR. Samples (n015) were taken before the start of E2
treatments and again immediately before the onset of the challenge experiment (after 5 weeks of exposure). By this time, significant up-regulation of vtg was detected in those groups receiving E2-enriched food, with expression ratios ER (to control group) of 4,213±542 in LE2 and 32,036± 3,719 in HE2 (p<0.001 in both groups), while no significant elevation was observed in group NE2 (ER02.063±0.241). Also, the difference between LE2 and HE2 was significant (p<0.001). No significant differences in vtg were detected in the replicate groups.
Survival Analysis
The survival rates were determined in control and E2-treated rainbow trout exposed to four concentrations of Y. ruckeri. No significant differences in mortalities were detected between the replicates (p > 0.05), and therefore results of the replicates were combined. Also, no mortalities occurred in the negative control group (no bacteria, no estrogen), which was evidence for Yersinia infection-related mortalities in
bacteria-infected groups Y4 and Y6 (Fig. 2). No mortalities
were recorded in the groups exposed to E2 exposure only (NE2, LE2, HE2) and the lowest dose of bacteria
—102
cfu (data not shown). In the groups infected
with 104 cfu (Y4), survival rates were equal to
99.1 % (Y4-NE2); co-treatment with E2 did reduce survival rates (Y4-LE2, 98.3 %; Y4-HE2, 92.6 %), but only the difference between groups Y4-NE2 and Y4-HE2 was significant (p < 0.05). Treatment with
106 cfu of Y. ruckeri (Y6) markedly reduced survival
rates (p < 0.001) in comparison with 104 cfu and
reached 61.1 % in Y6-NE2. Again, E2 co-treatment led to a further reduction of survival rates, with 53.2 % in Y6-LE2 and 34.8 % in Y6-HE2. The differ-ences of survival rates were highly significant between group Y6-NE2 and group Y6-HE2 (p < 0.001) but not between groups Y6-NE2 and Y6-LE2. Also, comparing groups Y6-LE2 and Y6-HE2 showed highly significant different survival rates (p < 0.001).
T able 1 Primers and probes used for qPCR Gene name Accession EMBL Short name Sequence Amplicon length Ef ficiency , % V itellogenin X92804 Vtg Forward primer TCTGAAGTCAACGCAGTT AAA TGT 90 bp 99.85 Reverse primer AGAGGCA TGTTGA TCTTGT ACTT Probe CA TGGTCAGAGACACA TTGACAACA TTT A Forward primer AGCAGACGACAGTGGGAACAC NF-kappaB inhibitor alpha-1 CA343143 Nfkbia Reverse primer TGGGTGA TCACACTGAAGGAGA T 7 8 b p 98.47 Probe TCTCCACA TCGCCTGT AAGAAGGGCTCT Forward primer A TCTGCCTGAGTGGCTTCA TG Cathepsin D-1 CA347041 Ctsd1 Reverse primer AA TGAA T ACA TCTCCCAGGA TCCA 78 bp 104.60 Probe TGGA T A TCCCCGCCCCCGC Forward primer ACTCACT A T AGTTCTCA TTGTTGTCA TCGT UDP-glucuronosyltransferase 1-8 CA349227 Ugt8 Reverse primer TTCTTCA T AGACCTCTTCGTTCCA 93 bp 107.63 Probe CGTT AAA TGCTGCA T AGTCTGCTTCCGC Probe TTCTGT A TTTCGA TCCAACGCCGCTT AA TC Forward primer TGGCCTCCGACACTGACA Mitogen-activated protein kinase 9-1 CA373029 mapk9 Reverse primer CCTGGTGCGA TCTCA TTGG 77 bp 100.77 Probe AGCAGCA TTGACACACTCACTGGACACCT Forward primer GGACTGTGGT AAAA TGGTCAAACC Saxitoxin and tetrodotoxin binding protein 1 CA374637 psbp1 74 bp 100.94 Reverse primer CGA TGAGAA TCCA TTCACCAAA Probe CCTGCCGACAAGCTCAACACGGT Forward primer GCCCTGGACACCA TCCACT A Phosphotyrosine independent ligand for the Lck SH2 domain p62 CA375694 sqstm1 Reverse primer TCCCTCAGGGT ACGGTGTTG 70 bp 101.41 Probe TCCAAACCCGCCAAGAAGT AACGGG Forward primer GCAGGCTT AGCAA TGACTTGAA T CREB-binding protein CA385588 crebbp Reverse primer TGCT ACAA TCCTTCAACAAACTTCTC 79 bp 97.96 Probe TGGGCGACACCACAGGAGACACACT Forward primer TGTCACGTGAGTGGCTTCCA Beta-2-microglobulin-2 JB1 CX026208 b2m Reverse primer GGA TCTCCACGCCGTTCTT 67 bp 101.67 Probe CCCCCTGACA TCAGCA TCCAGCTC Forward primer GCTGAAACTGTCCACCTCT AAGG Glutathione S-transferase, mitochondrial BX074823 gst Reverse primer GGCCCT A TGGTCCAGTGCTT 76 bp 102.18 Probe AA TCAAAGACAAGCTGAAGAGA TCCACCCA Forward primer GCA T ACACGCACAGCGA T A TTC T ranscription factor jun-B-1 CF752495 junb Reverse primer CGTCGCTGCTCTGCA TGT 72 bp 101.98 Probe TGAAAGAGGAGCCCCAGACCGTTCC
Microarray and qPCR Analysis of Hepatic Gene Expression To assess how differences of survival rates associate with gene expression changes in the liver, analyses were per-formed using microarray and qPCR. We focused on the
106cfu Yersinia treatment groups as treatment-related
differ-ences in survival were greatest at the maximum dose of
bacteria tested in this experiment (Fig. 2). Samples were
collected at 3 days p.i., shortly before the onset of mortality. Therefore, the observed expression changes are considered to be associated with infection and hormonal treatment rather than with the moribund condition of the fish.
At total, 409 genes showed expression differences com-pared to the negative control NE2/no Yersinia. Hierarchical clustering of expression profiles of 409 genes relatively well
separated the experimental groups (Fig. 3). Results
sug-gested a closer relationship between the Y6-NE2 and the Y6-LE2 groups compared to the Y6-HE2 group, which was in line with the survival analysis. The highest number of genes that were differentially regulated was found in the Y6-NE2 group (259 genes), pointing to a strong influence of the pathogen exposure, while in the combined exposure groups 181 genes (Y6-LE2) and 174 genes (Y6-HE2) were
differ-entially regulated (Fig.1). A greater number of genes were
down-regulated, both in the pathogen-only treatment (Y6-NE2) and in the combined treatment (Y6-LE2, Y6-HE2;
Fig.1).
By expression profiles determined with microarray anal-yses, genes were divided in three groups: (a) response to only bacterial infection (no significant difference between Y6-NE2, Y6-LE2, Y6-HE2), (b) induced with combined exposure to estrogen and pathogen (up-regulation in Y6-HE2 or in both E2-exposed groups but not in Y6-NE2), and (c) repressed with combined treatment (reduced expression in Y6-HE2). Examples of genes from these groups are
presented in Tables2,3, and4; results for all differentially
expressed genes are found in the“Electronic Supplementary
Materials”. Expression changes of several genes were
vali-dated with qPCR (Figs. 4 and 5) and the results of two
independent methods were in concordance (Pearson’s r0 0.77, data not shown). It is important to note that all micro-array hybridizations were performed with pathogen-challenged rainbow trout, while qPCR analyses included uninfected fish, thus making finding of the E2-only effects impossible.
A suite of genes involved in immune and stress responses changed expression with no difference between the
treat-ment groups (Table2; Fig.4). Sqstm1 and nfkbia, which are
inhibitor components of the pathway that plays an essential part in signaling downstream from pathogen recognition and cytokine receptors, were significantly up-regulated. A sim-ilar result was produced for junb, a transcription factor
involved in inflammation (Wagner 2010). Co-exposure to
E2 did not alter the bacteria-induced regulation of this gene
(Fig. 4). Hamp and aim2 were also significantly
up-regulated, irrespective of the presence or absence of E2
(Table2). The former combines the properties of a hormone
regulating iron metabolism and antibacterial protein and commonly shows strong pathogen responses in fish (Shi
and Camus 2006), while the latter belongs to a group of
small interferon-inducible transmembrane proteins that are activated with bacterial and viral infections (Siegrist et al.
2011). Further, bacterial infection, but not E2 exposure,
suppressed the expression of genes involved in the metabo-lism of eicosanoids, inflammatory regulators of lipid origin
(alox5r and cyp2k4; Table2). Also, leap2b, a peptide with
predicted antibacterial properties and a sensitive stress marker that decreases expression under various adverse conditions, was significantly down-regulated under Yersinia challenge. The Yersinia infection also caused expression
Fig. 2 Survival time plot in days showing the rate of survival (y-axis) of different estradiol-treated groups after infection at day 0 with different concentrations of Y. ruckeri (x-axis). The asterisks indicate significant difference to the corresponding no E2 treatment group (NE2) of the same Yersi-nia treatment group. Sample size, n0140 fish/treatment group. NE2 no estradiol (E2) treatment, LE2 2 mg E2/kg food, HE2 20 mg E2/kg food
changes of genes involved in protection against reactive oxygen species (gsr, gsp, txn, and txndc4) and endosomal chaperones hspa5 and hsp90b1, markers of endoplasmic
reticulum stress (Malhotra and Kaufman2007). All of these
genes are known to be highly sensitive to pathogens and
stressors in salmonid fish (Skugor et al.2008; Skugor et al.
2009).
Table 3 includes examples of genes that were
up-regulated by E2 exposure as shown by a significant differ-ence of expression ratios between Y6-NE2 on one hand and one or both E2-treated groups on the other hand. Function-ally, these genes are associated with metal ion regulation, lysosome activity, hemostasis, and metabolism. The small metal binding proteins metallothioneins (mta, mtb, and mt1l) are known to be important prognostic markers in
estrogen-dependent cancers (Goulding et al.1995; Bay et
al.2006). The lysosomal protease ctsd1, which is known to
be estrogen-inducible (Rochefort, 1990; Ravdin 1993),
showed response to E2 exposure in qPCR analyses
(Fig.5). Strong up-regulation was seen in tfpi2, an
antico-agulant protein, and similar expression changes were found
in vps52 (Table3). Both genes are known to be induced by
estrogens (Jayachandran et al.2005; Burki et al.2007).
Exposure to E2 reduced the expression of a panel of genes that were either up-regulated in Y6-NE2 or did not
respond to the pathogen (Table 4). This group included
genes associated with metabolism, immune responses, and stress. Two immune genes—b2m, a component of MHC1, and crebbp, a transcriptional coactivator involved in diverse immune and metabolism pathways—showed significant and dose-dependent down-regulation responses under E2 co-exposure, while bacterial infection alone had no effect
(Ta-ble4). However, qPCR found only a trend to E2 suppression
of these genes with no difference between bacteria-infected
and uninfected groups (Fig. 5). Two more immune-related
genes, ambp and hpx, were down-regulated at combined
treatment (Table4). E2 exposure also down-regulated genes
involved in lipid and steroid metabolism (vlacs and akr1d1). Similar changes were found in genes encoding proteins with important roles in the metabolism of endogenous insoluble
substrates and biotransformation of xenobiotics (Table 4;
Fig. 5). Gst, ugt8, and ugt2b15 play an essential part in
phase II by conjugating polar functional groups that enhance the solubility and facilitate the removal of toxins. Ephx1
(Decker et al.2009) and chst4 (Jancova et al.2010), which
are also among the key enzymes of xenobiotics metabolism, were all down-regulated at exposure to combined stressors. Two more genes, sepp1and prdx1, which are responsive to oxidative stress, showed similar changes. Timp3 and a gene with unknown functions denoted as an acute phase protein, a marker of chemical stress characterized by high sensitivity
to diverse contaminants in salmonid fish (Burki et al.2007),
were up-regulated by bacterial infection and suppressed with E2 treatment. Finally, the gene psb1, which showed the greatest response to E2 exposure in both microarray and
qPCR analyses (Table4; Fig.5), is a homolog of the puffer
fish saxitoxin and tetrodotoxin-binding protein character-ized by high affinity to several toxic compounds
(Yotsu-Yamashita et al.2001).
Discussion
This study investigated the combined effects of estrogen (E2) treatment and pathogen infection on disease suscepti-bility and hepatic transcriptome of rainbow trout. The native
Fig. 3 Hierarchical clustering of samples analyzed with microarray (log2-ER of 409
differentially expressed genes, Pearson r, Ward’s method). NE2 no E2 exposure, LE2 low (2 mg/kg) E2 exposure, HE2 high (20 mg/kg) exposure
form of the female sex hormone was chosen due to its relevance for both aquaculture and environmental research. Endogenous production of E2 increases during puberty and sexual maturation of fish. Furthermore, this hormone serves as a model for assessing the effects of environmental estrogen-active contaminants. Efficiency of the E2 treatment in this study was assessed by measuring hepatic vtg tran-scription, and the results showed a significant, dose-dependent up-regulation of the E2 target gene. In a previous
study (Wenger et al.2011), we had shown that the
circulat-ing E2 levels resultcirculat-ing from feedcirculat-ing high E2 diets, as used in the current study, remained within the physiological range. As a pathogen, the bacterium Y. ruckeri, the etiological agent of the redmouth disease, was included in the study because of its economical and environmental importance.
Outbreaks of enteric redmouth disease usually lead to hem-orrhages in various organs and can cause high mortalities in aquaculture and in wild fish populations (Horne and Barnes
1999; Tobback et al.2007). The availability of information
on immunological response makes this bacterium an appro-priate model to investigate host–pathogen interactions
(MacDonald et al.2007). The efficiency of Y. ruckeri
infec-tion in this study was assessed by re-isolating and genotyp-ing the pathogen from moribund fish.
Survival rate of rainbow trout infected with Y. ruckeri was reduced by concomitant exposure to E2 in a dose-dependent manner. An interaction between Yersinia infec-tion and E2 exposure had been evident already in a previous
study (Wenger et al. 2011). However, in the present study
that used a dose-dependent multi-factorial experimental
Table 2 Examples of genes with responses to Y. ruckeri infection that were not affected with E2 (microarray results) (difference from unin-fected control, no differences between the study groups). Data are log2
-ER±SE. Asterisks mark genes that were analyzed with qPCR. Genes were assigned to functional categories by annotations in databases and information from publications
Genbank Probe Y6-NE2 Y6-LE2 Y6-HE2
Immune
CA362766 Interferon inducible protein (aim2) 1.72 ± 0.45 1.11 ± 0.38 1.69 ± 0.39 CA375694 Phosphotyrosine independent ligand for the Lck SH2 domain p62 (sqstm1) * 1.69 ± 0.51 1.13 ± 0.54 1.85 ± 0.66 CA343143 NF-kappaB inhibitor alpha-1 (nfkbia)* 1.31 ± 0.58 0.72 ± 0.55 1.37 ± 0.64 CA348284 CCAAT/enhancer binding protein beta (cebpb) 1.43 ± 0.39 0.70 ± 0.51 1.26 ± 0.47 CA353501 C type lectin receptor B (clec1b) 1.57 ± 0.46 1.77 ± 0.68 1.88 ± 0.41 BI468191 Hepcidin 1 (hamp) 1.26 ± 0.51 1.38 ± 0.69 1.39 ± 0.51 CA345780 Lysozyme g-2 (lyg2) −0.20 ± 0.49 −0.72 ± 0.11 −0.88 ± 0.32 CA362179 Interleukin-1 receptor-like protein 2 (il1rl2) −0.65 ± 0.03 −0.76 ± 0.14 −0.42 ± 0.07 CA376350 Serum amyloid P-component-1 (apcs) −1.07 ± 0.06 −0.89 ± 0.40 −1.28 ± 0.51 CA377504 Cold autoinflammatory syndrome 1 protein (nalp3) −0.99 ± 0.11 −0.82 ± 0.10 −0.82 ± 0.10 CA387966 Liver-expressed antimicrobial peptide 2B (leap2b) −1.52 ± 0.12 −2.77 ± 0.56 −3.36 ± 0.45 CA349943 C-type mannose-binding lectin (mbl-1) −0.81 ± 0.37 −0.48 ± 0.47 −0.65 ± 0.64 Signal transduction
CA343700 CXC chemokine receptor transcript variant B (cxcr) −0.10 ± 0.16 −0.80 ± 0.26 −0.66 ± 0.27 CA372428 Leukotriene B4 receptor 1 (ltb4r) −0.53 ± 0.12 −0.76 ± 0.17 −0.51 ± 0.21 Stress
CA352456 Glutathione reductase, mitochondrial-2 (gsr) 0.75 ± 0.16 0.73 ± 0.06 0.48 ± 0.16 CF753103 Glutathione peroxidase-gastrointestinal (gsp) 0.65 ± 0.23 0.70 ± 0.39 0.72 ± 0.27 CA354578 Thioredoxin domain containing protein 4 (txndc4) 0.84 ± 0.37 1.12 ± 0.14 0.69 ±0.38 CX153146 Thioredoxin (txn) 1.32 ± 0.35 0.96 ± 0.41 0.32 ± 0.22 CA362998 DnaJ homolog, subfamily C, member 3 (dnajc3) 1.04 ± 0.52 1.28 ± 0.73 1.28 ± 0.59 CA368961 78-kDa glucose-regulated protein (hspa5) 2.33 ± 0.80 2.23 ± 1.07 0.78 ± 0.83 CA369202 Growth arrest and DNA-damage-inducible GADD45 beta (gadd45b) 0.72 ± 0.26 0.48 ± 0.37 0.82 ± 0.46 CA381199 94-kDa glucose-regulated protein (hsp90b1) 0.56 ± 0.36 0.67 ± 0.35 1.01 ± 0.43 CA368739 BCL2-associated athanogene 1 −1.02 ± 0.10 −0.83 ± 0.14 −0.79 ± 0.18 Various
CF752495 Transcription factor junB * (junb) 1.38 ± 0.45 0.77 ± 0.46 1.45 ± 0.42 EV384586 Cytochrome P450 2 K4-2 (cyp2k4) −0.71 ± 0.17 −0.49 ± 0.11 −0.79 ± 0.16 CA387866 Arachidonate 5-lipoxygenase-2 (alox5) −0.68 ± 0.20 −0.95 ± 0.28 −0.19 ± 0.09
design, the results clearly demonstrated the dose–response relationship of this interaction. With respect to E2, an inter-active effect with pathogen infection was observed for the high E2 dose. With respect to the bacterial pathogen, the high E2 dose tended to increase pathogen-induced mortality
at 104 cfu and significantly enhanced mortality at a high
pathogen load (106 cfu). At a bacterial concentration of
102cfu, which alone did not cause mortality, the combined
E2 pathogen treatment also remained without effect on survival.
To gain insight into processes underlying the interaction between the two stressors addressed in this study, we per-formed microarray analyses of the hepatic transcriptome. The focus was laid on the interaction of E2 with the highest
Table 4 Examples of genes down-regulated by combined exposure to E2 and Y. ruckeri (microarray results) (differences between the E2 exposed study groups are denoted with superscript letters (a, b)). Data are log2-ER±SE. Asterisks mark genes that were analyzed with qPCR
Genbank Gene Y6-NE2 Y6-LE2 Y6-HE2
Xenobiotic metabolism
CA371001 Very-long-chain acyl-CoA synthetases (vlacs) −0.09 a ± 0.19 −0.91 a, b ± 0.38 −1.73 b ± 0.29 CA377953 3-oxo-5-beta-steroid 4-dehydrogenase (akr1d1) −0.22 a ± 0.15 −0.88 a, b ± 0.49 −0.84 b ± 0.16 CA378723 Sulfotransferase 4 (chst4) 1.04 a ± 0.15 0.49 a, b ± 0.33 −0.26 b ± 0.12 CA358621 Microsomal glutathione S-transferase 3 (mgst3) * 1.06 ± 0.19 0.34 a, b ± 0.28 −0.01 b ± 0.19 CA349227 UDP-glucuronosyltransferase 1-8 (UGT8) * 0.12 a ± 0.37 −0.70 a, b ± 0.29 −0.84 b ± 0.14 CA376450 Epoxide hydrolase 1 (EPHX1) 0.21 a ± 0.06 −0.52 a, b ± 0.37 −0.84 b ± 0.16 BX074823 Glutathione S-transferase, mitochondrial (GST) * 0.68 a ± 0.13 −0.23 b ± 0.34 −0.65 b ± 0.17 CA342060 UDP-glucuronosyltransferase 2B15 (ugt2b15) 0.23 a ± 0.12 −0.46 b ± 0.17 −0.93 b ± 0.31 Immune
CX026208 Beta-2-microglobulin (b2m) * 0.03 a ± 0.09 −0.66 b ± 0.18 −1.15 b ± 0.31 EG920678 Alpha-1-microglobulin/bikunin-2 (ambp) 0.02 a ± 0.09 −0.41 b ± 0.11 −0.73 b ± 0.12 Metabolism, immune
CA363230 Hemopexin (hpx) 0.13 a ± 0.20 0.32 a ± 0.18 −0.86 b ± 0.23 CA385588 CREB-binding protein (crebbp) * 0.49 a ± 0.12 −0.15 b ± 0.21 −0.66 b ± 0.37 Stress
CA373506 Selenoprotein P (sepp1) 0.02 a ± 0.05 −0.57 a, b ± 0.44 −0.91 b ± 0.24 BX085117 Peroxiredoxin 1-2 (prdx1) 0.36 a ± 0.08 0.03 a ± 0.23 −0.75 b ± 0.08 CX141783 Acute phase protein 1.14 a ± 0.51 0.31 a ± 0.69 −1.88 b ± 0.24 CA371538 Metalloproteinase inhibitor 3 (timp3) 0.60 a ± 0.28 −0.45 b ± 0.28 −1.02 b ± 0.16 Various
CA388340 Beta-2-glycoprotein I (b2gp1) −0.10 a ± 0.13 −0.01 a ± 0.21 −0.79 b ± 0.17 CA374637 Saxitoxin and tetrodotoxin binding protein 1 * (psbp1) 0.31 a ± 0.30 −0.44 a ± 0.21 −2.02 b ± 0.34 Table 3 Examples of genes induced by E2 at combined exposure (no difference from uninfected control; differences between the study groups are denoted with lowercase letters (a, b, c)). Data are log2-ER±SE. Asterisks mark genes that were analyzed with qPCR
Genbank Probe Y6-NE2 Y6-LE2 Y6-HE2
Lysosome
CA347041 Cathepsin D-1 * (ctsd1) −0.18 a ± 0.24 −0.11 a ± 0.25 1.77 b ± 0.25 CA365458 Cathepsin D-2 (ctsd2) −0.08 a ± 0.20 0.11 a ± 0.23 1.69 b ± 0.18 Metal ion regulation
CF752699 Metallothionein A (mta) 0.01 a ± 0.22 0.49 a ± 0.21 1.13 b ± 0.26 CA359170 Metallothionein B (mtb) −0.15 a ± 0.24 0.01 a ± 0.23 1.21 b ± 0.22 CB507951 Metallothionein-IL (mt1l) 0.38 a ± 0.30 0.64 a ± 0.34 1.86 b ± 0.40 Hemostasis
EL553001 Tissue factor pathway inhibitor 2 precursor (tfpi2) 0.37 a ± 0.25 1.14 a ± 0.41 4.77 b ± 0.11 Metabolism
dose of bacteria as this treatment evoked the most prominent effects at the level of fish mortality. The clustering of experimental groups on the basis of gene expression shows that an interactive effect between bacterial infec-tion and E2 appears at the Y6-HE2 treatment as it was separated from the other treatment groups. This finding was in agreement with the survival data.
In a previous study (Wenger et al.2011), we investigated
hepatic complement gene expression in rainbow trout ex-posed to E2 and Y. ruckeri and observed that E2-treated fish were not able to up-regulate complement gene expression in response to bacterial challenge—a finding that was in line with the supposed immunosuppressive effect of estrogens in
fish (Milla et al. 2011). The present miocroarray study,
however, shows that a variety of immune genes can still
be up-regulated in the presence of E2 (Table2). This finding
indicates that, in E2-exposed fish, the immunosuppressive activities of estrogens were not the only cause for reduced survival. A similar conclusion was obtained in the study with Atlantic salmon (Salmo salar L.) challenged with
Aeromonas salmonicida (Skugor et al. 2009). Microarray
analyses in the liver of individuals with high and low resis-tance found minor differences in the expression of immune genes. Highly resistant salmon was characterized with a greater expression of genes involved in tissue protection and metabolism of xenobiotics. The results suggested that, in this case, it is the ability to avoid tissue damage arising from the inflammatory response to the bacterial infection rather than the up-regulation of specific immune genes that may be of importance for the pathogen resistance of the
Fig. 5 E2-responsive genes (qPCR). Results are presented as Log2-ER
±SE (n08) compared to negative control group (no E2, no Yersinia exposure) and normalized against reference gene 18 S rRNA. For
names of genes, see Table 1. NE2 no estradiol (E2) treatment, LE2 2 mg E2/kg food, HE2 20 mg E2/kg food. Different letters (a, b) indicate a significant difference (p<0.05)
Fig. 4 Pathogen-induced genes (qPCR). Results are presented as log2-ER±SE (n08)
com-pared to negative control group (no E2, no Yersinia exposure) and normalized against refer-ence gene 18 S rRNA. For names of genes, see Table1. NE2 no estradiol (E2) treat-ment, LE2 2 mg E2/kg food, HE2 20 mg E2/kg food. Differ-ent letters (a, b) indicate a sig-nificant difference (p<0.05)
host. It is possible, however, that the immunosuppressive activities of estrogens are manifested in other organs in-volved in innate immune responses to bacteria. We also need to note that the current study was implemented with juvenile rainbow trout and immune responses could be
different at other life stages. Recently, Chettri et al. (2012)
reported significant differences in mortality and immune-related gene expression between rainbow trout larvae and fry.
One group of genes that responded prominently to the combined Yersinia/E2 exposure (in particular, in the HE2 group) contained genes with a dual role in the metabolism of both lipophilic xenobiotics and lipophilic endogenous
com-pounds (Table4) (Monostory and Dvorak 2011). The
ex-pression of these genes can be up-regulated by their endogenous and exogenous substrates, but at the same time they are under complex control by hormonal and immune
factors (Vrzal et al. 2004; Xie and Tian 2006). Estrogens
influence xenobiotic metabolism and biotransformation
pathways in mammals and fish (Vodicnik and Lech 1983;
Arukwe and Goksøyr1997; Navas and Segner2001;
Vac-caro et al.2005; Carrera et al.2007; Monostory and Dvorak
2011). Likewise, immune mediators such as cytokines or
nitric oxide are also able to regulate the expression and
activity of biotransformation proteins (Aitken et al. 2008;
Lee et al. 2009). Under conditions of bacterial infection,
these genes can play a role in tissue protection and clearance by metabolizing toxic products released from the bacteria or from cell damage in the host. Interestingly, Skugor et al.
(2009) observed that Atlantic salmon with high resistance
against A. salmonicida infection showed elevated expres-sion of biotransformation genes such ugt8, ephx1, and gst— pointing to their possible function in tissue protection and toxic metabolite clearance. In the present study, the expres-sion of these genes was down-regulated by the combined E2/pathogen treatment. Likewise, b2gp1—a precursor of antibacterial peptides—and psbp1—a toxin-binding protein —were up-regulated in A. salmonicida-resistant Atlantic salmon, whereas they were down-regulated in rainbow trout exposed to both E2 and Y. ruckeri. These findings suggest that the interaction of the estrogenic and pathogen exposure compromised the capacity of infected rainbow trout to clear toxic products and metabolites and to protect tissues from the damaging impact of such compounds. Also here, as discussed earlier with respect to the immune processes, linear relationships of the molecular effect to the compro-mised defense capacity of the organism are unlikely, but it is probably more the interplay of an array of protective pro-cesses that eventually translates into an organism-level consequence.
In conclusion, the results of the current study clearly demonstrate that a combination of pathogen- and chemical-induced disturbance leads to a significantly higher
mortality in juvenile rainbow trout and that this happens in a dose-dependent manner. The results of the study further
provide evidence that the organism’s attempt to adapt to
different stressor impacts involves a complex interplay of multiple pathways. Microarray analyses provide a sound possibility to develop a better understanding of the individ-ual pathways and processes in driving the organism’s stress response under multiple-stressor exposure.
Acknowledgments We kindly thank the Pisciculture de la Gruyère, Neirivue, Switzerland, for providing the juvenile rainbow trout used for this study. We also wish to thank the Turku Centre of Biotechnol-ogy (Finland) for the preparation of microarrays. Additionally, we thank Dr. Markus Doherr for his valuable help on statistical matters. This study was supported by the European Commission through the project MODELKEY (contract no. 511237-GOCE) and through the Swiss National Fond SNF project“Mitogenic and growth-promoting hormones: do they regulate development, growth and function of immune genes in fish”.
References
Aitken AE, Lee CM, Morgan ET (2008) Roles of nitric oxide in inflammatory downregulation of human cytochromes P450. Free Radic Biol Med 44:1161–1168
Arukwe A, Goksøyr A (1997) Changes in three hepatic cytochrome P450 subfamilies during a reproductive cycle in turbot (Scoph-thalmus maximus L.). J Exp Zool 277:313–325
Barber I, Arnott SA, Braithwaiet VA, Andrew J, Huntingford FA (2011) Indirect fitness consequence of mate choice in stickle-backs: offspring of brighter males grow slowly but resist parasitic infections. Proc R Soc Lond B 268:71–76
Bay BH, Jin R, Huang J, Tan PH (2006) Metallothionein as a prog-nostic biomarker in breast cancer. Exp Biol Med (Maywood) 231:1516–1521
Burki R, Bettge K, Antikainen M, Krasnov A, Wahli T, Segner H (2007) Array analysis reveals hepatic immune genes as site of interaction between estrogenic and pathogenic stressors in rain-bow trout. Toxicol Lett 172:S158–S158
Cabas I, Liarte S, Alcázar A, Meseguer J, Mulero V, García-Ayala A (2012) 17α-Ethynylestradiol alters the immune response of the teleost gilthead seabream (Sparus aurata L.) both in vivo and in vitro. Dev Comp Immunol 36:547–556
Carrera EP, García-López A, Martín Del Río MEP, Martínez-Rodríguez G, Solé M, Mancera JM (2007) Effects of 17beta-estradiol and 4-nonylphenol on osmoregulation and hepatic enzymes in gilthead sea bream (Sparus auratus). Comp Biochem Physiol C Toxicol Phar-macol 145:210–217
Casanova-Nakayama A, Wenger M, Burki R, Eppler E, Krasnov A, Segner H (2011) Endocrine disrupting compounds: can they tar-get the immune system of fish? Mar Pollut Bull 63:412–416 Chettri JK, Raida MK, Kania PW, Buchmann K (2012) Differential
immune response of rainbow trout (Oncorhynchus mykiss) at early developmental stages (larvae and fry) against the bacterial pathogen Yersinia ruckeri. Dev Comp Immunol 36:463–474 Crain C, Kroeker K, Halpern B (2008) Interactive and cumulative
effects of multiple human stressors in marine systems. Ecol Lett 11:1304–1315
Decker M, Arand M, Cronin A (2009) Mammalian epoxide hydrolases in xenobiotic metabolism and signalling. Arch Toxicol 83:297– 318
Fenske M, Maack G, Schäfers C, Segner H (2005) An environmentally relevant concentration of ethinylestradiol induces arrest of male gonad development in zebrafish, Danio rerio. Environ Toxicol Chem 24:1088–1098
French SS, Moore MC, Demas GE (2009) Ecological immunology: the organism in context. Integr Comp Biol 49:246–253
Goulding H, Jasani B, Pereira H, Reid A, Galea M, Bell JA, Elston CW, Robertson JF, Blamey RW, Nicholson RA, Schmid KW, Ellis I (1995) Metallothionein expression in human breast cancer. Br J Cancer 72:968–972
Guerrero RD (1975) Use of androgens for production of all-male Tilapia aurea (Steindachner). Trans Am Fish Soc 104:342–348 Hinton DE, Segner H, Au DWT, Kullman SW, Hardman RC (2008)
Liver toxicity. In: Di Giulio RT, Hinton DE (eds) The toxicology of fishes. Taylor and Francis, Boca Raton, pp 327–400
Horne, M. and Barnes, A. (1999) Enteric redmouth disease (Y. ruckeri). In: Woo, P.T.K. and Bruno, D.W. (eds) Fish diseases and disor-ders, vol 3. Viral, bacterial, and fungal infections. Oxfordshire: CABI, pp 455-477.
Jancova P, Anzenbacher P, Anzenbacherova E (2010) Phase II drug metabolizing enzymes. Biomed Pap Med Fac Univ Palacky Olo-mouc Czech Repub 154:103–116
Jayachandran M, Sanzo A, Owen WG, Miller VM (2005) Estro-genic regulation of tissue factor and tissue factor pathway inhibitor in platelets. Am J Physiol Heart Circ Physiol 289: H1908–H1916
Jin Y, Chen R, Liu W, Fu Z (2010) Effect of endocrine disrupting chemicals on the transcription of genes related to the innate immune system in the early developmental stage of zebrafish (Danio rerio). Fish Shellfish Immunol 28:854–861
Jobling S, Nolan M, Tyler CR, Brighty G, Sumpter JP (1998) Wide-spread sexual disruption in wild fish. Environ Sci Technol 32:2498–2506
Jorgensen S, Afanasyev S, Krasnov A (2008) Gene expression analy-ses in Atlantic salmon challenged with infectious salmon anemia virus reveal differences between individuals with early, interme-diate and late mortality. BMC Genomics 9:179
Kiesecker J (2002) Synergism between trematode infection and pesti-cide exposure: a link to amphibian limb deformities in nature? Proc Natl Acad Sci U S A 99:9900–9904
Koskinen H, Pehkonen P, Vehniäinen E, Krasnov A, Rexroad C, Afanasyev S, Mölsa H, Oikari A (2004) Response of rainbow trout transcriptome to model chemical contaminants. Biochem Biophys Res Commun 320:745–753
Krasnov A, Koskinen H, Pehkonen P, Rexroad CE, Afanasyev S, Mölsä H (2005) Gene expression in the brain and kidney of rainbow trout in response to handling stress. BMC Genomics 6:3 Kuhnert P, Frey J, Lang N, Mayfield L (2002) Phylogenetic analysis of Prevotella nigrescens, Prevotella intermedia and Porphyromonas gingivalis clinical strains reveals a clear species clustering. Int J Syst Evol Microbiol 52:1391–1395
Lee CM, Pohl J, Morgan ET (2009) Dual mechanisms of CYP3A protein regulation by proinflammatory cytokine stimulation in primary hepatocyte cultures. Drug Metab Dispos 37:865–872 Liarte S, Chaves-Pozo E, Abellán E, Meseguer J, Mulero V,
García-Ayala A (2011) 17β-Estradiol regulates gilthead seabream pro-fessional phagocyte responses through macrophage activation. Dev Comp Immunol 35:19–27
MacDonald E, Savoy A, Gillgrass A, Fernandez S, Smieja M, Rosenthal K, Ashkar A, Kaushic C (2007) Susceptibility of human female primary genital epithelial cells to herpes simplex virus, type-2 and the effect of TLR3 ligand and sex hormones on infection. Biol Reprod 77:1049–1059
Malhotra JD, Kaufman RJ (2007) The endoplasmic reticulum and the unfolded protein response. Semin Cell Dev Biol 18:716– 731
Milla S, Depiereux S, Kestemont P (2011) The effects of estrogenic and androgenic endocrine disruptors on the immune system of fish: a review. Ecotoxicology 20:305–319
Monostory K, Dvorak Z (2011) Steroid regulation of drug-metabolizing cytochromes P450. Curr Drug Metab 12:154–172 Navas JM, Segner H (2001) Estrogen-mediated suppression of
cyto-chrome P4501A (CYP1A) expression in rainbow trout hepato-cytes: role of estrogen receptor. Chem Biol Interact 138:285–298 Pfaffl MW, Horgan GW, Dempfle L (2002) Relative expression soft-ware tool (REST) for group-wise comparison and statistical anal-ysis of relative expression results in real-time PCR. Nucleic Acids Res 30:e36
Ravdin PM (1993) Evaluation of cathepsin D as a prognostic factor in breast cancer. Breast Cancer Res Treat 24:219–226
Rice CD (2001) Fish immunotoxicology: understanding mechanisms of action. In: Schlenk D, Benson WH (eds) Target organ toxicity in marine and freshwater teleosts, 1st edn. Taylor and Francis, London, pp 127–140
Rochefort H (1990) Biological and clinical significance of cathepsin D in breast cancer. Semin Cancer Biol 1:153–160
Sexton K, Hattis D (2007) Assessing cumulative health risks from exposure to environmental mixtures—three fundamental ques-tions. Environ Health Perspect 115:825–832
Shi J, Camus AC (2006) Hepcidins in amphibians and fishes: antimi-crobial peptides or iron-regulatory hormones? Dev Comp Immu-nol 30:746–755
Shved N, Berishvili G, Hausermann E, D'cotta H, Baroiller JF, Eppler E (2009) Challenge with 17 alpha-ethinylestradiol (EE2) during early development persistently impairs growth, differentiation, and local expression of IGF-I and IGF-II in immune organs of tilapia. Fish and Shellfish Immunology 26:524–530
Siegrist F, Ebeling M, Certa U (2011) The small interferon-induced transmembrane genes and proteins. J Interferon Cytokine Res 31:183–197
Skugor S, Glover KA, Nilsen F, Krasnov A (2008) Local and systemic gene expression responses of Atlantic salmon (Salmo salar L.) to infection with the salmon louse (Lepeophtheirus salmonis). BMC Genomics 9:498
Skugor S, Jørgensen SM, Gjerde B, Krasnov A (2009) Hepatic gene expression profiling reveals protective responses in Atlantic salm-on vaccinated against furunculosis. BMC Genomics 10:503 Straub R (2007) The complex role of estrogens in inflammation.
Endocr Rev 28:521–574
Sumpter JP, Johnson AJ (2005) Lessons from endocrine disruption and their application to other issues concerning trace organics in the aquatic environment. Environ Sci Technol 39:4321–4332 Thilagam H, Gopalakrishnan S, Bo J, Wang KJ (2009) Effect of
17beta-estradiol on the immunocompetence of Japanese sea bass (Lateolabrax japonicus). Environ Toxicol Chem 28:1722–1731
Tilton SC, Givan SA, Pereira CB, Bailey GS, Williams DE (2006) Toxicogenomic profiling of the hepatic tumor promoters indole-3-carbinol, 17β-estradiol, and β-naphthoflavone in rainbow trout. Toxicol Sci 90:61–72
Tobback E, Decostere A, Hermans K, Haesebrouck F, Chiers K (2007) Yersinia ruckeri infections in salmonid fish. J Fish Dis 30:257– 268
Vaccaro E, Meucci V, Intorre L, Soldani G, Di Bello D, Longo V, Gervasi PG, Pretti C (2005) Effects of 17beta-estradiol, 4-nonylphenol and PCB 126 on the estrogenic activity and phase 1 and 2 biotransformation enzymes in male sea bass (Dicen-trarchus labrax). Aquat Toxicol 75:293–305
Vodicnik MJ, Lech JJ (1983) The effect of sex steroids and pregnenolone-16 alpha-carbonitrile on the hepatic microsomal monooxygenase system of rainbow trout (Salmo gairdneri). J Steroid Biochem 18:323–328
Vrzal R, Ulrichová J, Dvorák Z (2004) Aromatic hydrocarbon receptor status in the metabolism of xenobiotics under normal and patho-physiological conditions. Biomed Pap Med Fac Univ Palacky Olomouc Czech Repub 148:3–10
Wagner EF (2010) Bone development and inflammatory disease is reg-ulated by AP-1 (Fos/Jun). Ann Rheum Dis 69(Suppl 1):i86–i88 Watanuki H, Yamaguchi T, Sakai M (2002) Suppression in function of
phagocytic cells in common carp, Cyprinus carpio L., injected with estradiol, progesterone, or 11-ketotestosterone. Comp Bio-chem Physiol 132C:407–413
Wenger M, Sattler U, Goldschmidt-Clermont E, Segner H (2011) 17Beta-estradiol affects the response of complement components
and survival of rainbow trout (Oncorhynchus mykiss) chal-lenged by bacterial infection. Fish and Shellfish Immunology 31:90–97
Xie W, Tian Y (2006) Xenobiotic receptor meets NF-kappaB, a colli-sion in the small bowel. Cell Metab 4:177–178
Yada T, Nakanishi T (2002) Interaction between endocrine and im-mune systems in fish. Internat Rev Cytol 220:35–92
Yotsu-Yamashita M, Sugimoto A, Terakawa T, Shoji Y, Miyazawa T, Yasumoto T (2001) Purification, characterization, and cDNA cloning of a novel soluble saxitoxin and tetrodotoxin binding protein from plasma of the puffer fish, Fugu pardalis. Eur J Biochem 268:5937–5946