HAL Id: hal-00677820
https://hal.archives-ouvertes.fr/hal-00677820
Submitted on 9 Mar 2012
HAL is a multi-disciplinary open access
archive for the deposit and dissemination of
sci-entific research documents, whether they are
pub-lished or not. The documents may come from
teaching and research institutions in France or
abroad, or from public or private research centers.
L’archive ouverte pluridisciplinaire HAL, est
destinée au dépôt et à la diffusion de documents
scientifiques de niveau recherche, publiés ou non,
émanant des établissements d’enseignement et de
recherche français ou étrangers, des laboratoires
publics ou privés.
Workflow-based comparison of two Distributed
Computing Infrastructures
Johan Montagnat, Tristan Glatard, Damien Reimert, Ketan Maheshwari,
Eddy Caron, Frédéric Desprez
To cite this version:
Johan Montagnat, Tristan Glatard, Damien Reimert, Ketan Maheshwari, Eddy Caron, et al..
Workflow-based comparison of two Distributed Computing Infrastructures. Workshop on Workflows
in Support of Large-Scale Science (WORKS 2010), Nov 2010, New Orleans, United States. pp.1-10,
�10.1109/WORKS.2010.5671856�. �hal-00677820�
Workflow-based comparison of two
Distributed Computing Infrastructures
Johan Montagnat
CNRS, Univ. of Nice I3S laboratory [email protected]
Tristan Glatard
CNRS, INSERM, Univ. of Lyon CREATIS laboratory [email protected]
Damien Reimert
INRIA ENS Lyon, LIP
Ketan Maheshwari
University of Nice CNRS, I3S laboratory[email protected]
Eddy Caron
INRIA ENS Lyon, LIP [email protected]Frédéric Desprez
INRIA ENS Lyon, LIP [email protected]
ABSTRACT
Porting applications to Distributed Computing Infrastruc-tures (DCIs) is eased by the use of workflow abstractions. Yet, estimating the impact of the execution DCI on applica-tion performance is difficult due to the heterogeneity of the resources available, middleware and operation models. This paper describes a workflow-based experimental method to acquire objective performance comparison criterions when dealing with completely different DCIs. Experiments were conducted on the European EGI and the French Grid’5000 infrastructures to highlight raw performance variations and identify their causes. The results obtained also show that it is possible to conduct experiments on a production infras-tructure with similar reproducibility as on an experimental platform.
Categories and Subject Descriptors
C.4 [Computer Systems Organization]: Performance of Systems
General Terms
Workflows, Distributed Computing Infrastructures, Perfor-mance
1.
PROBLEM STATEMENT AND METHOD
With the maturing of technologies such as grids, large scale Distributed Computing Infrastructures (DCIs) are be-ing increasbe-ingly used for addressbe-ing various scientific com-puting needs. Such DCIs deliver High Throughput Comput-ing capabilities and can efficiently exploit coarse-grain par-allelism that is available in modular applications. With the emergence of many different general-purpose DCIs
world-Permission to make digital or hard copies of all or part of this work for personal or classroom use is granted without fee provided that copies are not made or distributed for profit or commercial advantage and that copies bear this notice and the full citation on the first page. To copy otherwise, to republish, to post on servers or to redistribute to lists, requires prior specific permission and/or a fee.
WORKS’10, November 14, 2010, New Orleans, USA. Copyright 2010 ACM X-XXXXX-XX-X/XX/XX ...$10.00.
wide, among which the European EGI1
and the US OSG2
, scientists are interested in porting their applications to dif-ferent resources to improve performance. As an abstraction for describing distributed applications, workflows ease the porting of applications on different DCIs. However, applica-tion performance is highly dependent on the DCI capacities, the middleware installed, its access policies and the resources available. Furthermore, different DCIs may exhibit very dif-ferent operation models whose impact on applications per-formance is difficult to anticipate. As a consequence, making an objective comparison between different DCIs is a difficult problem that requires significant investment and experimen-tal methodology.
Dedicated tools have been developed to model and make predictions on distributed tasks execution time (e.g. Perfor-mance Analysis and Characterisation Environment – PACE
[9,10]) and network traffic (e.g. Network Weather Service
– NWS [13, 14]) that are used for decision making within
middleware. However these approaches are difficult to ex-ploit in the case of large scale distributed infrastructures due to the complex interaction of multiple computing and net-working resources and the external, uncontrollable workload resulting of other system users activity. Some probabilistic models attempt to model the overall DCI operational
be-havior [5,3,6]. These approaches have not been extended
to tackle performance assessment issues though, especially in the context of multiple DCIs joint modeling.
The method adopted in this paper is based on experi-mental measurements instead, through execution of a same workflow-based application on the two DCIs to compare. It exploits the Gwendia data-intensive grid workflow lan-guage designed to cover a broad class of distributed
scien-tific applications [7], as well as two enactors supporting this
language but implementing interfaces to different execution
DCIs. MOTEUR3
is a Gwendia language interpreter in-terfaced to the EGI infrastructure’s gLite middleware, while
DIET MA DAG4
is transforming Gwendia workflows into Directed Acyclic Graphs and using specialized schedulers from the DIET middleware to submit computation tasks to
1
European Grid Initiative,http://www.egi.eu
2
Open Science Grid,http://www.opensciencegrid.org
3
http://modalis.polytech.unice.fr/softwares/moteur
4
the Grid’5000 French research infrastructure. To acquire objective information on the DCIs, various time measure-ments are performed during workflow execution, that cover the CPUs performance, data transfer, and middleware over-head:
• Application makespan: the execution completion time,
as experienced by the user.
• Processes execution time: the average execution time
of all tasks executed within the workflow.
• Data transfer time: the average input/output data
transfer time of all tasks executed within the work-flow.
• Processes idle time: the average idle time (including
all delays such as scheduling decision time, queuing time, etc) experienced by all tasks executed within the workflow.
This case study is based on EGI (formerly known as EGEE) and Grid’5000, two DCIs that have been developed to fulfill different purposes and operating completely different mid-dleware. Grid’5000 intends to be an instrument for research in computer-science (a “grid telescope”) while EGI is meant to be a production platform for e-Science. These two DCIs exhibit different capacities and deliver variable quality of service. Furthermore, DCIs are by nature shared infrastruc-tures which undergo variable and uncontrollable workload conditions depending on the concurrent usage of the same infrastructure by different users. An infrastructure should therefore be evaluated on the functionality it provides to its users as well as performance. No acknowledged model, benchmark or simulator exists for production grids although
some efforts attempted to describe part of them [1,4]. It is
therefore necessary that the performance comparison study is based on an extensive set of experiments. Setting up comparable experimental conditions between the two target platforms is a non-trivial issue. Still, performance measure-ments should be interpreted with flexibility, given that they are subject to unpredictable concurrent activities causing variations. In particular, averaging the results produced by multiple experiment runs lowers the variations observed.
In the reminder, the two target infrastructures are detailed
and compared qualitatively in Section 2. The
workflow-based experimental framework for achieving objective per-formance comparison on large-scale DCIs is then introduced
in Section3and comparison results between EGI and Grid’5000
are reported in Section4. The impact of the methodological
framework used for the experiments is discussed in Section5.
2.
OVERVIEW OF THE TWO CONSIDERED
DCIS
Both the EGI and the Grid’5000 grid infrastructures are large-scale DCIs consisting of a federation of computing cen-ters interconnected through a high-bandwidth network. How-ever, there are very little common features between these infrastructures as detailed below. Their operation models and objectives differ significantly.
2.1
EGI production grid
EGI (formerly known as EGEE) is a pan-European production-quality grid infrastructure deployed for addressing the needs
of multiple scientific communities. Operated as a produc-tion service for e-Science, there is a 24/7 maintenance of the infrastructure. The infrastructure experiences a per-manent and variable workload resulting from the compet-itive usage of the resources available by a very large user community (more than 10,000 users are registered). The middleware installed is a stable release (gLite middleware) deployed on quite homogeneous operating systems (mostly Scientific Linux and CentOS 4 or 5, i.e. free versions of the RedHat Enterprise Linux). It has a very large scale: cur-rently 250 computing centers delivering more than 160,000 CPU cores and tens of PB of storage space mutualize their resources. The clusters are managed by heterogeneous batch schedulers (PBS, LSF, etc) and the gLite middleware pro-vides some glueing capability including a shared security infrastructure, a Workload Management System on top of the local resource managers, and a file catalog to produce a virtual grid-wide file hierarchy.
2.2
Grid’5000 research grid
Grid’5000 is an experimental grid infrastructure dedicated to research in computer science on large-scale distributed systems. It is composed of 9 sites interconnecting hetero-geneous clusters through a dedicated high-performance net-work. More than 5000 CPU cores are available. Grid’5000 resources are completely reconfigurable for the need of ex-perimentations. It is possible to reserve a fraction of the nodes available and to deploy any operating system and tool on these resources. As such, Grid’5000 does not operate a specific middleware stack. A rich tooling is available to re-serve resources and deploy custom system images though. In the experiments reported in this paper, Scientific-Linux-4 system images have been deployed on the reserved Grid’5000
resources and the DIET [2] middleware has been installed.
2.3
Qualitative comparison
Beyond raw performance, grid usability depends on the features available to support application executions. This section summarizes the main differences between EGI and Grid’5000 on this aspect.
Production usage.
The EGI infrastructure is dedicated to production. As such it exposes to the users a sustained service with guar-anteed access to the resources over a very long period of time. In particular, storage resources are provided for long-term storage of scientific data and resources availability is guaranteed (up to the competitive use by different users). Conversely on the Grid’5000 infrastructure, resources are dedicated for the time of an experiment. Resources are then freed, and scratch data storage is not guaranteed for longer time period (permanent data has to be saved to the persis-tent shared space of the platform). Another major difference between production and research infrastructures is the work-load: it is completely dependent on the usage of other users on a production infrastructures while it is much more stable on dedicated resources. There might be side effects com-ing from the activity of other users on dedicated resources though. In particular, the network traffic is impacted by communications independent from the experiment to which the resources are dedicated and the allocation of multiple CPUs or multiple cores from the same board to different experiments may lead to undesirable run conditions
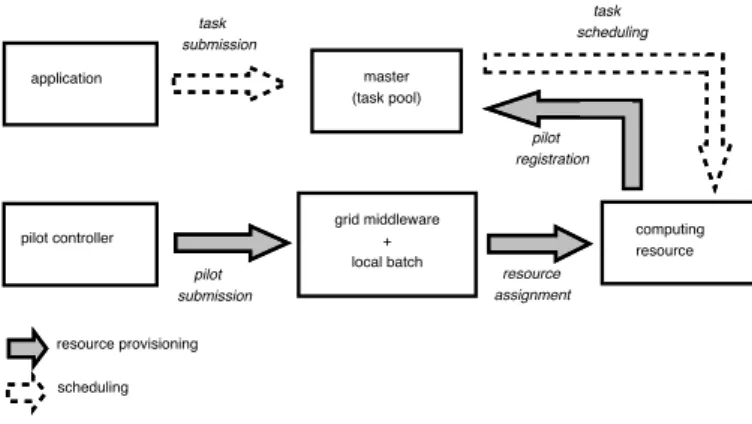
(mem-master (task pool) grid middleware + local batch computing resource application pilot controller resource provisioning scheduling pilot registration pilot submission task submission task scheduling resource assignment
Figure 1: Principle of a pilot-job execution.
ory shortage due to concurrent use of the central memory, performance side effects due to I/O bottlenecks...).
Resource reservation.
The EGI infrastructure operates a collection of batch sys-tems coordinated through a Workload Management Sys-tem. The latter implements a meta-scheduler over hetero-geneous batch schedulers. Conversely, the Grid’5000 infras-tructure relies on resource reservation: resources are re-served in advance for a pre-determined duration. The al-located resources are fully dedicated to the user who made the reservation. Consequently, each task submitted to the EGI infrastructure undergoes a variable delay related to the time needed for the match-maker to identify a target batch system, the batch system queuing time and data transfer delays. On the Grid’5000 infrastructure, tasks submitted are potentially executed immediately (if sufficient resources were reserved) and undergo only scheduling and data trans-fer time. Furthermore, the amount of resources available for an application is well known and controlled, while on the EGI infrastructure it is difficult to measure the num-ber of resources available for a specific application. Only the possible number of accessible resources is known, but in practice these resources are shared among the users. To improve resource dedication on the EGI infrastructure, pilot
job techniques have been widely used [8,11,12]. As shown
on Figure1, pilot jobs are submitted through the regular job
submission system. However, pilots are not regular applica-tion jobs. Once started, they keep occupying the resource, connecting to an application-level master node to request for application tasks to be executed. If enough tasks are avail-able, they keep on processing tasks as much as the resource can be kept (i.e. as long as the pilot does not get killed by the batch system). This strategy proved very efficient from a user perspective as the pilots allocated are fully dedicated to the submitter. The pilot submission (resource provisioning) is still dependent from the batch submission system though.
Scale.
The EGI infrastructure gathers more than 140,000 CPU cores distributed over 250 sites world-wide while the Grid’5000 infrastructure has some 5,000 CPU cores distributed over 9 sites in France. The scale and complexity of these infrastruc-tures significantly differ, although both rely on WAN inter-connection. From a user point of view, the scale factor
can-not be interpreted as a raw performance indicator since the EGI resources undergo competition from much more users.
Middleware.
While the EGI middleware is imposed by the infrastruc-ture, the Grid’5000 infrastructure appears much more flex-ible and customizable for application needs. In addition, users can acquire root access to allocate nodes from Grid’5000, while it is not the case on EGI nodes. The EGI Data Man-agement Service provides user with a grid-wide virtual file hierarchy while data in Grid’5000 is clustered per site, each site operating an NFS server.
Heterogeneity.
Both infrastructures have different (and evolving) CPU types deployed. The EGI infrastructure is more homoge-neous as it only features Intel-compatible hosts operating RedHat-based operating systems. The main differences be-tween clusters are due to different generations of CPUs (32 versus 64 bits, mono versus multi-cores, etc). The Grid’5000 infrastructure has a wider variety of CPUs and architectures installed.
Security.
A consequence of the flexibility provided by the Grid’5000 administration capability is the stricter security policy. On Grid’5000 the network is completely closed: all outgoing connections are filtered and inbound connectivity is limited to ssh access to cluster gateways (one per site). Conversely, the network is open within the Grid’5000 infrastructure, even between hosts located in different sites. The situa-tion is different on EGI. Generally, outbound connectivity is allowed by sites although nothing is formally specified. Yet, most of sites deny incoming connections from external networks, even from other EGI sites. These connectivity differences have serious implications on application deploy-ment. The security infrastructure on EGI is based on a shared Public Key Infrastructure and the delivery of X.509 certificate by a network of Certification Authorities trusted grid-wide. Regular (yet synchronized) Unix accounts are created for each Grid’5000 site-wise. As a result, the au-thorization framework differs on both infrastructures. For instance, regular Unix file permissions are used on Grid’5000 while a specific ACL-based file access control is implemented in the EGI Data Management System. The need for data and user security are lower in Grid’5000 since the resources are only allocated for short period to each experiment and the network is completely closed to the outside world.
Reliability.
Grid infrastructures and middleware stacks encounter re-liability problems proportionally to their complexity and scale. Users of the EGI infrastructure usually report high error rates (up to 30% in some cases, regularly more than 10%). These result in non negligible amounts of failed tasks and in high and unforeseeable delays in the tasks manage-ment time (the tasks undergo delays that are typically dis-tributed as heavy-tailed probability laws).
3.
EXPERIMENTAL SETUP
To quantitatively compare executions on the EGI and the Grid’5000 infrastructures, different application performance
metrics are measured along several runs of the same appli-cation. The experiments described below attempt to mini-mize the differences between the infrastructure when it can be controlled.
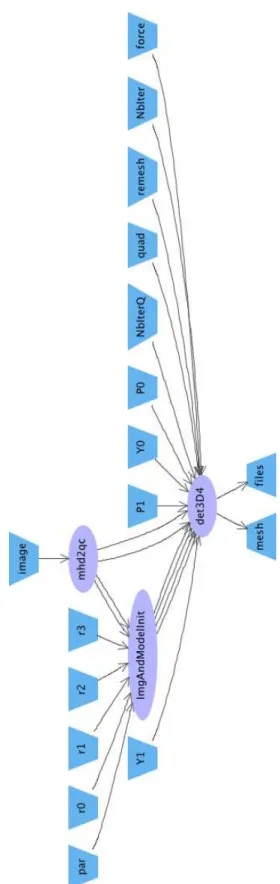
A simple application workflow, illustrated in Figure2, was
selected for all runs. The workflow performs segmentation of the myocardium (inner and outer walls of the heart left and right ventricles) in 3D+T cardiac image sequences using a physical elastic template of the myocardium. The goal of this workflow is to optimize the quality of the segmentation result based on an exhaustive sweep of the parameter space.
In Figure2the two first processing steps (mhd2qc and
Im-gAndModelInit) are executed only once at the beginning of each run to initialize the segmentation process. The subse-quent segmentation step (det3D4) is executed once for each set of segmentation parameters specified as input. There is a combinatorial number of runs depending on the number of parameter values (in particular, different model attraction force factors (force workflow input), and different values of the elastic template physical Poisson and Young coefficients, P0, P1, Y0, and Y1). This workflow can produce a variable number of computing tasks depending on the size of the considered parameter space. Three experiment sizes were considered in these experiments: a small -size experiment, producing 14 tasks; a medium-size experiment, producing 202 tasks; and a large-size experiment with 2082 tasks.
To obtain comparable execution environments, Scientific Linux (v4) operating system images have been deployed on the Grid’5000 infrastructure. As a consequence, the same application binaries can be invoked on both platforms. Each experiment is restarted 5 times, at various times and days, to average measurements and estimate standard deviations.
3.1
Relative performance comparison
The first experiment provides information of relative grid performance by executing the same application in controlled conditions to align the execution environments as much as possible while running on different grid infrastructures. Pi-lot jobs are used on the EGI infrastructure, making it pos-sible to dedicate a controllable number of resources for the application run. The pilots are started before the execu-tion runs and an external process monitors the populaexecu-tion of pilot jobs to maintain its number.
In these experiments the target is to maintain a total num-ber of 54 pilots. To achieve this, a dedicated “buffer”
sched-uler was developed in the DIANE pilot-job framework [8].
It behaves as a connection buffer between the pilots and the “real” scheduler used for the experiment. An overestimated number of pilots are submitted before the experiment starts and the buffer scheduler progressively delivers pilot connec-tions to the real scheduler to ensure that exactly 54 resources are available for the experiment. In practice, the provision-ing of up to 90 pilots was required to ensure a constant pilot population size during the longest experiments. The pilots are located on pre-determined sites to ensure that resources distribution keeps coherent along the experiment. Similarly, data transfer conditions were adjusted. Coherently with the policy set in the DIET DAGDA (file persistence), files trans-ferred to a pilot node are cached so that a subsequent task using the same file does not require an additional grid file transfer. Output files are stored on the local site’s Storage Elements to minimize transfer times.
The same number of resources is allocated on EGI and
Figure 2: Segmentation workflow graphical repre-sentation
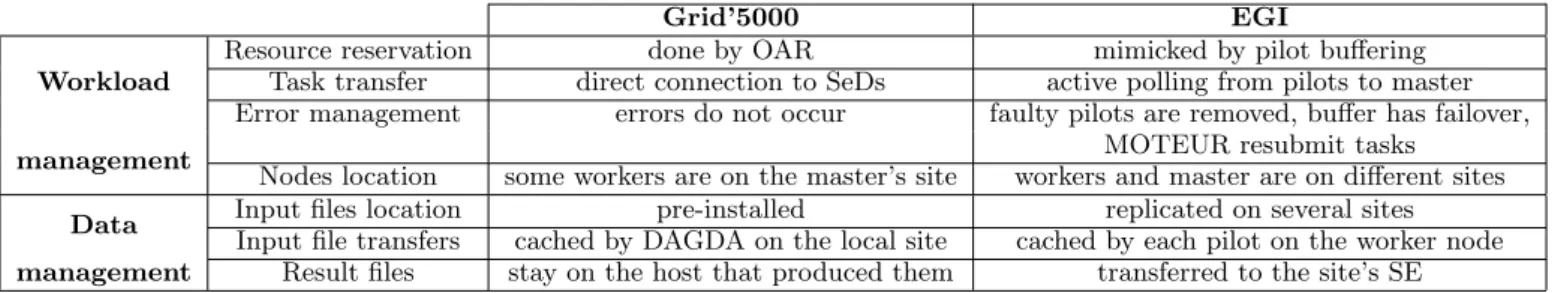
Grid’5000 EGI Workload
Resource reservation done by OAR mimicked by pilot buffering
Task transfer direct connection to SeDs active polling from pilots to master
Error management errors do not occur faulty pilots are removed, buffer has failover,
management MOTEUR resubmit tasks
Nodes location some workers are on the master’s site workers and master are on different sites
Data Input files location pre-installed replicated on several sites
Input file transfers cached by DAGDA on the local site cached by each pilot on the worker node
management Result files stay on the host that produced them transferred to the site’s SE
Table 1: Conditions of the experiment
Grid’5000 (54 CPU cores). Two experimental setups were considered: in the first one, 54 dedicated resources were co-allocated on a single site while in the second setup 3 dif-ferent sites (each hosting 18 resources) were used to study the impact of wide area network communications. The ap-plication makespan, the processes execution time, the data transfer time and the processes idle time are measured. The execution being performed in similar conditions, with a con-trolled number of resources all dedicated to the experiment, the time measures can be compared and give some insight on the performance difference resulting from the execution environment (workflow managers, middleware, and sched-ulers).
3.2
Production conditions
A user exploiting the infrastructures with no particular setup controlling the number of resources will experience performance differences resulting from the uncontrolled num-ber of computing resources available (in addition to other structural differences). This experiment compares the per-formance achieved when running large-size applications on the EGI infrastructure in controlled conditions (using pilots and controlled reservations) to the performance obtained in regular production (still using pilots but greedy pilot sub-mission).
The larger the number of heterogeneous resources used within an experiment, the higher the probability for failure. This experiment also quantifies the loss induced by the use of a large-scale production environment versus execution on a limited number of well controlled resources.
4.
QUANTITATIVE COMPARISON
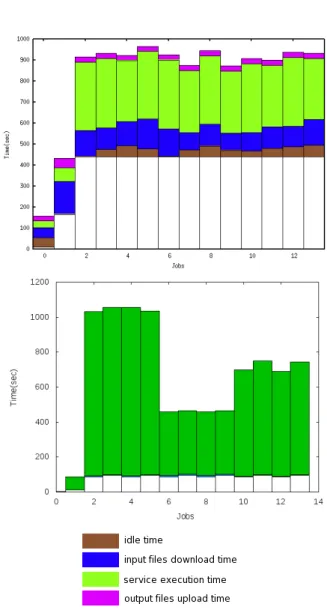
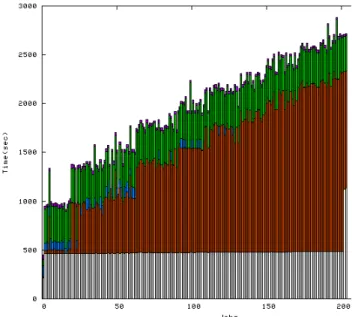
Figure 3 displays the job graph of a typical run on the
EGI (top) and the Grid’5000 (bottom) DCIs for a small-size experiment, in controlled conditions as described in
Sec-tion3.1. Horizontally, tasks appear in the order they are
cre-ated. The first task created is numbered 0. It corresponds to the mhd2qc process. After approximately 200 seconds, the process terminates and the subsequent task
ImgAndMod-elInit(task number 1) starts. When this task terminates,
the 12 segmentation tasks start concurrently (tasks 2 to 13). Since there are more computing nodes than needed, all tasks are supposed to start immediately. Their execution time is similar and all complete approximately at the same time. For each of the 14 tasks, the job graph shows the time spent before completion, split in five successive time slots:
• white: time before the task is ready (i.e. all its
prede-cessors completed);
• brown: idle time of the task (including scheduling time
and queuing time, once the task has been created);
• blue: input data download time;
• green: running time of the task; and
• purple: output data upload time. The actual values
are reported in Table2.
The variations on the execution time of the segmentation tasks are partly explained by the non-deterministic nature of the segmentation algorithms (two runs with different input parameter values may result in slightly different execution times), and partly by the heterogeneity of the CPU cores executing the codes. On EGI, the 12 segmentation tasks were executed on Intel Xeon CPUs with slightly different frequencies (2.27, 2.50 and 2.83 GHz), while on Grid’5000 they were executed on more heterogeneous resources ranging from Intel Xeon L5420 @ 2.5GHz (highest) to AMD Opteron 245 @ 2 GHz (lowest). Execution time is significantly lower on the EGI nodes than on Grid’5000 ones as hardware re-sources operated in production computing centers tend to be renewed more frequently, leading to higher performing computing nodes.
Conversely, despite the controlled conditions enforced on the EGI grid infrastructure, the middleware overhead (idle time) and the data transfer times are orders of magnitude higher on EGI than on Grid’5000. The gLite middleware secured communication protocols and polling loops intro-duce non-negligible latencies in the management of the jobs and the access to files. Moreover, the gLite data manage-ment system is a multi-stacked system (mainly composed of LFC, SRM and gridFTP) which introduces significant la-tencies on the data transfers. On Grid’5000, idle times and data transfer times are negligible. The tasks push strategy implemented by the DIET middleware does not cause artifi-cial delays as observed when using pilots on EGI. The data transfers on the infrastructure dedicated high performance network and the file caching strategy implemented in DIET are efficient to lower data transfer times.
4.1
Medium-size experiments
Figure4shows the job graph of a typical medium-size run
on both DCIs and Table3gives quantitative values averaged
over several runs. The clustering of tasks in batches of 54 can clearly be seen on EGI: only 54 nodes are available at any time and 54 tasks are executed concurrently, appearing as 4 execution phases in the job graph (with a progressive de-sequencing due to the heterogeneous data transfer and execution times). On Grid’5000, the 4 batches of 54 con-current tasks appear vertically (4 groups of execution). The
DCI Makespan Idle time (brown) Data transfer time (blue and purple) Execution time (green)
EGI 965 s 33 s ± 18 132 s ± 29 275 s ± 93
Grid’5000 1061 s 0.21 s ± 0.34 3.37 s ± 2.57 541 s ± 298
Table 2: Execution behavior of a small-size experiment on EGI and Grid’5000.
Figure 3: Typical job graph for a run with 14 tasks on the EGI (top) and Grid’5000 (bottom) DCIs.
horizontal slicing of the job graph is due to the DIET MA-DAG strategy to handle large workflows as the complete 202-task workflow is sliced into 10 sub-DAGs which compete to access resources available. The figure also clearly shows the impact of the EGI pilots file caching strategy: the first batch of 54 tasks transfer input files (blue time slot) which are then cached on the computing nodes. Since other seg-mentation tasks will reuse the same files and run on the same allocated nodes, there is no more input file transfer needed
from the 55th
task.
On the EGI the profiles of mono-site and 3-site runs are close to each other. For 3 sites, a few task failures caused task resubmissions. In spite of controlled conditions, there are significant variations on the production infrastructure mostly due to data transfer time heterogeneity. The impact of using 3 sites instead of 1 is far greater on Grid’5000 than it is on EGI. On Grid’5000, the input data transfer times im-pact becomes non-negligible in the case of multi-site runs. On EGI, the lack of difference in the data transfer perfor-mance is explained by the fact that input data files were replicated on several sites of the infrastructure. Data trans-fers over WANs may occur in any case, e.g., if the chosen site does not host the input data. The similar values observed in the idle time come from the fact that in any case the master and the pilots have to be deployed on different network do-mains, which imposes an active polling from the pilots to the master to circumvent connectivity policies. Execution times are also very much similar, due to the relative homogene-ity in the CPU characteristics of the different sites. This tends to suggest that increasing the number of EGI sites does not significantly burden the performance. Surprisingly, the variability of the makespan is higher on Grid’5000 than it is on EGI. It suggests that the reproducibility of experi-ments on Grid’5000 is not better than using the controlled setup on EGI. The standard-deviation of the idle time and data transfer time is of the same order of magnitude as the average while it is at least twice lower on EGI.
4.2
Large-size experiments
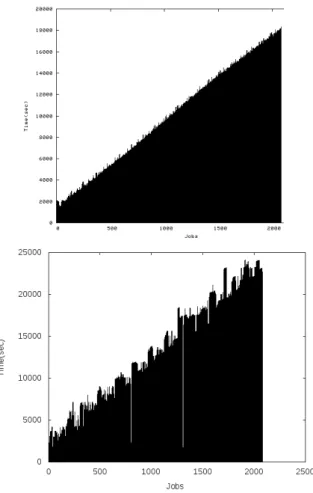
Figure5 and Table 4report results on large-size
exper-iments. The density of tasks makes the overall job graph hardly readable: only the linear profile of job completion can be perceived. This behavior is expected as a constant number of computing nodes is available. On Grid’5000, the profile is a bit sharper due to heterogeneity on computing resources performances. The reproducibility of mono-site experiments is much better on Grid’5000 (σ = 13.4s) than on EGI (σ = 1172s). For 3-site experiments, the repro-ducibility is better on EGI though (σ = 287s versus 641s on Grid’5000).
It proved to be difficult to complete large-size runs (2082 tasks) in controlled condition on the EGI infrastructure. Many experiments failed before completion due to various problems (permanent file transfer errors, pilots being re-moved from sites for various reasons, grid unavailability
prob-DCI Makespan Idle time Data transfer time Execution time
EGI, mono-site 2299 s ± 460 627 s ± 143 81 s ± 58 317 s ± 6
EGI, 3-sites 2226 s ± 331 576 s ± 55 58 s ± 27 335 s ± 0.3
Grid’5000, mono-site 2028 s ± 563 27s ± 91 0.97 s ± 1.36 430 s ± 40
Grid’5000, 3 sites 3443 s ± 388 111 s ± 223 20 s ± 15 576 s ± 240
Table 3: Execution behavior of medium-size experiments on EGI and Grid’5000. For each metric, the values measured are averaged over 3 to 5 workflow executions.
Figure 4: Typical job graph for a run with 202 tasks on the EGI (top) and the Grid’5000 (bottom) DCIs.
Figure 5: Typical job graph for a run with 2082 tasks on the EGI (top) and the Grid’5000 (bottom) DCIs.
lems, etc). The over-buffering strategy adopted to ensure a constant-size population of pilots along the complete exper-iment caused some resources to be reserved by idle pilots for the experiment duration (5 hours or more). Such pilots may be considered as faulty processes and be automatically removed to release nodes by the site administration proce-dures. Other causes of pilot failure increase with the dura-tion of the experiment. Consequently, experiment failures are common. On Grid’5000 as well, some faults of the reser-vation system (reserreser-vation overlaps between multiple users) and a complete platform crash were experienced.
5.
CONTROLLED VERSUS
UNCONTROL-LED EXECUTION CONDITIONS
con-Site Makespan Idle time Data transfer time Execution time
EGI, mono-site 17214 s ± 1172 6851 s ± 1099 50 s ± 24 356 s ± 1
EGI, 3 sites 19344 s ± 287 9577 s ± 1003 38 s ± 10 420 s ± 18
Grid’5000, mono-site 24940 s ± 13 12 s ± 86 0.51 s ± 1.24 629 s ± 25
Grid’5000, 3 sites 24477 s ± 641 70 s ± 220 13 s ± 12 594 s ± 200
Table 4: Execution behavior of large-size experiments on EGI and Grid’5000. For each metric, the values measured are averaged over 3 to 5 workflow executions.
trolled environment is expected to vary when compared to regular production conditions, due to two antagonist factors: the limited number of controlled resources causing perfor-mance loss and a better control over the availability and ho-mogeneity of resources causing performance improvement. These two factors are quantitatively evaluated in the exper-iments based on large-size runs reported in this section.
5.1
Impact of pilots and limited number of
re-served resources
Although the experiments implemented above require to wait for a given number of pilots to become simultaneously available before starting execution, this delay is not
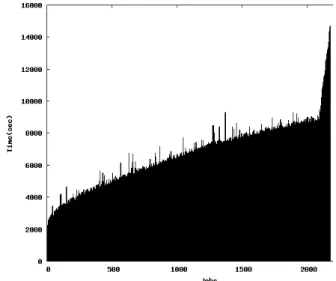
imple-mented in production to avoid wasting CPU cycles. Figure6
shows an experiment executed on the EGI infrastructure
us-ing Algorithm1to submit pilots. This is a greedy algorithm
submitting pilots as long as tasks are scheduled in the mas-ter. The dispatching of pilots among grid sites is up to the gLite Workload Management System and not controlled here.
The profile of this curve significantly differs from the one
observed in Figure5. It is not linear any more: the
work-flow system is not limited to a restricted number of pilots and attempts to allocate concurrently as many resources as
possible. It can be seen in Figure 6 that more resources
are recruited than with 54 dedicated pilots, although these resources were not pre-reserved before the beginning of the experiment. As a result, it takes some time for the first tasks to be processed (slow start, with ≈ 2000 s latency be-fore the first task completes) but the number of resources recruited quickly compensate for the performance loss (high throughput with a low slope envelope curve) until the last and slowest tasks are processed (peak in the right-most part of the graphs). The peak comes from task resubmissions resulting from failures. When tasks fail towards the end of the experiment, only a few pilots remain available, which delays a lot the completion of the last task. This is even worse when tasks have to be resubmitted several times. This
Algorithm 1 Algorithm controlling the submission of pilots in the “uncontrolled experiment”
init=10, defaultSleep=400, s=defaultSleep,
max-Sub=300, factor=5 start DIANE master submit init pilots while master is alive do
sleep s seconds
n = number of tasks waiting in master submit sub=min(maxSub,n) pilots s = defaultSleep+sub*factor end while
Figure 6: A run with 2082 tasks under regular pro-duction conditions.
phenomenon suggests that the sites involved in an experi-ment should be carefully controlled and probably limited to a smaller number of reliable, efficient sites.
Table 5summarizes the behavior of this experiment. It
can be noted that the average execution time is higher and has much higher variations than the runs in controlled
con-dition using 1 or 3 sites (Section4.2). This can be expected
as the jobs are spawned over a large number of sites with dif-ferent hardware resources. The average makespan of these experiments is slightly better, but in the same order of mag-nitude, than the makespan observed in controlled condition (≈ 16000 s). This shows that the set of resources available for execution (the biomed Virtual Organization resources) on the EGI grid infrastructure only slightly outperforms a set of 54 dedicated resources. This comment is only valid considering that:
• Unlike the set of dedicated resources, EGI resources
are not dedicated to a single experiment at a time and multiple experiments can be ran concurrently with only very small performance impact (in other terms, the throughput can increase significantly although the absolute performance cannot);
• The EGI resources are shared between multiple users
and disciplines;
• The EGI resources are administrated and available
24/7/365 to the users, which is hardly the case of ded-icated clusters installed in small laboratories.
Experiment Makespan Idle time Data transfer time Execution time 1st run 14690 5970 s ± 1751 64 s ± 1277 416 s ± 166 2nd run 13655 4946 s ± 1571 78 s ± 727 416 s ± 170 3rd run 16177 6092 s ± 2102 70 s ± 773 410 s ± 118 average 14841 s ± 1035 5669 s ± 514 71 s ± 5.5 414 s ± 3
Table 5: Execution behavior of large-size experiments on EGI, in uncontrolled conditions (using algorithm1
to submit the pilots).
The reasons why the whole EGI infrastructure does not out-perform significantly the set of dedicated resources lies in the variation of unit processes execution times and the failure rates encountered which is much higher than when using
controlled pilots. Table 6 summarizes the distribution of
tasks (number of site batch queues used during the experi-ment) and the failure rate observed in non-controlled condi-tions (number of failed jobs versus 2082 jobs to complete).
Finally, it should be noted that the workflow considered in these experiments is not very sensitive to failures: failures cause resubmission which lengthen the overall workflow ter-mination but there is no cascade effect due to dependencies on the tasks executed. A more complex workflow would probably be more penalizing regarding execution in non-controlled conditions.
These results also show the impact of the last tasks on the makespan of the executions performed in production condi-tions. Improving the scheduling (both resource provisioning and task placement) would much likely have a significant impact on the makespan. Obviously, the number of sites used for a given experiment has to be better controlled in production.
5.2
Impact of pilots start time
synchroniza-tion
Since pilot jobs are submitted using the regular batch in-terface of the gLite Workload Management System, their execution start is subject to the variable workload and exe-cution conditions on the EGI production grid infrastructure at the time of the experiment. For obtaining controlled con-ditions on EGI (54 pilots ready for concurrent processing), it was necessary to submit an over-provisioned number of pilots (typically 70 to 90) and to wait for at least 54 of them to become available. This process could take from a dozen of minutes to hours (some experiments were aborted before starting because the necessary number of pilots could not be acquired in less than two hours). Under normal produc-tion use of pilots, this delay should be taken into account in the application makespan computation. Usually, production runs are started without trying to synchronize the pilots.
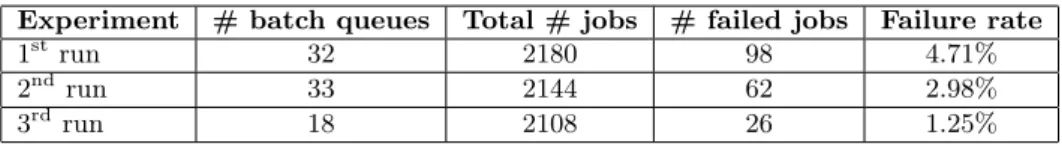
Figure7displays a typical example of a medium-size
produc-tion run with unsynchronized pilot starts. It can be noted that the time to execute the two first workflow initialization stages is slightly longer than the average time observed for
comparable experiments (see Section4.1), probably due to
the time for the first pilot to become available before start-ing processstart-ing. Once the two first initialization tasks have been completed, approximately 20 segmentation tasks start concurrently. This corresponds to the number of pilots that could be started while the initialization tasks executed. The remaining pilots become available progressively as the run progresses until all 54 pilots are available. The resulting
makespan (2904 s) is slightly longer than comparable exper-iments.
Figure 7: medium-size run without synchronization of the pilots start time.
6.
CONCLUSIONS
This paper described an approach to compare the perfor-mance of different DCIs using language-compatible workflow engines to reproduce experiments on the targeted execution platforms. This method was applied to the EGI and the Grid’5000 DCIs which exhibit completely different objec-tives and architectures. To align execution conditions on both infrastructures, a co-reservation mechanism based on pilot jobs was implemented to allocate a fixed number of grid resources when no other mean of reservation is available. Results show that the approach can scale up to large-size ex-periments (thousands of jobs) although it seems difficult to continue far beyond due to practical problems arising (dura-tion of experiments causing several technical problems and resources held idle for a long period of time).
Raw performance variations between the EGI and Grid’5000 infrastructures are clearly identified: the former benefits from latest computation hardware, demonstrating better per-formance than the latter (typically twice faster) while longest range communications and non-dedicated network cause data transfers to be less efficient. The experiments also exhibits differences between the gLite and the DIET middleware op-erating the resources on EGI and Grid’5000 respectively.
Experiment # batch queues Total # jobs # failed jobs Failure rate 1st run 32 2180 98 4.71% 2nd run 33 2144 62 2.98% 3rd run 18 2108 26 1.25%
Table 6: Failure rates experienced in production in uncontrolled conditions.
gLite suffers much higher overhead related to security poli-cies enforcement and polling strategies implemented.
The results reported here show that it is possible to con-duct experiments related to task-based workflow execution on a production infrastructure with similar reproducibility than on an experimental platform. The controlled condi-tions maintained on the EGI infrastructure through pilots jobs are not completely realistic in production mode, due to the over-provision of pilots and the requirement for simulta-neous co-allocation. However, many large-size experiments started using pilots on the EGI grid infrastructure to solve job latency and resource reliability problems. These appli-cations are running in conditions close to the one enforced for these experiments and the variations are investigated in
Section5.
In the future, it would be interesting to execute different workflows within the same framework to show the repro-ducibility or the variations of the measurements performed under such controlled conditions while dealing with different data flow patterns.
7.
ACKNOWLEDGMENTS
This work is supported by the French ANR Gwendia
project5
under contract number ANR-06-MDCA-009, and
the European I3 SHIWA project6
under contract number 261585.
8.
REFERENCES
[1] W. H. Bell, D. G. Cameron, A. P. Millar, L. Capozza, K. Stockinger, and F. Zini. Optorsim: A Grid Simulator for Studying Dynamic Data Replication Strategies. International Journal of High Performance
Computing Applications (IJHPCA), 17(4):403–416,
Nov. 2003.
[2] E. Caron and F. Desprez. DIET: A Scalable Toolbox to Build Network Enabled Servers on the Grid.
International Journal of High Performance Computing Applications, 20(3):335–352, 2006.
[3] T. Glatard, J. Montagnat, and X. Pennec. A probabilistic model to analyse workflow performance on production grids. In T. Priol, L. Lefevre, and R. Buyya, editors, IEEE International Symposium on
Cluster Computing and the Grid (CCGrid’08), pages
510–517, Lyon, France, May 2008. IEEE. [4] A. Legrand, M. Quinson, K. Fujiwara, and
H. Casanova. The SimGrid Project - Simulation and Deployment of Distributed Applications. In
Proceedings of the IEEE International Symposium on High Performance Distributed Computing (HPDC-15),
Paris, France, 2006. IEEE Computer Society Press.
5
GWENDIA,http://gwendia.polytech.unice.fr
6
SHIWA,http://www.shiwa-project.eu
[5] D. Lingrand, T. Glatard, and J. Montagnat. Modeling the latency on production grids with respect to the execution context. Parallel Computing (PARCO), 35(10-11):493–511, Oct. 2009.
[6] E. Medernach. Workload Analysis of a Cluster in a Grid Environment. In Job Scheduling Strategies for
Parallel Processing (JSSPP), pages 36–61, Cambridge,
MA, USA, June 2005.
[7] J. Montagnat, B. Isnard, T. Glatard, K. Maheshwari, and M. Blay-Fornarino. A data-driven workflow language for grids based on array programming principles. In Workshop on Workflows in Support of
Large-Scale Science (WORKS’09), pages 1–10,
Portland, USA, Nov. 2009. ACM.
[8] J. T. Mo´scicki. Distributed analysis environment for HEP and interdisciplinary applications. Nuclear
Instruments and Methods in Physics Research A,
502:426–429, 2003.
[9] G. Nudd, D. Kerbyson, E. Papaefstathiou, S. Perry, J. Harper, and D. Wilcox. PACE: A toolset for the performance prediction of parallel and distributed systems. International Journal of High Performance
Computing Applications (IJHPCA), 3(14):228–251,
Aug. 2000.
[10] D. Spooner, J. Cao, S. Jarvis, L. He, and G. Nudd. Performance-aware Workflow Management for Grid Computing. The Computer Journal, 3(48):347–357, May 2005.
[11] D. Thain, T. Tannenbaum, and M. Livny. Distributed computing in practice: the Condor experience.
Concurrency and Computation: Practice & Experience (CCPE), 17(2–4):323–356, 2005.
[12] A. Tsaregorodtsev, M. Bargiotti, N. Brook, A. C. Ramo, G. Castellani, P. Charpentier, C. Cioffi, J. Closier, R. Diaz, G. Kuznetsov, Y. Li,
R. Nandakumar, S. Paterson, R. Santinelli, A. Smith, M. Miguelez, and S. Jimenez. DIRAC: a community grid solution. Journal of Physics: Conference Series, 119, 2008.
[13] R. Wolski. Experiences with predicting resource performance on-line in computational grid settings.
ACM SIGMETRICS Performance Evaluation Review,
4(30):41–49, Mar. 2003.
[14] R. Wolski, N. Spring, and J. Hayes. The network weather service: a distributed resource performance forecasting service for metacomputing. Future
Generation Computer Systems (FGCS),