HAL Id: hal-00443083
https://hal.archives-ouvertes.fr/hal-00443083
Submitted on 28 Dec 2009
HAL is a multi-disciplinary open access
archive for the deposit and dissemination of
sci-entific research documents, whether they are
pub-lished or not. The documents may come from
teaching and research institutions in France or
abroad, or from public or private research centers.
L’archive ouverte pluridisciplinaire HAL, est
destinée au dépôt et à la diffusion de documents
scientifiques de niveau recherche, publiés ou non,
émanant des établissements d’enseignement et de
recherche français ou étrangers, des laboratoires
publics ou privés.
Non-LTE abundances of Mg and K in extremely
metal-poor stars and the evolution of [O/Mg], [Na/Mg],
[Al/Mg] and [K/Mg] in the Milky Way.
S.M. Andrievsky, Monique Spite, S.A. Korotin, F. Spite, P. Bonifacio, R.
Cayrel, P. François, V. Hill
To cite this version:
S.M. Andrievsky, Monique Spite, S.A. Korotin, F. Spite, P. Bonifacio, et al.. Non-LTE abundances of
Mg and K in extremely metal-poor stars and the evolution of [O/Mg], [Na/Mg], [Al/Mg] and [K/Mg]
in the Milky Way.. Astronomy and Astrophysics - A&A, EDP Sciences, 2010, pp.13223. �hal-00443083�
(DOI: will be inserted by hand later)
c
ESO 2010
Astrophysics
&
Non-LTE abundances of Mg and K in extremely metal-poor stars
and the evolution of [O/Mg], [Na/Mg], [Al/Mg] and [K/Mg] in the
Milky Way.
⋆
S.M. Andrievsky
1,2, M. Spite
1, S.A. Korotin
2, F. Spite
1, P. Bonifacio
1,3,4, R. Cayrel
1, P. Franc¸ois
1, and V. Hill
51 GEPI, Observatoire de Paris, CNRS, Universit´e Paris Diderot; F-92125 Meudon Cedex, France, e-mail :
monique.spite@obspm.fr
2 Department of Astronomy and Astronomical Observatory, Odessa National University, Isaac Newton Institute of Chile, Odessa branch, Shevchenko Park, 65014 Odessa, Ukraine, e-mail : scan@deneb1.odessa.ua
3 CIFIST Marie Curie Excellence Team
4 Istituto Nazionale di Astrofisica, Osservatorio Astronomico di Trieste, Via Tiepolo 11, I-34143 Trieste, Italy 5 Observatoire de la Cote dAzur, CNRS UMR6202, BP4229, 06304 Nice Cedex4, France
ABSTRACT
Aims.LTE abundances of light elements in extremely metal-poor (EMP) stars have been previously derived from high quality spectra.
New derivations, free from the NLTE effects, will better constrain the models of the Galactic chemical evolution and the yields of the very first supernovae.
Methods.The NLTE profiles of the magnesium and potassium lines have been computed in a sample of 53 extremely metal-poor stars
with a modified version of the program MULTI and adjusted to the observed lines in order to derive the abundances of these elements.
Results.The NLTE corrections for magnesium and potassium are in good agreement with the works found in the literature. The
abundances are slightly changed, reaching a better precision: the scatter around the mean of the abundance ratios has decreased. Magnesium may be used with confidence as reference element. Together with previously determined NLTE abundances of sodium and aluminum, the new ratios are displayed, for comparison, along the theoretical trends proposed by some models of the chemical evolution of the Galaxy, using different models of supernovae.
Key words.Galaxy: abundances – Galaxy: halo – Galaxy: evolution – Stars: abundances – Stars: mixing – Stars: Supernovae
1. Introduction
In the frame of the ESO Large Program ”First stars, first nu-cleosynthesis” Cayrel et al. (2004) and Bonifacio et al. (2007, 2009) have studied an homogeneous sample of extremely metal-poor giants and turnoff stars. For about fifty stars, most of them with [Fe/H] < −3, they determine the abundances of the ele-ments from C to Zn, especially of the light metals Na, Mg, Al and K, in the early Galaxy. These abundances are based on LTE computations of the equivalent widths or of the line profiles.
After sodium and aluminum (Andrievsky et al., 2007, 2008) we present here non-LTE determinations of the magnesium and potassium abundances by comparison of the observed and com-puted line profiles and we discuss the evolution of the abundance ratios [O/Mg], [Na/Mg], [Al/Mg] and [K/Mg] in the Galaxy. Recently, Takeda et al. (2009) have computed the non-LTE abun-dance of potassium in the same sample of EMP stars, based on the equivalent widths of the potassium lines given in Cayrel et al. (2004). We compare our results with their determinations.
In Cayrel et al. (2004) and Bonifacio et al. (2007, 2009), iron had been first chosen as the main tracer of the chemical evolu-tion of the Galaxy. It had also been noted however,that iron is perhaps not the best choice since there are several processes that ⋆ Based on observations obtained with the ESO Very Large Telescope
at Paranal Observatory (Large Programme ”First Stars”, ID 165.N-0276; P.I.: R. Cayrel.
affect the yield of iron : Si burning in massive SNe II, explo-sive nucleosynthesis, mixing and fallback episodes and possi-ble late SN Ia contributions. Magnesium is, in principle, a better choice since this element is mainly formed in massive SNe, its production is dominated by hydrostatic carbon burning, and it is less affected by explosive burning and fallback (e. g. Woosley & Weaver, 1995). Among others, Shigeyama & Tsujimoto (1998) recommended Mg rather than Fe as a reference element, follow-ing the same logic.
Cayrel et al. (2004) have recognised this too and have ac-cordingly used magnesium as a reference element to compare the observed ratios [X/Mg] to the ejecta of the massive super-novae in the last part of the paper. But it appeared that unexpect-edly the relations [X/Mg] vs. [Mg/H] were more scattered than the corresponding relations [X/Fe] vs. [Fe/H]. Also, in Bonifacio et al. (2009), the mean value of [Mg/Fe] differed significantly in giant and turnoff stars. As a consequence we suspected that both the unexpected behaviour of the scatter of the ratios [X/Mg] and the different behaviour of dwarfs and giants could be due at least partly to the neglect of the departures from LTE.
- In Sect. 2 we present the characteristics of the atomic models used for the non-LTE computations.
- In Sect. 3 are presented the main parameters of the analysis. - In Sect. 4 we discuss the ratios [Mg/Fe] and [K/Fe] in the early Galaxy, and we compare the ratios [O/Mg], [Na/Mg], [Al/Mg] and [K/Mg] at low metallicity to the predictions of the ejecta of supernovae/hypernovae. Finally for a complete halo-disk
pic-2 Andrievsky: Relative abundances of light metals in EMP stars
ture we have also added the NLTE determinations of the abun-dances of Na, Mg, Al and K in the disk from the ”Gehren team” (Gehren et al. 2004, 2006, Mashonkina et al. 2008, and Zhang et al. 2006), to study the evolution of these ratios in the Galaxy and to compare this to the predictions of the models of the chemical evolution of the Galaxy.
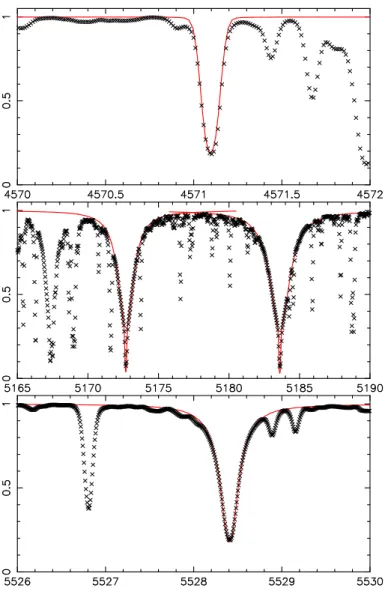
Fig. 1. Profile fitting of the magnesium lines in the solar
spec-trum.
Fig. 2. Profile fitting of the potassium lines in thesolar spectrum.
2. Atomic models and NLTE calculations
2.1. Magnesium
The atomic model of magnesium used in this work is essen-tially the same as the onedescribed in Mishenina et al. (2004). This model consists of 84 levels of Mg i, 12 levels of Mg ii and the ground level of Mg iii (Martin & Zalubas, 1980, Biemont & Brault 1986). Within the described system the transitions be-tween the 59 first levels of Mg i and the ground level of Mg ii have been considered. The detailed structure of the multiplets was ignored and each LS multiplet was considered as a sin-gle term. The fine structure was taken into account only for the 3s3p3P0level (more details in Mishenina et al. 2004).
2.2. Potassium
Our model of the K i atom is based on the model of Bruls et al. (1992). In our implementation we considered in detail all the transitions between the first 20 levels of the K i and the ground level of the K ii. For the level 4p2P we took into account the fine splitting. The other levels were considered as single levels. Fifteen additional levels of K i and 7 levels of K ii were used to allow the conservation of the number of particles. The level energies are taken from Sugar & Corliss (1985). The oscillator strengths of the bound-bound transitions are takenfrom Wiese et al. (1969) as well as Biemont & Grevesse (1973). For the res-onance transitions we used data from Morton (1991). The total number of bound-bound transitions considered in detail is 62.
Photoionization cross-sections from the ground level of potassium were reported by Rahman-Attia et al. (1986). For p-levels we took ionization cross-sections published by Aymar et al. (1976). For 2S, 2D, 2F levels the cross-sections calculated with the help of quantum defect method (Hofsaess, 1979) were used. For the other levels, we used the hydrogen-like approxima-tion. The electron collisional rates were estimated with the help of the Van Regemorter (1962) formula, while Allen’s (1973) for-mula was used for forbidden transitions. The collisional ioniza-tion from the ground level was described using the correspond-ing formula from Sobelman et al. (1981). For the other levels we used Seaton’s (1962) formula. To take into account collisions of potassium atoms with hydrogen atoms we applied the formula of Steenbock & Holweger (1984) with a correcting factor equal to 0.05. A similar correcting factor was used by Zhang et al. (2006). The principal difference between the LTE and NLTE-based abundances is caused by an over-recombination on the first level of the K i atom in the atmospheres of the late-type stars. This leads to an increase of the equivalent widths of the K i 766.5 and 769.9 nm lines, and as a consequence the LTE abundances are overestimated. Detailed discussion of this effect is given in Ivanova & Shymansky (2000).
2.2.1. Fit of the solar spectrum
To verify our adopted atomic models of magnesium and potas-sium we have carried out the computation of the NLTE synthetic profiles of several magnesium and potassium lines. The Solar Flux Atlas of Kurucz (1984) in the visual and infra red range was used for this purpose.
The NLTE profiles have been determined with the help of the modified ”MULTI” code of Carlsson (1986). The modifica-tions are described in Korotin et al. (1999), they include opac-ity sources from ATLAS9 (Kurucz 1992). The Kurucz’s (1996)
model of the solar atmosphere has been used in these computa-tions.
The damping constants have been taken from the Vienna Atomic Line Data Base (VALD, Piskunov et al., 1995). The cor-rection ∆logC6found by Mishenina et al. (2004) has been
ap-plied for the computation of the magnesium lines. The NLTE profiles of the Mg I lines computed with log(Mg/H) = 7.57 agree well with the solar spectrum (see Fig. 1 in good agree-ment with the determinations of Grevesse & Sauval (2000), and of Shimanskaya (2000) who found log(Mg/H)⊙ = 7.58. The potassium lines are also well reproduced by our calculations (see Fig. 2) with a potassium abundance log(K/H)⊙ = 5.11, in good agreement with the value adopted by Zhang et al. (2006), and very close to the meteoritic potassium abundance (Lodders, 2003).
3. Analysis of the star sample
3.1. Sample of stars. Observations and reduction
The sample of stars and the observational data are the same as discussed in Cayrel et al. (2004). The observations were per-formed with the high resolution spectrograph UVES at the VLT (Dekker et al., 2000). The resolving power in the region of the magnesium lines is R ≈ 45, 000 and it is R ≈ 41, 000 in the re-gion of the potassium lines. The S/N ratio is generally ≈ 120/pix with about 5 pixels per resolution element. In this region of the potassium lines, residual fringes limit the precision of the mea-surements and in most of the stars a line with an equivalent width less than 3 mÅ cannot be detected.
The spectra have been reduced using the UVES context (Ballester et al. 2000).
3.2. Atmospheric parameters
The parameters of the atmosphere of the stars Teff, log g, vtand
[Fe/H] are given in Table 1, and are quoted from the LTE analy-ses of Cayrel et al. (2004) and Bonifacio et al. (2007, 2009). An ”m” in the last column of the table means that the atmosphere of the star (giant) has been found ”mixed” with the deep hydrogen burning layer by Spite et al. (2005, 2006a). For the determination of the relative LTE and NLTE abundances, we adopted in this ta-ble the solar values log(Mg/H)⊙ = 7.58 and log(K/H)⊙= 5.12 following Grevesse & Sauval (2000) for a better homogeneity with the previous LTE determinations (Cayrel et al. 2004).
3.3. LTE abundances of K and Mg
As a comparison, we give in Table 1 new abundances of magne-sium and potasmagne-sium computed with the LTE hypothesis. These new determinations have been obtained by fitting the synthetic spectra with the observed profiles.
For the abundance of potassium the result is sometimes slightly different from the value published in Cayrel et al. (2004) because, for example, a different position of the continuum has been adopted.
However, the difference is larger for magnesium. In Cayrel et al. (2004) the equivalent widths of magnesium lines in giants have been often underestimated: the lines are often strong and the wings had been neglected. This error has been corrected in Bonifacio et al. (2009). The correction is negligible for the most magnesium-poor giants, but in in the other (less Mg-poor) gi-ants, the difference is about 0.15 dex.
3.4. NLTE abundances
To compute NLTE profiles of the magnesium and potassium lines, we have used Kurucz’s models (ATLAS9) without over-shooting (Kurucz 1993). We have checked on some typical stars that the use of MARCS models (Gustafsson et al., 2008) as in Cayrel et al. (2004) would not make a significant difference.
The NLTE corrections depend on the effective temperature and gravity of the model, as well as on the element abundance itself. The latter circumstance strongly suggests that the abun-dances must be derived individually for each star using com-plete NLTE computation. The use of published NLTE correc-tions as a function Teff and log g can introduce some errors in
the derived abundances if the abundances are different. For ex-ample in metal-poor stars in the range −2.0 < [Fe/H] < −3.0 the NLTE corrections for the potassium abundance are within the range 0.2-0.5 dex. But in the extremely metal-poor stars ([Fe/H] < −3.0) the potassium line is very weak (the equiva-lent width of the 7699 Å line is always less than 25 mÅ and often less than 10 mÅ); the line is thus formed rather deeply in the atmosphere where collisions are important and finally the NLTE correction at these metallicities is small. As a con-sequence, the use of a uniform NLTE correction (computed by Ivanova & Shymansky for a metallicity of -2.0), has led Cayrel et al. (2004) to underestimate the potassium abundance at very low metallicity. 5528.0 5528.5 5529.0 λ 0.7 0.8 0.9 1.0 RELATIVE FLUX (A) BS 16968-61 5183.0 5183.5 5184.0 λ 0.1 0.2 0.3 0.4 0.5 0.6 0.7 0.8 0.9 1.0 (A) BS 16968-61 5528.0 5528.5 5529.0 λ 0.1 0.2 0.3 0.4 0.5 0.6 0.7 0.8 0.9 1.0 RELATIVE FLUX (A) HD186478 5183.0 5183.5 5184.0 5184.5 λ 0.1 0.2 0.3 0.4 0.5 0.6 0.7 0.8 0.9 1.0 (A) HD186478
Fig. 3. Magnesium. Profile fitting for two metal-poor stars
with different effective temperature, with similar metallicity :[Fe/H] ≈ −2.8. One is a turnoff star (BS 16968-61), the other a giant (HD 186478). The Mg abundance was varied by 0.10 dex (dotted lines).
The profile fitting for two metal-poor stars is displayed in Fig. 3 and 4. The NLTE magnesium and potassium abundances in our program stars are listed in Table 1. In this table, we give also as a comparison the abundance of these elements computed
4 Andrievsky: Relative abundances of light metals in EMP stars
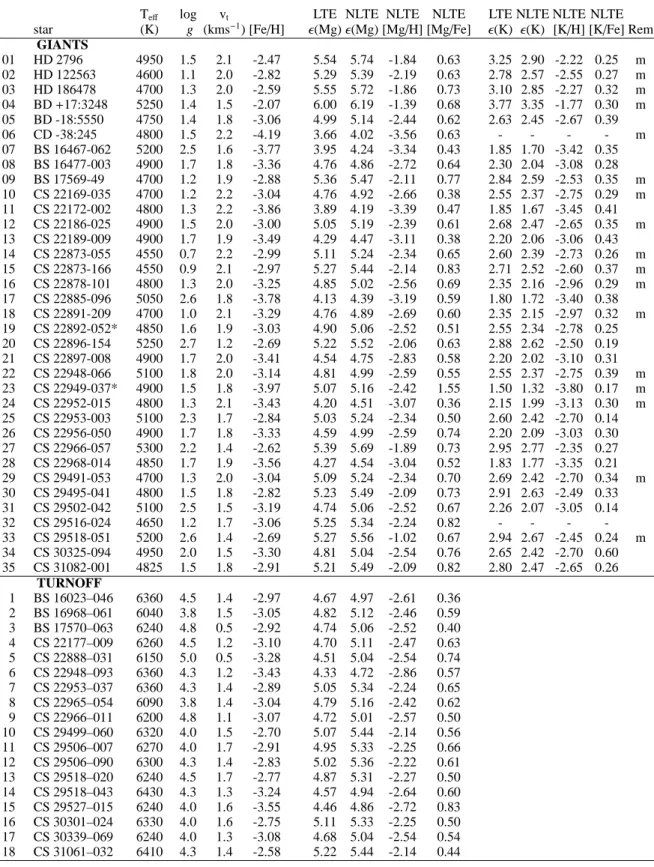
Table 1. Adopted model and potassium abundance for our sample of stars. In the last column the letter m indicates that the giant
has been found “mixed” (see text).
Teff log vt LTE NLTE NLTE NLTE LTE NLTE NLTE NLTE
star (K) g (kms−1) [Fe/H] ǫ(Mg) ǫ(Mg) [Mg/H] [Mg/Fe] ǫ(K) ǫ(K) [K/H] [K/Fe] Rem GIANTS 01 HD 2796 4950 1.5 2.1 -2.47 5.54 5.74 -1.84 0.63 3.25 2.90 -2.22 0.25 m 02 HD 122563 4600 1.1 2.0 -2.82 5.29 5.39 -2.19 0.63 2.78 2.57 -2.55 0.27 m 03 HD 186478 4700 1.3 2.0 -2.59 5.55 5.72 -1.86 0.73 3.10 2.85 -2.27 0.32 m 04 BD +17:3248 5250 1.4 1.5 -2.07 6.00 6.19 -1.39 0.68 3.77 3.35 -1.77 0.30 m 05 BD -18:5550 4750 1.4 1.8 -3.06 4.99 5.14 -2.44 0.62 2.63 2.45 -2.67 0.39 06 CD -38:245 4800 1.5 2.2 -4.19 3.66 4.02 -3.56 0.63 - - - - m 07 BS 16467-062 5200 2.5 1.6 -3.77 3.95 4.24 -3.34 0.43 1.85 1.70 -3.42 0.35 08 BS 16477-003 4900 1.7 1.8 -3.36 4.76 4.86 -2.72 0.64 2.30 2.04 -3.08 0.28 09 BS 17569-49 4700 1.2 1.9 -2.88 5.36 5.47 -2.11 0.77 2.84 2.59 -2.53 0.35 m 10 CS 22169-035 4700 1.2 2.2 -3.04 4.76 4.92 -2.66 0.38 2.55 2.37 -2.75 0.29 m 11 CS 22172-002 4800 1.3 2.2 -3.86 3.89 4.19 -3.39 0.47 1.85 1.67 -3.45 0.41 12 CS 22186-025 4900 1.5 2.0 -3.00 5.05 5.19 -2.39 0.61 2.68 2.47 -2.65 0.35 m 13 CS 22189-009 4900 1.7 1.9 -3.49 4.29 4.47 -3.11 0.38 2.20 2.06 -3.06 0.43 14 CS 22873-055 4550 0.7 2.2 -2.99 5.11 5.24 -2.34 0.65 2.60 2.39 -2.73 0.26 m 15 CS 22873-166 4550 0.9 2.1 -2.97 5.27 5.44 -2.14 0.83 2.71 2.52 -2.60 0.37 m 16 CS 22878-101 4800 1.3 2.0 -3.25 4.85 5.02 -2.56 0.69 2.35 2.16 -2.96 0.29 m 17 CS 22885-096 5050 2.6 1.8 -3.78 4.13 4.39 -3.19 0.59 1.80 1.72 -3.40 0.38 18 CS 22891-209 4700 1.0 2.1 -3.29 4.76 4.89 -2.69 0.60 2.35 2.15 -2.97 0.32 m 19 CS 22892-052* 4850 1.6 1.9 -3.03 4.90 5.06 -2.52 0.51 2.55 2.34 -2.78 0.25 20 CS 22896-154 5250 2.7 1.2 -2.69 5.22 5.52 -2.06 0.63 2.88 2.62 -2.50 0.19 21 CS 22897-008 4900 1.7 2.0 -3.41 4.54 4.75 -2.83 0.58 2.20 2.02 -3.10 0.31 22 CS 22948-066 5100 1.8 2.0 -3.14 4.81 4.99 -2.59 0.55 2.55 2.37 -2.75 0.39 m 23 CS 22949-037* 4900 1.5 1.8 -3.97 5.07 5.16 -2.42 1.55 1.50 1.32 -3.80 0.17 m 24 CS 22952-015 4800 1.3 2.1 -3.43 4.20 4.51 -3.07 0.36 2.15 1.99 -3.13 0.30 m 25 CS 22953-003 5100 2.3 1.7 -2.84 5.03 5.24 -2.34 0.50 2.60 2.42 -2.70 0.14 26 CS 22956-050 4900 1.7 1.8 -3.33 4.59 4.99 -2.59 0.74 2.20 2.09 -3.03 0.30 27 CS 22966-057 5300 2.2 1.4 -2.62 5.39 5.69 -1.89 0.73 2.95 2.77 -2.35 0.27 28 CS 22968-014 4850 1.7 1.9 -3.56 4.27 4.54 -3.04 0.52 1.83 1.77 -3.35 0.21 29 CS 29491-053 4700 1.3 2.0 -3.04 5.09 5.24 -2.34 0.70 2.69 2.42 -2.70 0.34 m 30 CS 29495-041 4800 1.5 1.8 -2.82 5.23 5.49 -2.09 0.73 2.91 2.63 -2.49 0.33 31 CS 29502-042 5100 2.5 1.5 -3.19 4.74 5.06 -2.52 0.67 2.26 2.07 -3.05 0.14 32 CS 29516-024 4650 1.2 1.7 -3.06 5.25 5.34 -2.24 0.82 - - - -33 CS 29518-051 5200 2.6 1.4 -2.69 5.27 5.56 -1.02 0.67 2.94 2.67 -2.45 0.24 m 34 CS 30325-094 4950 2.0 1.5 -3.30 4.81 5.04 -2.54 0.76 2.65 2.42 -2.70 0.60 35 CS 31082-001 4825 1.5 1.8 -2.91 5.21 5.49 -2.09 0.82 2.80 2.47 -2.65 0.26 TURNOFF 1 BS 16023–046 6360 4.5 1.4 -2.97 4.67 4.97 -2.61 0.36 2 BS 16968–061 6040 3.8 1.5 -3.05 4.82 5.12 -2.46 0.59 3 BS 17570–063 6240 4.8 0.5 -2.92 4.74 5.06 -2.52 0.40 4 CS 22177–009 6260 4.5 1.2 -3.10 4.70 5.11 -2.47 0.63 5 CS 22888–031 6150 5.0 0.5 -3.28 4.51 5.04 -2.54 0.74 6 CS 22948–093 6360 4.3 1.2 -3.43 4.33 4.72 -2.86 0.57 7 CS 22953–037 6360 4.3 1.4 -2.89 5.05 5.34 -2.24 0.65 8 CS 22965–054 6090 3.8 1.4 -3.04 4.79 5.16 -2.42 0.62 9 CS 22966–011 6200 4.8 1.1 -3.07 4.72 5.01 -2.57 0.50 10 CS 29499–060 6320 4.0 1.5 -2.70 5.07 5.44 -2.14 0.56 11 CS 29506–007 6270 4.0 1.7 -2.91 4.95 5.33 -2.25 0.66 12 CS 29506–090 6300 4.3 1.4 -2.83 5.02 5.36 -2.22 0.61 13 CS 29518–020 6240 4.5 1.7 -2.77 4.87 5.31 -2.27 0.50 14 CS 29518–043 6430 4.3 1.3 -3.24 4.57 4.94 -2.64 0.60 15 CS 29527–015 6240 4.0 1.6 -3.55 4.46 4.86 -2.72 0.83 16 CS 30301–024 6330 4.0 1.6 -2.75 5.11 5.33 -2.25 0.50 17 CS 30339–069 6240 4.0 1.3 -3.08 4.68 5.04 -2.54 0.54 18 CS 31061–032 6410 4.3 1.4 -2.58 5.22 5.44 -2.14 0.44
* An asterisk after the name of the star means that the star is carbon-rich.
independently with the LTE approximation (and without any correction). The potassium abundance can be computed only in giant stars, the lines are not visible in the turnoff stars.
7698.5 7699.0 7699.5 λ 0.7 0.8 0.9 1.0 RELATIVE FLUX (A) CS 22953-003 7698.5 7699.0 7699.5 λ 0.7 0.8 0.9 1.0 (A) HD 122563
Fig. 4. Potassium. Profile fitting for two metal-poor giants, both
with [Fe/H] ≈ −2.8 but with different effective temperature. The best-fit K abundance was varied by 0.05 dex.
4. Discussion
4.1. Abundance of magnesium and potassium in the early Galaxy
As recalled in Cayrel et al. (2004), Mg is formed during hy-drostatic carbon burning and explosive neon burning, K during explosive oxygen burning; their abundances are therefore related to the importance of both the hydrostatic and explosive phases.
In Fig. 5 we compare the LTE abundances of magnesium in our sample of EMP dwarfs and giants (Bonifacio et al., 2009) with the new NLTE determinations. The carbon-rich and pecu-liar star CS 22949-037 has been discarded.
Fig. 5. [Mg/Fe] vs. [Fe/H] in the early Galaxy. Open circles (red
and blue) stand for ”mixed” and ”unmixed” giants (see Spite et al. 2005, 2006a, 2006b), black filled symbols for turnoff stars.
Fig. 6. [K/Fe] vs. [Fe/H] in the early Galaxy. Open circles (red
and blue) stand for ”mixed” and ”unmixed” giants respectively (see Spite et al. 2005, 2006a). The potassium abundance cannot be measured in the turnoff stars, the lines are too weak.
The trend of the [Mg/Fe] ratio vs. metallicity at low metal-licity is not changed, it remains a plateau. But the scatter of [Mg/Fe] is smaller when NLTE effects are taken into account: 0.13 from NLTE computations and 0.16 from LTE computation. The difference between dwarfs and giants is strongly reduced and is not significant any more. The mean value of [Mg/Fe] in the interval −4 < [Fe/H] < −2.5 is now +0.61dex (it was +0.34 from LTE computations). This value of [Mg/Fe] is now similar to the mean value of [O/Fe] previously deduced (Cayrel et al. 2004) from the forbidden oxygen line (not sensitive to NLTE effects).
For the determination of the mean value of the ratios [Mg/Fe], their trend and their scatter around the trend, the carbon-rich star CS 22949-037 (showing also strong abundance anomalies of light elements) has been discarded. The star has been as well excluded from all computations and/or figures re-lated to Mg abundances.
When NLTE is taken into account, the values of the abun-dance ratios [K/Fe] are slightly decreased. The scatter of [K/Fe] is also slightly smaller. The mean value of [K/Fe] in the interval −4 < [Fe/H] < −2.5 is about +0.33 dex. This value is very close to the value found by Takeda et al. (2009). We have checked that the small differences between the two determinations reflect the fact that we have determined the potassium abundance by a direct fit of the profiles whereas Takeda et al. have used the equivalent widths given in Cayrel et al. (2004).
We have estimated star by star the error on [K/Fe] in our sam-ple of stars. This error is dominated by the measurement error (equivalent width or profile) and it increases significantly when the metallicity decreases: at low metallicity the potassium lines
6 Andrievsky: Relative abundances of light metals in EMP stars
becomes very weak (less than 10 mÅ and often less than 5 mÅ) in a region where the S/N ratio is only about 100 and where the position of the continuum is not very precise because of residual fringes. In consequence, as shown in our Fig. 6 we do not con-firm the suggestion of Takeda et al. (2009) of ”a marginal sign of decline toward a further lower [Fe/H]”.
It is interesting to note that the K-rich star CS 30325-94 (LTE, see Cayrel et al. 2004) remains K-rich (and with a small error) in the NLTE analysis (see Fig. 6) and it is also Sc-rich. In the stellar sample of Zhang & Zhao (2005), the most potassium-rich star HD 195636 (with [Fe/H]=–3.3, and [K/Fe]=+1.35) is also very scandium-rich. The production of these elements is not unanimously ascribed to definite sites; there could be a link between the formation processes of these elements in massive stars. However, the scandium-rich stars are not always potassium-rich (see for example CS 22885-096 in our sample).
4.2. Abundances of O and light metals relative to Mg in the early Galaxy
Oxygen:
The magnesium abundances listed in Table 1 can be used as a normalization factor for other elements. It is interesting to com-pute the ratio [O/Mg] using this new NLTE value of the mag-nesium abundance : since the abundance of oxygen has been determined from the forbidden oxygen line, is free from NLTE effects. The corresponding plots are shown in Fig. 7.
Sodium:
As found in Andrievsky et al. (2007), the ”mixed” stars are often enriched in sodium. This reflects an internal mixing inside these giant stars. Therefore the mixed stars should not be used to determine the ratio [Na/Mg] in the early Galaxy. Note that the star CS 22952-15 (a mixed star with [Fe/H]=–3.43) is very sodium-rich, but its ratio [Al/Fe] is normal (see Andrievsky et al., 2008). However its ratio [Al/Mg] is also rather high. The explanation is that this mixed star is Na-rich and Mg-poor.
Mean value and scatter:
Since the abundances of O, Na, Al and K relative to Mg are rather flat in their central part, we can define a mean value in this central interval, say −3.6 < [Fe/H] < −2.5. The mean values of these flat parts are :
[O/Mg] ≈ 0.1, [Na/Mg] ≈ −0.8, [Al/Mg] ≈ −0.7 and [K/Mg] ≈ −0.3.
For the same sample of stars in the same interval of metal-licity (−3.6 < [Fe/H] < −2.5), the scatter around the mean can also be computed, the values are :
σ[O/Fe] = 0.18 but σ[O/Mg] = 0.20, σ[Na/Fe] = 0.12 but
σ[Na/Mg] = 0.14, σ[Al/Fe] = 0.11, σ[Al/Mg]= 0.11, σ[K/Fe]= 0.09
but σ[K/Mg]= 0.15.
The large scatter found for O, is due to the reduced number of measurements.
The values of the scatter obtained for the NLTE abundance ratios are lower than for the LTE abundances. However, it ap-pears that, as already observed in LTE (Cayrel et al., 2004), the scatter of the abundance ratios is larger when Mg is chosen as the reference element instead of Fe. Al is an exception.
This fact is surprising: it would have been expected that the abundances of Na and K produced by (mainly hydrostatic) nu-clear processes (similar to those producing Mg) would bear more resemblance to the Mg abundance than to the Fe abundance (produced quite differently); the scatter of [Na/Mg] and [K/Mg] would then be smaller than the scatter of [Na/Fe] and [K/Fe], but the observations show the contrary.
Fig. 7. Abundance of O, Na, Al, and K relative to Mg in the
early Galaxy. The abundances of all these elements have been computed taking into account the NLTE effect. Since the mea-sured oxygen lines are forbidden lines they are free from NLTE effects.
4.3. Comparison to the predictions of the ejecta of supernovae
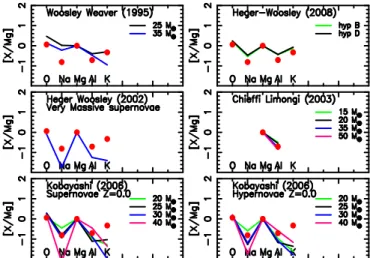
It is interesting to compare the abundance ratios [O/Mg], [Na/Mg], [Al/Mg] and [K/Mg] to the predictions of the ejecta of metal-poor supernovae or hypernovae. In Fig. 8 the observed ratios are compared to the predictions of Woosley & Weaver (1995), of Heger & Woosley (2008, 2002), of Chieffi & Limongi (2003), and Kobayashi et al. for supernovae and hypernovae (Kobayashi et al., 2006).
Fig. 8. Comparison of the new abundance ratios to the
predic-tions of supernovae or hypernovae.
The quantity of potassium ejected is generally underesti-mated by the models of supernovae. The best agreement is obtained by the predictions of Heger & Woosley (2008) with the hypotheses B and D (see the paper), although the abun-dance of sodium and aluminum are in this case a little overes-timated. The ratio Al/Mg is also well represented in the model of Chieffi & Limongi (2003). Unfortunately there are no pre-dictions for the abundance of O, Na and K in this model. The models of Kobayashi et al. (2006) (supernovae and hypernovae with Z=0.0) seem also able to represent the relative abundances
of O, Na, Mg and Al, but here again the production of potassium is strongly underestimated.
4.4. Variation of [O/Mg], [Na/Mg], [Al/Mg] and [K/Mg] in the Galaxy
In Fig. 9 we present the variation of [O/Mg], [Na/Mg], [Al/Mg] and [K/Mg] in the Galaxy as a function of [Mg/H] where Na, Al, Mg and K have been computed taking into account the NLTE effects (the oxygen abundance deduced from forbidden lines is not affected by departure from LTE).
As already noted, [Mg/H] should be a better index of time, since magnesium is only formed in massive SN II with a short lifetime, unlike iron formed in SN II or SN I of various masses.
We have added in the figure the determinations of Gehren et al. (2004, 2006), of Mashonkina et al. (2008), and Zhang et al. (2006) in the Galactic disk and halo. All these determinations have been done including the NLTE effects on the line profiles.
As seen in Fig. 9, the abundance ratios [Na/Mg], [Al/Mg] and [K/Mg] in the Galaxy decrease with [Mg/H] from [Mg/H]= 0 to [Mg/H]=–2, then are almost constant between [Mg/H]=– 2 and [Mg/H]=–2.8, and finally, at lower metallicity, the ratios [Na/Mg], [Al/Mg], and [K/Mg] and maybe also [O/Mg] seem to increase when [Mg/H] decreases. (The error on [O/Mg] in the two most magnesium-poor stars is large and thus this tendency is not firmly established for oxygen.)
In Fig. 9 the evolutions of the abundance ratios [O/Mg], [Na/Mg], [Al/Mg] and [K/Mg] in the Galaxy are also drawn, following Kobayashi et al. (2006), Franc¸ois et al. (2004) and for Na and Al, Goswami & Prantzos (2000).
Kobayashi et al. use new nucleosynthesis yields calculated, from Z = 0 to Z = Z⊙, for supernovae and hypernovae. With these new yields, the general trend of O, Na and Al is rather well reproduced, but not the behaviour of potassium. The under-production of potassium in the models of supernovae has alreay been pointed out by Samland (1998). To solve this problem as well as the underproduction of Si and Sc, Umeda & Nomoto (2005) have proposed to introduce a model of supernova where the density is assumed to be reduced (during the explosive burn-ing) to increase the freezeout.
The predictions of Franc¸ois et al. (2004) are based on the yields of Woosley & Weaver (1995). For a better fit of the ob-servations they had to systematically increase the production of K by a factor of 8. In the computations of Kobayashi et al. (2006) the ratio [O/Mg] remains stable at very low metalliciticty. Contrary to that, Fanc¸ois et al. (2004) predict an increase of [O/Mg] when the metallicity decreases for [Mg/H] < −2.5. The measurement of [O/Mg] in the two most metal-poor stars in the Fig. 9 is unfortunately too uncertain (one is clearly an upper limit) to enable to choose one of the two models.
For Na and Al we give the predictions of Goswami & Prantzos (2000), and of Cescutti et al. (private communication). These predictions are, as in Franc¸ois et al. (2004), based on the yields of Woosley & Weaver (1995) but the yields of low mass and intermediate mass stars have been adjusted. Like Kobayashi et al. (2006), they predict a decrease of [Na/Mg] and [Al/Mg] when [Mg/H] decreases, but the agreement with the observations is better when the model of Kobayashi et al. is adopted.
5. Conclusion
The spectra of the EMP stars, (programme First Stars) analysed previously (Cayrel et al. 2004) in LTE have been reanalysed here for Mg and K, taking into account the departures of LTE.
Fig. 9. Variation of [O/Mg], [Na/Mg], [Al/Mg], [K/Mg] vs.
[Mg/H] in the Galaxy. The red and blue open circles repre-sent our measurements for mixed and unmixed giants (see the electronic version of A&A for a color version of this figure), the large black dots represent the turnoff stars of our sample and the small black dots are from Gehren et al. (2004, 2006), Mashonkina et al. (2008), and Zhang et al. (2006), for the disk and halo stars. The thin solid line is the prediction of Franc¸ois et al. (2004) for O and K and of Cescutti et al. (private communica-tion) for Na and Mg. The dashed dotted lines are the predicitions of Goswami & Prantzos (2000) for Na and Al. These predictions are based (with occasional adjustments) on the models of super-novae ejecta of Woosley & Weaver (1995). The thick solid lines are the predictions of Kobayashi et al. (2006) based (without ad-justments) on new models of supernovae and hypernovae.
Abundances of Mg and K:
The NLTE correction for magnesium is in accord with the correction computed by Gehren and collaborators (2004, 2006) in less metal-poor stars. The Mg abundance in the giants is raised by a factor of about 2 and the NLTE abundance of Mg is the
8 Andrievsky: Relative abundances of light metals in EMP stars
same in giants and in dwarfs. The O/Mg ratio is nearly solar (the precision of the O abundance is however rather low).
The NLTE abundance of potassium, computed by adjuste-ment of observed and computed profiles, has been compared to the work of Takeda et al. (2009). The agreement is generally very good. When differences do occur, they arise from the fact that Takeda et al. used the equivalent widths given in Cayrel et al. (2004) while we fitted the computed profiles directly to the ob-served spectra. (There are sometimes slight differences in the po-sition of the continuum.) The NLTE correction for the potassium lines is smaller in the more metal-poor stars, (as already noted by Takeda et al., 2009). In Cayrel et al. (2004), the potassium abundance had been roughly corrected for NLTE (by applying uniformly a correction of –0.35dex) : the potassium abundances in this paper have therefore been underestimated (especially for those stars that are strongly metal-poor).
Scatters:
The scatters of [Mg/Fe] and [K/Fe] are found smaller in the present work, where departures from LTE are taken into account. The NLTE abundance trends are therefore better defined than the previous LTE trends.
The [Mg/H] should be a better reference element than Fe, but even whith the new NLTE determinations, the scatter of [O/Mg], [Na/Mg] and [K/Mg] remains (slightly) larger than the scatter of [O/Fe], [Na/Fe] and [K/Fe]. This fact is surprising, iron being formed in processes quite different from those (mainly hydro-static) supposed to be forming O, Mg, Na and K. An exception is Al : the scatter is the same for [Al/Mg] and [Al/Fe].
Trends:
The shapes of the new trends (versus both Fe or Mg) are slightly different from the LTE trends found previously (Cayrel et al., 2004). For example, the slope of the [K/Fe] ratio ver-sus [Fe/H], which was slightly positive, becomes slightly neg-ative (Fig. 6). Also, the NLTE values of [Na/Mg], [Al/Mg] and [K/Mg] show at low metallicity (for [Mg/H] < −2.5) an increase when [Mg/H] decreases.
Comparison with models:
There is some agreement with the models of galactic evo-lution. The trends of [O/Mg], [Na/Mg], [Al/Mg] with [Mg/H] in the Galaxy are rather well represented by the model of Kobayashi et al. (2006). However their model underestimates the production of potassium.
Finally the precision currently reached in the measurement of high resolution high signal to noise spectra, obviously de-serves careful analyses, using accurate atomic parameters, NLTE computations, and even, in a near future, 3D stellar atmosphere models.
Acknowledgements. SMA kindly acknowledges the support and hospitality of
the Paris-Meudon Observatory. P.B. acknowledges financial support from EU contract MEXT-CT-2004-014265(CIFIST). M. S., R. C., F. S., P. B., V. H., P. F. acknowledge the support of CNRS (PNG and PNPS).
References
Allen C.W. 1973, Astrophysical Quantities (London: Athlone Press)
Andrievsky S.M., Spite M., Korotin S.A., Spite F., Bonifacio P., Cayrel R., Hill V., Franc¸ois P. 2007, A&A 464, 1081
Andrievsky S.M., Spite M., Korotin S.A., Spite F., Bonifacio P., Cayrel R., Hill V., Franc¸ois P. 2008, A&A 481, 481
Aymar M., Luc-Koenig E., Combet Farnoux F. 1976, JPhB 9, 1279
Ballester P., Modigliani A., Boitiquin O., Cristiani S., Hanuschik R. et al. 2000, ESO Messenger 101, 31
Biemont E., Grevesse N. 1973, ADNDT 12, 217 Biemont E., Brault J.W. 1986, Phys. Scr., 34, 751
Bonifacio, P., Molaro, P., Sivarani, T., et al. 2007, A&A, 462, 851 (“First Stars
VII”)
Bonifacio, P., Spite M., Cayrel R., Hill V., et al. 2009 accepted to A&A(arXiv 0903.4174).
Bruls J.H., Rutten R.J., Shchukina N. 1992, A&A 265, 237 Carlsson M. 1986, Uppsala Obs. Rep. 33
Cayrel R., Depagne E., Spite M., Hill V., Spite F., Franc¸ois P., Plez B., Beers T.C., Primas F., Andersen J., Barbuy B., Bonifacio P., Molaro P., Nordstr¨om B. 2004, A&A 416, 1117 (“First Stars V”)
Chieffi A., Limongi M. 2003 in the ESO astrophysics symposia: From Twilight to Highlight: The physics of Supernovae, ed. W. Hillebrandt & B. Leibundgut, p. 367
Chen Y.Q., Nissen P.E., Zhao G., Zhang H.W., Benoni T. 2000, A&AS 141, 491 Dekker H., D’Odorico S., Kaufer A., et al. 2000 in Optical and IR Telescopes Instrumentation and Detectors, eds I. Masanori & A.F. Morwood Proc. SPIE 4008, 534
Drawin H.-W. 1961, ZPhy 164, 513 Drawin H.-W. 1968, ZPhy 211, 404
Franc¸ois P, Matteucci F., Cayrel R., Spite M., Spite F., Chiappini C. 2004, A&A 421, 613
Gehren T., Liang Y.C., Shi J.R.et al. 2004, A&A 413, 1045 Gehren T., Shi J.R., Zhang H.W. et al. 2006, A&A 451, 1065 Goswami A., Prantzos N. 2000, A&A 359, 191
Gratton R.G., Sneden C. 1987, A&A 178, 179
Grevesse N., Sauval A. J., 2000, in Origin of Elements in the Solar System, Implications of Post-1957 Observations, Proceedings of the International Symposium., Edited by O. Manuel, Boston/Dordrecht: Kluwer Academic/Plenum Publishers, p.261
Gustafsson B., Edvardsson B., Eriksson K., Jørgensen U. G., Nordlund A., Plez B. 2008, A&A 486, 951
Heger A., Woosley S.E. 2002, ApJ 567, 532
Heger A., Woosley S.E. 2008, arXiv 0803.3161 (submitted to ApJ) Hofsaess D. 1979, ADNDT 24, 285
Ivanova D.V., Shymansky V.V. 2000, ARep 44, 376
Kobayashi C., Tsujimoto T., Nomoto K., Hachisu I., and Kato M. 1998, ApJ 503,L155
Kobayashi C., Umeda H., Nomoto K., Tominaga N., and Ohkubo T. 2006, ApJ 653,1145
Korotin S.A., Andrievsky S.M., Luck R.E. 1999, A&A 351, 168
Kurucz R.L. 1992, The Stellar Population of Galaxies, ed. B. Barbuy, A. Renzini, IAU Symp. 149, 225
Kurucz, R. 1993, ATLAS9 Stellar atmospher Programsand 2km/s grid CD-ROM No. 13 Cambridge, Mass.: SAO, 1993, 13
Kurucz R.L. 1996, Model Atmospheres and Spectrum Synthesis, ed. S.J. Adelman, F. Kupka, W.W. Weiss, San Francisco, ASP Conf. Ser. 108, 2 Kurucz R.L., Furenlid I., Brault J., Testerman L., 1984, Solar Flux Atlas from
296 to 1300 nm, New Mexico, National Solar Observatory Lodders, K. 2003, ApJ, 591, 1220
Martin W.C., Zalubas, R. 1980, J. Phys. Chem. Ref. Data, 9, 1
Mashonkina L., Zhao G., Gehren T., Aoki W., Bergemann M., Noguchi K., Shi J. R., Takada-Hidai M., Zhang H. W. 2008, A&A 478, 529
Matteucci F. 2008, ArXiv 0804.1492v1 Miles B.M., Wise W.L. 1969, ADNDT 1, 1
Mishenina T.V., Soubiran C., Kovtyukh V.V., Korotin S.A. 2004, A&A 418, 551 Morton D.C. 1991 Ap.J.Suppl. 77, 119
Nomoto K., Hashimoto M., Tsujimoto T., Thielemann F.-K., Kishimoto N., Kubo Y., Nakasato N. 1997, Nucl. Phys. A, 616, 79
Peart B., Underwood J.R.A., Dolder K. 1989, JPhB 22, 1679
Piskunov N.E., Kupka F., Ryabchikova T.A., Weiss W.W., Jeffery C.S. 1995, A&AS 112, 525-535
Rahman-Attia, M., Jaouen, M., Laplanche, G., Rachman, A. 1986 J.Phys.B 19, 897
Rutten R.J. 1978, SoPh 56, 237 Samland M. 1998, ApJ 496, 155
Shigeyama T., Tsujimoto T. 1998, ApJ 507, L135
Shimanskaya N. N., Mashonkina L. I., Sakhibullin N. A. 2000, ARep, 44, 530 Schoening T., Butler K. 1998, A&AS 128, 581
Seaton M.J. 1962, Proc. Phys. Soc. 79, 1105
Sobelman I.I., Vainshtein L.A., Yukov E. 1981, Excitation of Atoms and Broadening of Spectral Lines, Springer Ser. in Chem. Phys., Berlin, Springer
Spite M., Cayrel R., Plez B., et al. 2005, A&A 430, 655 (“First Stars VI”) Spite M., Cayrel R., Hill V., et al. 2006, A&A 455, 291 (“First Stars IX”) Spite M., Cayrel R., Spite F., et al. 2006, in : Chemical abundances and mixing
in stars in the Milky Way and its satellites, Proc. ESO-Arcetri Workshop, eds. S. Randich & L. Pasquini, p. 200, Springer
Steenbock W., Holweger H. 1984, A&A 130, 319 Sugar J., Corliss C.H. 1985, J.PhChRD, 14-2
Takeda Y., Kaneko H., Matsumoto N., Oshino S., Ito H., Shibuya T. 2009, in press at PASJ (arXiv0902.4504)
Takeda Y., Zhao G., Chen Y.Q., Qiu H.M., Takada-Hidai M. 2002, PASJ 54, 275 Timmes F.X., Woosley S.E., Weaver T.A. 1995, ApJS 98, 617
Truran J.W., Arnett W.D. 1970, ApJ 160, 181 Umeda H., Nomoto K. 2005, ApJ 619, 427 van Regemorter H. 1962, ApJ 136, 906 Warner B. 1968, MNRAS 139, 115
Wise W.L., Martin G.A., NSRDS-NBS 68, P.II
Wiese W.L., Smith M.W., Miles B.M. 1969, NSRDS-NBS 22 !!! Woosley S. E., Weaver T. A. 1995, ApJS, 101, 181
Zhang H.W., Gehren T., Butler K., Shi J.R., Zhao G. 2006, A&A 457, 645 Zhang H.W., Zhao G. 2005, MNRAS 364, 712
![Fig. 3. Magnesium. Profile fitting for two metal-poor stars with different effective temperature, with similar metallicity :[Fe/H] ≈ −2.8](https://thumb-eu.123doks.com/thumbv2/123doknet/13262959.396874/4.892.468.844.539.926/magnesium-profile-fitting-different-effective-temperature-similar-metallicity.webp)
![Fig. 6. [K/Fe] vs. [Fe/H] in the early Galaxy. Open circles (red and blue) stand for ”mixed” and ”unmixed” giants respectively (see Spite et al](https://thumb-eu.123doks.com/thumbv2/123doknet/13262959.396874/6.892.62.447.601.1033/early-galaxy-open-circles-unmixed-giants-respectively-spite.webp)
![Fig. 9. Variation of [O/Mg], [Na/Mg], [Al/Mg], [K/Mg] vs.](https://thumb-eu.123doks.com/thumbv2/123doknet/13262959.396874/8.892.498.804.81.736/fig-variation-mg-na-mg-al-mg-mg.webp)
