HAL Id: halshs-00270290
https://halshs.archives-ouvertes.fr/halshs-00270290
Submitted on 4 Apr 2008
HAL is a multi-disciplinary open access archive for the deposit and dissemination of sci-entific research documents, whether they are pub-lished or not. The documents may come from
L’archive ouverte pluridisciplinaire HAL, est destinée au dépôt et à la diffusion de documents scientifiques de niveau recherche, publiés ou non, émanant des établissements d’enseignement et de
Inequality and Social Security Reforms
Jean-Olivier Hairault, François Langot
To cite this version:
Jean-Olivier Hairault, François Langot. Inequality and Social Security Reforms. Journal of Economic Dynamics and Control, Elsevier, 2008, 32 (2), pp.386-410. �10.1016/j.jedc.2007.01.033�. �halshs-00270290�
Inequality and Social Security Reforms
Jean-Olivier Hairault
∗†Fran¸cois Langot
Paris School of Economics (PSE) Cepremap, PSE-Jourdan & Paris 1 Panth´eon-Sorbonne University & GAINS, U. du Maine
Abstract
This paper develops a quantitative Markovian overlapping gener-ations model with altruistic individuals and incomplete financial mar-kets in order to analyze the long-run distributional implications of two hypothetical public social security policy changes, made in response to impending future demographic shifts. The two policy changes consid-ered are first, raising the tax rate while keeping the replacement rate constant and second, keeping the tax rate constant while lowering the replacement rate. Whereas this latter policy is detrimental to the rel-ative situation of the retirees, the huge financial heterogeneity in the first scenario explains why the increase in the proportional labor tax is relatively badly absorbed by low-productivity workers, leading to an increase in welfare inequality. We show that the very popular idea that a more funded system would ineluctably lead to more inequali-ties in well-being can be justified only by focusing on the inequality of positions in case of general equilibrium.
Keywords: Inequality, social security reform, idiosyncratic uncer-tainty, incomplete markets, altruism.
JEL classification: D31, E62, H31
∗Address: Centre d’Economie de la Sorbonne, 106, boulevard de l’Hˆopital, 75013 Paris,
France. e–mail: [email protected].
†The authors acknowledge financial support from the French Ministry for Economics.
We benefited from fruitful discussions with P.Y. H´enin and M. Juillard. We thank seminar participants at the SED meeting (New-York, 2002), T2M (Orl´eans, 2004), Fourgeaud seminar (Paris, 2003) and the CREST seminar (Paris, 2003). We also thank P.N. Ireland for his helpful comments as Editor. Errors and omissions are ours.
1
Introduction
Demographic changes across the developed world will put strain on pay-as-you-go (PAYG) pension systems. This has renewed the political debate on funded or unfunded schemes as the optimal system. On theoretical grounds, it is well-known that in dynamically efficient economies, funded pension sys-tems, where individuals accumulate their own fund, should be favored. Be-yond the empirical relevance of this situation, there is, however, generally no Pareto improving way of making a transition from an unfunded system to a funded one. This creates some scepticism about the practicability of such a reform. Moreover, PAYG systems redistribute income not only across generations, but also within generations as the benefits accruing to an indi-vidual are not proportional to the taxes he pays. Under incomplete financial markets, they can then provide risk sharing for risk averse agents submitted to labor earnings uncertainty. All these arguments explain why the debate is far from closed on efficiency grounds despite the huge literature devoted to this question1.
Beyond the efficiency question, it appears that the degree of inequality implied by the different pension systems is at the heart of the public debate. If the PAYG system has received so much support, it is because it is consid-ered as inequality-reducing, relative to a more funded system. This explains why proposals for social security reforms also attempt to address the issue of inequality in addition to the solvency issue. For instance, Huggett and Ventura (1999) focus on the distributional effects of social security reforms2,
each under PAYG financing and they show that eliminating all redistributive schemes benefits agents with high abilities at birth at the expense of agents with low abilities. Domeij and Klein (2002) show that PAYG systems may lead to more inequality of wealth. Fuster (1999) emphasizes that taking al-truism into account amplifies this situation. In an altruistic model, only rich individuals save for bequests and the intergenerational transfers organized by the social security system can lead to a less egalitarian wealth distribution.
This paper develops a quantitative overlapping generations model with altruistic individuals and incomplete financial markets that is useful for ana-lyzing the long-run distributional implications of potential reforms to social security arrangements in response to demographic changes. We quantify the
1
See, for instance, Imrohoroglu, Imrohoroglu, and Joines (1999), Fuster (1999), Conesa and Krueger (1999), Storesletten, Telmer, and Yaron (1999) or Fuster, Imrohoroglu, and Imrohoroglu (2003).
2
They investigate social security reforms with a two-tier structure. The first tier is a defined-contribution pension scheme, whereas the second tier guaranties a minimum basic income in retirement.
inequality implications of different policy experiments designed to cope with the increase in the support ratio of retirees to workers, driven by underlying changes in fertility and life expectancy. We consider two scenarios, both un-der PAYG financing: firstly an increase in the labor tax rate with a constant replacement rate, and secondly, a lowering of the latter with unchanged la-bor tax rate. For comparing these two reforms, we focus on consumption inequality and show the conclusions differ from an analysis based on wealth inequality. We will mention wealth and income inequality only insofar as they allow us to understand the former. Our approach of inequality is two-fold. We firstly adopt a cross-section approach to inequality that we call inequality of position. Note that this is the way empirical studies evaluate the degree of inequality. This latter will be measured by means of the inter-decile ratio and by the Gini index, computed on the stationary distribution. However these measures are not informative about the intertemporal welfare hetero-geneity which may be considered as a more relevant measure of inequality. Hence, we secondly analyze the inequality of lifetime consumption, focusing on what we call the inequality of perspectives.
Does a PAYG scheme reducing the rate of replacement naturally lead to more inequality? The redistributive effects of the PAYG system are auto-matically lowered by reducing the share of the state pension which embodies redistribution mechanisms. Moreover, individual accumulation is not oblig-atory, escaping from the guardian principle of the PAYG system. Finally, as noted above, actuarially-fair annuity contracts are not available, whereas the PAYG system insures agents against the risk of death. However, the more heterogenous asset distribution in a generous PAYG system could explain why the increase in the proportional labor tax may be absorbed differently by agents, leading to an increase in welfare inequality. Wealth heterogeneity and liquidity constraints may magnify the welfare inequality in a PAYG sys-tem. Our objective in this paper is to give a quantitative assessment on the relative importance of these opposite effects.
As our paper focuses on the inequalities implied by social security reform, our model must be able to account for the observed inequalities. This is why we take into account altruism emphasized by Fuster (1999) and De Nardi (2004) as a key dimension of inequalities. However, we depart from Fuster (1999) by introducing two important features of existing economies which could have important quantitative distributive implications when social se-curity reforms due to demographic changes are considered. Firstly we escape from the extreme altruism vision underlying the dynastic framework consid-ered by Fuster (1999): we aim at calibrating the degree of altruism consistent with observed bequest behavior. We adopt a Markovian representation along the lines of Castaneda, Diaz-Gimenez, and Rios-Rull (2003) by introducing
constant probabilities of transition into the different life-cycle stages. This framework allows us to take into account altruism in a more detailed and realistic way than in the traditional overlapping generation model3 and it
is flexible enough to depart from the dynastic case. Secondly, we consider that retirees face an uncertain time of death in an environment where there are borrowing constraints and market failures in the private provision of annuities. Taking into account this risk is important for any distributive implication comparison between PAYG and a more funded system. On the other hand, labor supply is assumed to be inelastic. Consistently to recent empirical studies on European countries (Altonji and Oldham (2003) and Alesina, Glaeser, and Sacerdote (2005)), the labor intensive margin does not seem to be significantly sensitive to taxes. The vacation laws and more gen-erally the labor market institutions appear as a much better candidate to explain the observed European heterogeneity in terms of individual working hours. It would be a crucial point of departure from the US economy that any quantitative investigations on Social Security reforms must take into account.
The quantitative strategy is to first calibrate the model to the 1990s French economy for the baseline calibration. Secondly, the demographic pa-rameters as well as the policy papa-rameters are re-calibrated to capture the expected demographic changes in 2040 and the resulting social security pol-icy adjustment. We first study the effect of pension reforms on consumption inequality without allowing price adjustment, before turning to general equi-librium. This is both for didactic reasons, because it isolates the importance of factor prices adjustment, and because empirically this question remains open. The French economy is generally considered to be a small open econ-omy. But, as most developed countries face the same demographic expec-tations, it is difficult to consider the international interest rate as constant. In a context of financial globalization, the different demographic processes in other world areas definitely leave open the question of the expected evo-lution of the international interest rate. One way to deal with this question is to build a world overlapping generations general equilibrium model taking into account the different demographic dynamics (see for instance Ingenue (2002)). However, it is then difficult to present a detailed and informative analysis of the pension reforms implications on inequality. This is why we prefer to present both the partial equilibrium and the general equilibrium outcomes in a coherent framework calibrated on the French economy.
We show that each adjustment of the social security system has its own drawbacks. Asset accumulation should be partly obligatory and based on
3
actuarially-fair annuity contracts. PAYG systems should introduce an age-dependent labor tax, taking into account the efficiency rise during the work-ing life-time (Hubbard and Judd (1987)). The inequality of position criterion particularly reveals the dramatic implications of the risk embodied in a more funded system for retirees who outlive their expected time of death, what-ever the factor price adjustment hypothesis considered. Reforms leaving the replacement rate unchanged could also lead to more inequality, due to the presence of liquidity constrained agents. The scale of this effect crucially de-pends on the intensity of price adjustments: it declines with the increase of wages following the decrease of the equilibrium interest rate due to the aging of the population. We also show that adopting an inequality of perspectives criterion is another way to temper the bias in favor of PAYG system when inequality is put forward. To sum up, a more funded pension system does not necessarily lead to more inequalities if the price adjustments are weak or if an inequality of perspectives approach is favored.
In the first section, the model is presented. Secondly, after calibrating it, we check whether our setup is able to replicate some aggregate features and the main distributional facts of the French economy. In the last section, we then simulate different policy experiments designed to cope with the aging of the population.
2
The model
The model analyzed in this section is a modified version of the stochastic neoclassical growth model with uninsured idiosyncratic risk and no aggre-gate uncertainty. Financial markets are incomplete. Beyond the heterogene-ity arising from uninsurable shock to individual employment opportunities, as in Aiyagari (1994), life cycle features are also considered. The model em-bodies six age groups and stochastic aging (Castaneda, Diaz-Gimenez, and Rios-Rull (2003)), where agents are altruistic to a degree. The first three age groups correspond to working life with different average efficiency labor units. The last three age groups correspond to retirement life with differ-ent mortality rates. The agdiffer-ents face idiosyncratic shocks to efficiency labor units in working ages and mortality in retirement. Upon death, individuals are replaced by other individuals of the same dynasty and are imperfectly altruistic towards them. Individuals belonging to the same dynasty do not overlap. The retirement income consists of the return from privately accu-mulated assets and social security income.
2.1
Population dynamics and employment
opportuni-ties
In this section, we define the exogenous stochastic variables of the model, namely the age of the individuals and their employment opportunities. 2.1.1 Population dynamics
At each period, some individuals are born and some individuals die. We assume that the measure of the newly-born is growing at a rate of n. They are born as workers. With a certain probability, they can retire. Upon retirement, they can die, again with a certain probability.
In order to take into account a typical wage life-cycle profile, we assume that the worker population can be divided into three classes of age, the young, the experienced and the old workers respectively denoted C1, C2 and C3. As a worker accumulates experience during his life-cycle, we assume that the efficiency of the labor input grows with the age of the agents. Thus, when a young worker becomes an experienced worker his efficiency is multiplied by 1 + x1. When an experienced worker becomes an old worker, his efficiency is
multiplied by 1 +x2, with x1 < x2. Given the concentration of the retirement
age, only old workers may become retired.
Each individual is born as a young worker. The probability of remaining a young (experienced) worker in the next period is p11(p22). Conversely, the
probability of becoming an experienced (old) worker is 1 − p11 ( 1 − p22).
Conditional on being an old worker in the current period, the probability of retiring is 1 − p33. We also consider three classes of retirement in order to
take into account the increasing rate of mortality with age. In the first class of retirement (C4), an individual cannot die. With a probability 1 − p44, the
young retiree is a middle-aged retiree. This latter class of retirees (C5) has a positive probability of dying p51. These individuals can also be old retirees
in the next period with a probability 1 − p55− p51. Retirees of the last class
of age (C6) have a probability of surviving to the next period given by p66.
We will denote by ξ the stochastic age variable which is assumed to follow
The matrix ΠE governing the age markov-process is given by: t + 1 t C1 C2 C3 C4 C5 C6 C1 p11 1 − p11 0 0 0 0 C2 0 p22 1 − p22 0 0 0 C3 0 0 p33 1 − p33 0 0 C4 0 0 0 p44 1 − p44 0 C5 p51 0 0 0 p55 1 − p55− p51 C6 1 − p66 0 0 0 0 p66 Let NCi
t , for Ci = C1, ..., C6, the number of people in each cohort. In
order to get a stationary growth rate of the population and a constant relative weight of the cohorts, the population inflow4 is fixed each period so that the
young workforce grows at the rate n. The sub-population dynamics is then given by: NC1 t+1 = (1 + n)NtC1 (1) Nt+1C2 = (1 − p11)NtC1 + p22NtC2 (2) Nt+1C3 = (1 − p22)NtC2 + p33NtC3 (3) Nt+1C4 = (1 − p33)NtC3 + p44NtC4 (4) Nt+1C5 = (1 − p44)NtC4 + p55N C5 t (5) Nt+1C6 = (1 − p55− p51)NtC5+ p66N C6 t (6)
At stationary equilibrium, equations (1)-(6) imply that: NC2 NC1 = 1 − p11 1 + n − p22 NC3 NC1 = 1 − p22 1 + n − p33 NC4 NC1 = 1 − p33 1 + n − p44 NC5 NC1 = 1 − p44 1 + n − p55 NC6 NC1 = 1 − p55− p51 1 + n − p66
Since all these ratio are fixed, all the cohorts grow at the rate n. 4
Note that the ”fertility rate”, equal to the ratio of the population inflows to the outflows, implied by the stochastic aging framework, is not realistic. However, introducing two age classes corresponding to death and birth, where aging and time coincide, would lead to a fertility rate converging to the demographic rate. As it leads to the same policy rules, we will consider hereafter this fertility rate as the relevant one.
2.1.2 Employment opportunities
There are three components in the real wage : a deterministic exogenous productivity trend growing at a rate of γ, the experience component the profile of which has been described above, and an idiosyncratic risk. At each period of his life, each individual faces an idiosyncratic random disturbance that determines his rank in the employment opportunities set (his ”social class”) for a given age. These disturbances are independent and identically distributed across individuals, and they follow a finite state Markov chain with conditional transition probabilities given by
ψ(ǫ′|ǫ) = P r{ǫt+1 = ǫ′|ǫt= ǫ}
where ǫ, ǫ′ ∈ E.
ν(ǫ, ξ) will denote the global efficiency-labor indicator combining idiosyn-cratic labor productivity ǫ and seniority ξ. For retired people, it is assumed to be equal to zero. Finally, we assume that a newly-born individual has the same productivity rank as its parents.
To sum up, the idiosyncratic employment opportunities determine the relative productivity inside a given age-cohort. The absolute level of efficient labor units is then given by the age.
2.2
Social security
Social security pays pensions for a total of Ωt to retirees. The system is
financed by levying taxes on workers denoted Tt. Each period, the social
security budget is balanced:
Tt = Ωt
More precisely, the social security system is financed by the proportional tax τ on labor income levied on all working people5. We assume that the pensions
are linked to the individual wage histories of the workers. Nevertheless, al-lowing for idiosyncratic history dependence in social security payments would mean sacrificing considerable tractability. Thus, for simplicity, the pensions ω are indexed only to the last wage earned by workers. In order to take into account the redistributive dimension of the social security system, they are also indexed to the average wage.
ω(ǫ, ξ) = ρ[˜ρw + (1 − ˜ρ)wν(ǫ, C3)] for ξ = C4, C5, C6 5
Note that we do not explore the case where running a debt is allowed for the SS system. As Ricardian equivalence fails in our model, agents do not view debt and taxes as fully equivalent.
where ρ gives the replacement rate of a combination of the average wage w and the last wage earned by the individual wν(ǫ, C3). The parameter ˜ρ governs the degree of the redistribution implied by the social security arrange-ment: a higher value of ˜ρ goes towards a more redistributive pensions system. As is shown in the section devoted to the calibration, this linear function al-lows us to match some crucial stylized facts concerning the distribution of earnings in France.
2.3
The individual decisions
Preferences. Individuals only derive utility from their consumption when they are alive as well as from the consumption of their progeny. We do not consider the intensive margin of labor supply6 to be consistent with
recent empirical studies on the quite inelasticity of individual hours relative to labor taxes in Europe (Altonji and Oldham (2003) and Alesina, Glaeser, and Sacerdote (2005)). Furthermore, we abstract the extensive margin from any decisions about labor supply, because it would have made the computation of the equilibrium much more complicated, especially if retirement age had been endogenous.
We assume that the instantaneous utility function u is a CRRA: u(C) = C
1−σ
1 − σ with σ ∈ [0, 1[∪]1, ∞[.
The stationary dynamic program. In order to define a stationary equi-librium, we divide all the variables by the gross rate of technological progress (1 + γ) and by the gross rate of population (1 +n). Let 1 + g = (1 + n)(1 + γ). We denote stationary consumption and wealth by:
c = Ct/(1 + g)t and a = At/(1 + g)t
whereas the average wage and the average pension are denoted in stationary terms by:
w = wt/(1 + γ)t, ω = ωt/(1 + γ)t,
The individual’s state variable is a pair (a, s) which includes the realiza-tion of the individual-specific process s and the beginning-of-period capital stock. The variable st ∈ S is a compact notation to denote the age and the
6
See Huggett and Ventura (1999) and Fuster (1999) for an analysis of social security reform that allows for endogenous labor supply in the US case.
individual’s employment opportunity. The variable s follows a finite state Markov chain with conditional transition probability given by
π(s′|s) = P r{st+1 = s′|st= s}
The dynamic program solved by a representative individual of type s is the following: v(a, s) = max c≥0 u(c) + ˜β ( X s′∈V π(s′|s)v(a′, s′) + η X s′∈S1 π(s′|s)v(a′, s′) ) (7) s.t. (1 + g)a′ = (1 + r)a + (1 − τ )wν(s) + ω(s) − c (8) a′ ≥ 0 (9)
where v denotes the value function, r the risk-free interest rate and V ∈ S the set of all the possible states s of being alive. ν(s) is then the endowment of efficiency-labor units received by an individual that draws shock s: if s ∈ Sr,
the subset of all the possible states s of being retired, then ν(s) = 0; if s ∈ Sw, the subset of all the possible states s of being in the labor force, then
ω(s) = 0. τ is the tax rate. Given the utility function, the modified discount factor is given by ˜β = β/(1 + g)(1−σ). The individuals are assumed to face
a liquidity constraint (see equation (9)). Finally, the last term of the value function describes the utility derived from their bequests. The parameter η > 0 is related to the individual’s concern for the welfare of its off-spring who begins his career at the same level of the productivity ladder.
Since the decision problem is a finite-state, discounted dynamic program, an optimal stationary Markov solution to this problem exists. This solution gives the optimal consumption as a function of (a, s).
2.4
Definition of the equilibrium
In this section, we present the computation of the general equilibrium with endogenous adjustment of factor prices. A steady state equilibrium for this economy is a vector of price {w, r}, policy rules {c(a, s), a′(a, s)}, value func-tions v(a, s), a social security arrangement {ρ, ˜ρ, τ, ω(s)}, a stationary distrib-ution of individuals λ(a, s) and a vector of stationary aggregates (K, N, A, Ω, T ) such that
(i) factor prices are factor marginal productivity: r = F′
K− δ and w = FN′ ,
where δ denotes the capital depreciation rate. The detrended produc-tion funcproduc-tion and the aggregate labor input in efficiency units N are
defined by: F (K, N ) = AKαN1−α N = X s∈Sw X a λ(a, s)ν(s)
(ii) Given the vector of price and the social security arrangement, the poli-cies a′ = g(a, s) and c = f (a, s) solve the decision problem described
by (7) s.t. (8) and (9).
(iii) The distribution of probability λ(a, s) is a stationary distribution as-sociated with (a′ = g(a, s), π(s′|s)) such that:
λ(a′, s′) = X
s∈S
X
{a:a′g(a,s)}
λ(a, s)π(s′|s)
(iv) The social security budget constraint is satisfied Ω = T , i.e.: X s∈Sr X a λ(a, s)ω(s) = X s∈Sw X a λ(a, s)τ wν(s)
(v) The aggregate supply of capital A equals the demand of capital K: K = A
where the total amount of supply is obtained by aggregating over indi-viduals: A =X s∈S X a λ(a, s)g(a, s)
The numerical method used for computing the equilibrium is described in the Appendix A.
3
Calibration and quantitative evaluation
3.1
Calibration of the model
This section presents the calibration of the preferences and technology para-meters, the demographic structure, the idiosyncratic labor income risk, the life-cycle profile of labor earnings and the social security arrangement.
3.1.1 Preferences and technology.
Following Charpin (1999), the gross rate of the technological progress is fixed at 1.02. The notion of capital retained in the study corresponds to the fixed (reproducible) private capital. In France7, we observe that the
capital-output ratio is equal to 2 and consider that the capital share α and the depreciation rate δ are respectively 0.315 and 0.1. Given that r = F′
K − δ
with F′
K = α(Y /K), this calibration implies an interest rate equal to 5.75%.
We choose to normalize the average wage to unity: this allows us to deduce the scale parameter of the production function A and the level of production Y .
In order to have an initial steady state which corresponds to a general equilibrium, we choose a value for β which leads to an aggregate supply of capital A corresponding to the demand of capital K. With σ = 1.5, a value included in the range of estimate provided by Attanasio, Banks, Meghir, and Weber (1999), we obtain β = 0.96. The coefficient η defining the degree of altruism is such that the bequest-capital ratio predicted by the model matches its empirical counterpart (1.4%, see Arrondel and Laferr´ere (1996)). It is then equal to 0.9.
When we compute the general equilibrium for the 2040 demographics, we keep A constant and determine the equilibrium values of the interest rate r and of the real wage w (see Appendix A for more details).
3.1.2 Idiosyncratic shocks
The calibration of the idiosyncratic shocks faced by individuals is based on external information. In section 3.2 we discuss the quality of the match between the model and the data.
The demographic regime. Following Charpin (1999), the annual growth rate of the population is fixed at 0.65%. The transition matrix ΠE governing
the demographic structure is calibrated so that the expected duration of the working life is 40 years, whereas the retirement period lasts in expectation 20 years. At stationary equilibrium, this matches the fact that the support ratio between retirees and workers is equal to 0.41 in the France of the 1990s. Beyond the expected duration of these two main sub-periods of the life cycle, the expected life time is assumed to be 15 years as a young worker
7
The data we use come from the Cepii (Centre d’Etudes Prospectives et d’Informations
Internationales). We compute averaged aggregate data over the post-oil shock period.
(C1)8, 20 years as an experienced worker (C2) and 5 years as an old worker
(C3). Concerning the periods of retirement, the expected life time is 4 years as a young retiree (C4), 11 years as a middle-age retiree (C5) and 5 years as an old retiree (C6). This strategy allows for the probability of death to increase with age. The demographic process is described by the following transition matrix: t + 1 t C1 C2 C3 C4 C5 C6 C1 1 −151 151 0 0 0 0 C2 0 1 − 1 20 1 20 0 0 0 C3 0 0 1 − 15 15 0 0 C4 0 0 0 1 −14 14 0 C5 1 7 × 1 11 0 0 0 1 − 1 11 6 7 × 1 11 C6 15 0 0 0 0 1 −15
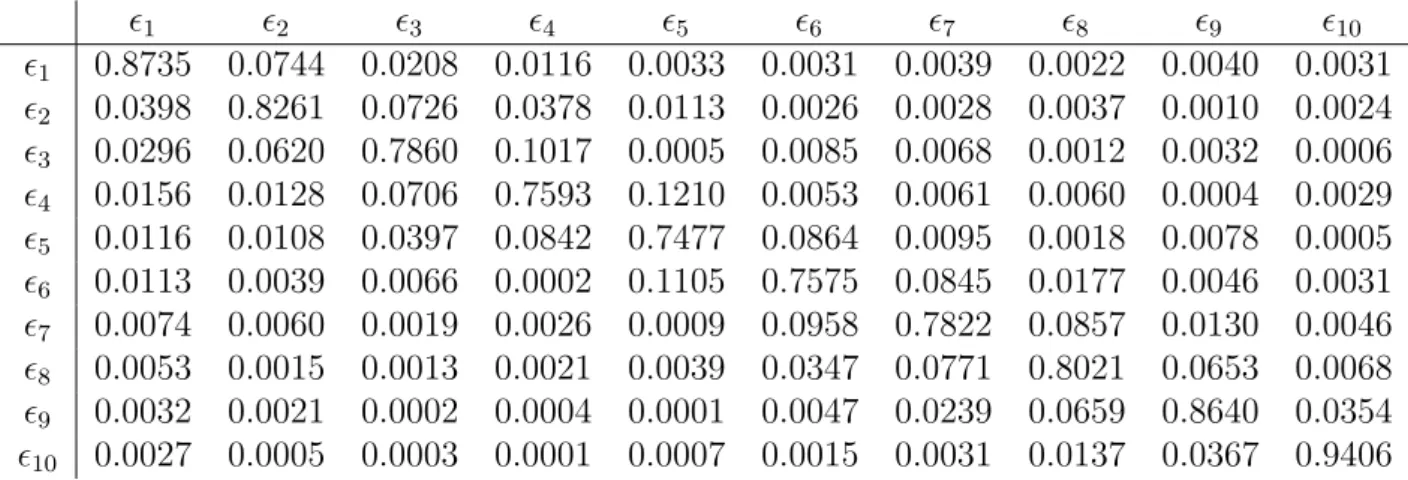
Idiosyncratic labor income risk. In order to calibrate the Markov process underlying the social mobility in our model, we use information from estima-tions of the inter-decile wage mobility on the French labor market. We then consider ten classes of productivity (Pi). The transition probabilities between
these classes were first estimated by Bourguignon and Morrisson (1987) and re-estimated more recently by INSEE (1999a) using a more recent sample (D´eclarations Annuelles de Donn´ees Sociales (DADS) between 1982-1992).
Insert here table 1
They are reported in table 1 and give the mobility properties for workers between 1982 and 1992 for labor earnings. Once labor supply is assumed to be inelastic, the following transition matrix can be considered as exogenous from any Social Security reforms.
The life cycle of labor earnings. The normalized labor efficiency of the young worker cohort is:
ν(s ∈ S1) ∈ [0.6393 0.7255 0.8196 0.9085 1 1.1127 1.2454 1.4443 1.8263 3.1432] Its range is given by the observed earnings deciles as documented in Piketty (1997).
Insert here table 2 8
All the expected durations of the classes Ci are fixed in order to get available growing experience life-cycle earnings on French data.
The efficiency of the labor input grows with the age of the agents so that ν(s ∈ S2) = (1 + x1)ν(s ∈ S1) for an experienced worker and ν(s ∈ S3) =
(1 + x2)ν(s ∈ S1) for an old worker, with x2 > x1. Given the calibration of
the pensions regime, x1 and x2 are calibrated so that the life cycle profile of
labor earnings is reproduced (see table 2). This leads us to fix x1 at 0.3 and
x2 at 0.39.
Social Security Arrangement. Finally, we calibrate the pensions system in order to match two main stylized facts: (i) the ratio between the average of the wages and the average of the pensions is equal to 1.15 (see Charpin (1999)), (ii) the ratio between the first decile of pensions and the last decile is equal to 4.2 (see Atkinson, Glaude, Olier, and Piketty (2001)). This leads us to fix ρ at 0.757 and ˜ρ at 0.115.
Insert here table 3
In a consequence, the replacement ratio decreases with the last wage (Table 3). Given these calibrations, the tax rate τ to finance the pension is equal to 0.263.
3.2
Social Security performances during the nineties
We now discuss the model’s implications concerning the distribution of earn-ings, wealth and income. The results show that the model is able to explain a large part of the inequalities observed in France.
3.3
The worker/retiree ratios
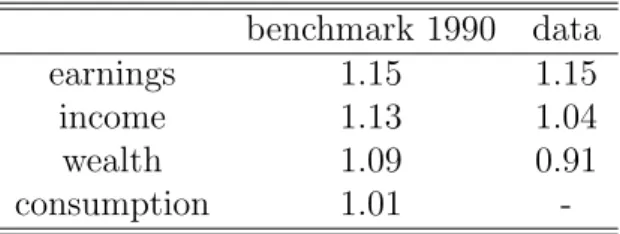
One way to deal with the distributional issue of pensions systems is to con-sider the relative situation of workers and retirees. The statistics reported in Table 4 correspond to earnings, (total) income, wealth and consumption ratios between workers and retirees on average.
Insert here table 4
As in the French data, the model implies that the gap between workers and retirees is smaller in terms of income than in terms of earnings (wages and pensions). This is the role of retirement savings. Nevertheless, the model underestimates the amount of wealth owned by the retirees. Concerning the distribution of consumption, one can notice that the French social security program is able to reach ”consumption parity” between workers and retirees on average. This was the main objective of the program when the government implemented it at the end of World War II.
Insert here table 5
The table 5 allows to verify that our model is able to generate a life cycle profile of income and wealth close to the data, whereas the earnings profile has been exogenously calibrated. However, the ratios at each age are slightly overestimated since the wealth of retirees is underestimated.
3.4
The inequalities in the nineties
Using the equilibrium stationary distribution λ of the asset and the decision rules, it is possible to compute the Gini indices of earnings, income and wealth9.
Insert here table 6
The results reported in the table 6 show that the model over-estimates the wealth inequality measured by the Gini index (Kessler and Wolff (1991)). The generous social security system implies that the retirement motive pro-vides a weak explanation of saving. This latter is mainly due to a precau-tionary motive against the labor risk: only high productivity ranked workers insure themselves and their progeny against a downward social mobility risk. Let us notice that altruistic behavior then explains a fraction of the large dispersion of wealth. This latter explains why the Gini coefficient is higher for income than for earnings. This matches the data particularly well.
4
New demographic regime and social
secu-rity reforms
The preceding section has shown that the model is able to capture the main features of the inequality in the French economy. It gives some support for studying the implications of the new demographic regime expected in 2040. The predicted population aging implies that the ratio of retirees/workers will be multiplied by approximatively 1.7. Faced with this exogenous increase in the support ratio, reforms are unavoidable and they may differ in the degree of inequality implied.
In order to give an answer to these questions, we present the calibration of the new demographic regime and the possible adjustments of the social secu-rity program. We then present for each social secusecu-rity reform the inequality
9
Information on consumption inequality is unfortunately unavailable for the French economy.
measures obtained at partial equilibrium (P E) and at general equilibrium (GE). In the first evaluation, we assume that the interest rate does not change between 1990 and 2040. In the second, we assume that the interest adjustments are complete.
4.1
The changes in the economic environment
We keep all the parameters of the model constant. Only the transition ma-trix describing the population dynamics and the social security program is modified.
4.1.1 The demographic changes
Following the predicted changes in the French population (see Charpin (1999)), we first assume that the annual growth rate of the population is zero from now on. Second, we assume that the increase in the number of retirees is explained by the increase in the life expectancy. In 2040, the expected du-ration of retirement will be 30 years. We then decrease the probability of dying in the last period of retirement in order to match this duration, keep-ing the remainkeep-ing probabilities unchanged. The demographic process is now described by the following transition matrix:
t + 1 t C1 C2 C3 C4 C5 C6 C1 1 − 1 15 1 15 0 0 0 0 C2 0 1 − 201 201 0 0 0 C3 0 0 1 − 1 5 1 5 0 0 C4 0 0 0 1 −1 4 1 4 0 C5 111 × 121 0 0 0 1 − 111 111 × 1112 C6 1 14 0 0 0 0 1 − 1 14
At the stationary equilibrium, the ratio between retirees and workers is then equal to 0.70, its predicted value in 2040 in France.
4.1.2 The social security program reforms
In order to finance the increase in the support ratio, two strategies may be considered: first an increase in the tax rate τ (policy 2040-(τ )), and second a decrease in the replacement ratio ρ (program 2040-(ρ)). Given the calibration of the new demographic regime, these social security program adjustments are synthesized in table 7.
The first strategy maintains the existing level of the inter-generational trans-fers toward the retirees provided by the social security, but uniformly in-creases the contribution of each worker. The second strategy consists in reducing the generosity of the PAYG pension system, leading to more indi-vidual savings.
Let us notice that the redistributive effect embodied in the social security arrangement10 is de facto reduced when the replacement ratio is decreased.
4.2
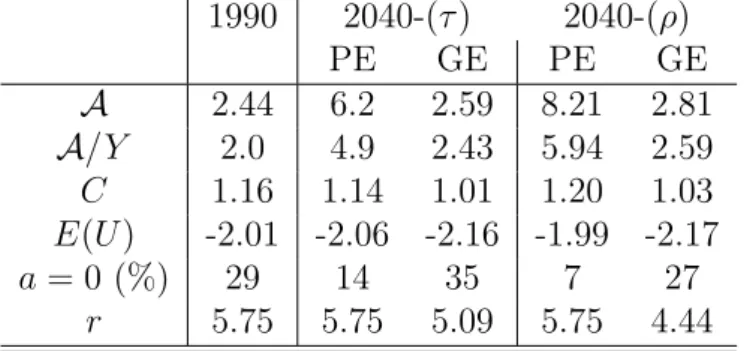
Stationary equilibrium aggregates
Before studying the implication in terms of inequality, let us consider the first order moments of the equilibrium distribution for each demographic regime and each social security program (see table 8).
This is of course when the tax rate is not modified, implying that agents save more, the more the interest rate declines. The decrease in the interest rate in the two adjustments implies via the factor price frontier relationship an increase in the aggregate wages.
Insert here table 8
In the scenario 2040-(τ ), the increase in the expected life-time implies that the agents save more and consequently are more able to protect themselves against the borrowing constraint. This implies a cost in term of consumption. The decrease in the replacement ratio enhances this phenomenon (scenario 2040-(ρ)). Nevertheless, the large increase in saving allows agents to enjoy greater earnings and thus allows them to preserve a high consumption.
4.3
The relative situation of workers and retirees
Table 9 shows that the earnings/pensions ratio does not change in the new demographic regime if the replacement ratio is maintained. More generally, whatever the indicator considered, the relative situation of workers and re-tirees on average is not really affected by demographic changes.
On the contrary, the decrease in the replacement ratio hugely increases the earnings/pensions ratio. This effect on income is only partially compensated for by wealth accumulation. At partial equilibrium, a large decrease in the replacement rate stimulates more intra-personal insurance and degrades the relative situation of retirees, despite the high level of interest rate. Indeed the inter-temporal transfers do not preserve the consumption parity: the savings effort is not sufficient. This first result gives some arguments in
10
favor of the current social security system: the agents have a preference for the present and hence they do not insulate themselves against a decline in their consumptions at the end of their lives. At general equilibrium, these results are amplified by the decrease in the interest rate, implying that the consumption of the employees would be 37% larger than that of the retirees.
Insert here table 9
These first results show that the decrease in the replacement ratio in-duces more inequality between workers and retirees. Nevertheless, beyond these statistics based on the means of distribution, the theory is able to give some information on the intra-cohorts inequalities, and more generally on the overall inequalities implied by the social security reforms.
4.4
The inequality of position in 2040
Inequality will be measured by the inter-decile D9/D1 ratio and by the Gini index. These indicators are computed on the stationary distribution. We call this cross-section approach of inequality “inequality of position”. Notice that it corresponds to the empirical way the degree of inequality is usually measured. For comparing the different reforms, we only focus on the con-sumption inequality. We will mention wealth and income inequality only insofar as they allow us to understand the former.
The new demographic regime and the different social security programs imply particular deformations of the wealth and consumption distributions. As the degree of inequality appears to be sensitive to the capital market equilibrium hypothesis (partial versus general equilibrium), we study both the effects before any price adjustments and after the equilibrium of the capital market.
At partial equilibrium, Table 10 shows that all social security reforms increase the degree of consumption inequality, even more in the 2040-(τ ) case. This result is quite surprising because the redistributive role played by the social security is larger with the reform keeping the replacement ratio unchanged, as opposed to the system where the replacement rate is decreased. Looking at the inter-deciles allows us to go further. As can be seen from the ratios D9/D1 and D5/D1 (see table 10), a lower replacement rate leads to a particular increase in the discrepancy not only between the agents at the bottom of the consumption distribution and those who are at the top, but also those at the median. Conversely, the situation of the middle class relative to those at the top of the distribution is better in this case.
Considering now the general equilibrium outcome, the differences between the different reforms are reversed and magnified. The adjustment of factor prices provokes a more pronounced rise in inequality for the more funded system, whatever the criterion considered, whereas the degree of inequality is now unchanged if the replacement rate is maintained. Faced by the initial excess of capital supply, the decrease in the interest rate inducing higher av-erage earnings appears to have the opposite effect on consumption inequality. How can these results be explained more precisely? Investigating who are the losers in each social security program may shed light on the mechanisms at work. We present in table 11 the composition by age of the lower decile of consumption11. Table 11 shows that the composition of the bottom of the
consumption distribution is sensitive to the various social security reforms. In the benchmark scenario (the nineties), the young workers (age C1) and the old retirees (age C5 and C6) constitute the first consumption decile: this situation reproduces the life-cycle earnings profile in an economy where few agents hold financial assets.
Insert here table 11
First, at partial equilibrium, it appears that the reform that keeps the re-placement ratio unchanged (2040-(τ )) leads some experienced (C2) and old workers (C3) to fall into the first consumption decile. The latter is then less determined by age and more by the social position in each cohort. In the nineties, 45% of the agents in the first consumption decile were at the bot-tom of the relative labor unit, whereas they would be 54% in 2040-(τ ). This result is explained by the impact of the liquidity constraint, which means that people who do not hold financial assets are more affected by tax in-creases. This constraint is effective for the poorest agents who have not inherited anything. Hence, the heterogeneity in the bequest distribution and the borrowing constraint explain why the increase of the proportional labor tax (2040-(τ ) PE) degrades the relative situation of the poor and the middle class. Wealth heterogeneity and liquidity constraints magnify consumption inequality. It must be noticed that the pensions system that holds the re-placement rate unchanged lead to the greatest wealth inequality (see the Appendix B), consistently with the results obtained by Fuster (1999): since bequests are concentrated among the upper wealth groups and the bequest motive is dominant relative to the life-cycle motive, the distribution of assets becomes more concentrated. Indeed, introducing more intra-personal insur-ance via a reduction of the replacement ratio implies that all agents save
11
The composition by age of the higher decile of consumption is reported in Appendix C, table 14. Briefly, this table shows that the composition of this decile is stable.
more. The risk associated with the retirement period is supported uniformly for all workers and saving is the substitute to the large pensions.
When the replacement ratio is decreased, the first decile of consump-tion is mainly composed of retirees in this case, particularly the oldest ones. Here again, the substitution of individual savings for social security pensions means that the retirees are victims of the reduced generosity of the social security system. Discounting the future and the absence of actuarially-fair annuity contracts are at the core of this result. In this case, the social posi-tion is not the main explanaposi-tion of the differences in consumpposi-tion levels but it is still quite important: agents at the bottom of the productivity classes, whatever their age, represent 33% of the first decile of consumption. Indeed all the old retirees do not fall in the poverty trap. As the richest agents save in order to insure their progeny against the social mobility risk, this capital allows them to maintain their consumption when they outlive their life expectancy.
The price adjustment again exacerbates the effects obtained at partial equilibrium for the decreased replacement rate reform. The first decile of consumption is now entirely constituted by retirees. The decrease in the in-terest rate amplifies the lack of savings available in the retirement life-time, especially for the retirees who live longer than expected. Conversely the ef-fects described at the partial equilibrium for the reform increasing the tax rate (2040-(τ ) GE) again appears to be compensated for by the price adjust-ments. Firstly, the increase in earnings absorbs the higher labor tax: this phenomenon explains why the relatively low-ranking productivity workers are less numerous in the first decile of consumption for the reform charac-terized by a higher tax rate. The decrease in the interest rate affects some retirees negatively, although to a lesser extent than for the more funded case. To sum up, it appears that each reform has its own drawbacks. Asset accumulation should be partly obligatory and based on actuarially-fair annu-ity contracts. A PAYG system should introduce an age-dependent labor tax taking into account the efficiency rise during the working life-time. The rel-ative importance of these shortcomings crucially depends on the adjustment of the interest rate. From this analysis based on inequality of consumption, it appears, taking into account all the price adjustments, that introducing more individual savings may lead to a lower performance. However, these mea-sures are based on the degree of inequality in consumption at a given year, the inequality of positions. The heterogeneity we have focused on may result from intertemporal plans: this is clearly the case for the higher degree of in-equality in consumption that we get in a more funded system. This however does not carry any information on the intertemporal welfare heterogeneity which may be considered as a more relevant measure of inequality.
4.5
The inequality of perspectives across the new-born
agents
In this last section, we analyze intertemporal welfare-based inequality mea-sures, focusing now on what we call the inequality of perspectives. In which kind of economy is the expected welfare heterogeneity between the new-born agents the weakest?
4.5.1 Intertemporal welfare-based measure of inequality of per-spectives
The measure used to evaluate the inequality of perspectives for the new-born agents, under various social security reforms, is based on the value functions underlying the individual dynamic programs. We can easily recover the in-tertemporal values, averaged on assets, of the different classes of productivity ǫj (the representative agent of each productivity class) for the new-born
gen-eration C1. We denote them Uj:
Uj =
X
a
λ(a, ǫj, C1)v(a, ǫj, C1) for j = 1, ..., 10
One drawback of this welfare measure is that it can only rank different social security reforms. It would be useful to have a welfare measure that could be explicitly evaluated in terms of consumption. For this purpose, we compute the constant stream of consumption cj leading to the level of intertemporal
welfare Uj. These permanent levels of consumption for each representative
individual of productivity group j can then be used to compute some kind of inter-deciles index. We focus on the permanent consumption of the lowest productivity level representative agent relative to the highest:
Θ = c(ε10, C1) c(ε1, C1)
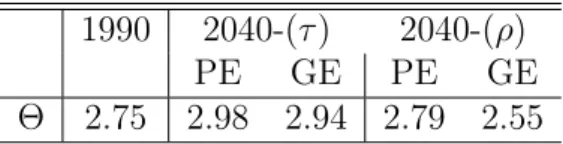
4.5.2 An inequality criterion in favor of a more funded system Table 12 clearly shows that the inequality of perspectives at the beginning of life, Θ, is the lowest when the replacement rate decreases (2040-(ρ)). This result is true both at the partial and general equilibrium. It remains to be explained why the inequality hierarchy between the different reforms is reversed when expected intertemporal welfare is considered.
The tax burden is weaker for workers in a more funded system. This relatively improves the situation of workers without financial assets, those
born with the lower skills, by decreasing their probabilities of being con-strained in the financial market. Smoothing their consumption is easier and thus welfare-improving. Given the time-discount factor, these present gains are greater than the future expected losses associated with the period of re-tirement. More importantly, these losses are shared by all new-born agents, whatever their social class. In a more funded system, they result from the risk for retirees to outlive their expected time of death. The realization of this risk, not the risk itself, creates inequalities (of position)12.
Insert here table 12
By contrast, the increase in the tax rate (2040-(τ )), which finances more generous pensions, increase the intertemporal inequality. High tax rates in-crease the probability for new-born agents at the bottom of the earnings distribution to be constrained on the financial market: their relative welfare is lower. Hence, beyond the fact that the increase in tax constrains agents to save at the very beginning of their life, this policy can prevent agents from smoothing their consumption. At general equilibrium, when the replacement rate is lowered, the increase (decrease) of the real wage (interest rate) allows the poorest agents to consume more, although financial revenues decrease. These adjustments lead to less inequality than in 1990.
Adopting the new-born perspectives inequality criterion then changes our vision of the social security reforms. It contrasts with the results based on the inequality of positions. This comes from the intertemporal dimension of this criterion. It strengthens the role of existing borrowing constraints at the beginning of life, and reduces the importance of the survival risk at the end of life.
5
Concluding remarks
A quantitative general equilibrium model along the lines of Castaneda, Diaz-Gimenez, and Rios-Rull (2003) has allowed us to shed light on the inequal-ity implications of pensions reforms which will undoubtedly be necessary to cope with the aging population in developed countries. We show that the very popular idea that a more funded system would ineluctably lead to more inequalities in well-being can be justified by only focusing on the inequality of positions in the case of a particularly low interest rate. This situation actually occurs when general equilibrium is computed, due to the endoge-nous price adjustments. This increase of the retirement insurance premiums
12
The precautionary savings against the social mobility of their progeny allow the richest agents to maintain their consumption when they outlive their life expectancy.
indeed degrades the relative consumption level of retirees who outlive their life expectancy. However, our quantitative exercise reveals that a reform that would keep the generosity of the pay-as-go system unchanged, by increasing the tax rate on labor, also implies some unwanted consequences for inequality which are generally underestimated. They are related to the heterogeneous way, due to wealth inequality and the existing liquidity constraints, by which agents cope with the increased tax. They would degrade the relative situation of the less productive workers. If they are not strong enough to dominate the inequality of positions induced by a decreasing replacement rate pensions re-form, they would lead to reversed results when the inequality of perspectives of the new-born agents is retained.
In this paper, we have favored the view that the labor supply is inelastic in France. This assumption may work importantly to understate the negative consequences of a change in policy that holds replacement rates constant. Recently, Prescott (2004) and Rogerson (2006) have strongly challenged this view. It could be useful in future work to explore this avenue.
It could be also interesting to evaluate in the same line the reform con-sisting of delaying the retirement age since European countries have often favored this strategy. It implies to introduce an endogenous choice of the retirement age decision in a framework with capital accumulation as in Rust (1989). It is left for further research.
Appendix
A
Computation
This appendix describes the algorithm that we have used to compute the equilibrium allocation of the model economy. We use the Howard improve-ment algorithm in order to solve the Bellman equations of the model. Let there be n states A = [0 < a2 < a3 < ... < an] for assets and m states
S = [s1, s2, s3, ..., sm] for employment status. Define m vectors vj, with
dim(vj) = n × 1. The ith row are such that:
vj(i) = v(ki, sj) ∀i = 1, ..., n
Let m matrix Rj, with dim(Rj) = n × n, define by:
Rj(i, h) = u((1 + r)ai+ sj− (1 + g)ah) pour i = 1, ..., n, h = 1, ..., n (10)
Define an operator T ([v1, ..., vm]) that maps a set of vectors [v1, ..., vm] into
a set of vectors [tv1, ..., tvm]: tv1 ... tvm = max R1 ... Rm + β(Π ⊗ 1) v′ 1 ... v′ m (11)
where ⊗ is the Kronecker product and Π is the transition matrix that governs life-cycle, employment opportunities and altruism:
Π = ·
ΠE1⊗ ΠW 0
η(ΠE2⊗ ΠM) ΠE3⊗ ΠR
¸
where ΠEi, for i = 1, 2, 3, denotes a 3 × 3 sub-matrix of the transition matrix
for the life-cycle:
ΠE = · ΠE1 0 ΠE2 ΠE3 ¸ = p11 1 − p11 0 0 0 0 0 p22 1 − p22 0 0 0 0 0 p33 1 − p33 0 0 0 0 0 p44 1 − p44 0 p51 0 0 0 p55 1 − p55− p51 1 − p66 0 0 0 0 p66
ΠW is the matrix of wage mobility, ΠR is the identity matrix (there is
no earning mobility during retirement), and ΠM is the matrix which governs
The Howard improvement algorithm consists (i) to make a guess to an initial feasible policy function a′ = g(a, s), (ii) to compute the n × n matrix
Ih, for h = 1, ..., m, defined by Ih(a, a′) = 1 if a′ = g(a, s) and Ih(a, a′) = 0
otherwise, and (iii) using the equation (10) that defines Rj(i, h), to evaluate
the vectors [v1, ..., vm] implied by using that policy forever:
v1 ... vm = R1 ... Rm + β Π11I1 . . . Π1mI1 ... . .. ... Πm1Im . . . ΠmmIm v1 ... vm
This first computation of the vectors [v1, ..., vm] is used as a terminal value
vector in equation (11) to find a new policy function. This function is used to update the preceding. These operation are repeated to convergence. We use a linear grid with 2,000 points. We have six age classes and 10 levels of labor-efficiency. This leads us to compute our decision rules after the convergence of 60 value functions each evaluated on 2,000 points.
B
Inequality of wealth
Table 13: Wealth heterogeneity measures (Gini indexes) 1990 2040-(τ ) 2040-(ρ)
PE GE PE GE
0.77 0.65 0.78 0.54 0.72
C
Composition by age of the higher
consump-tion decile
Table 14: Consumption – composition of the top decile by age (in%)
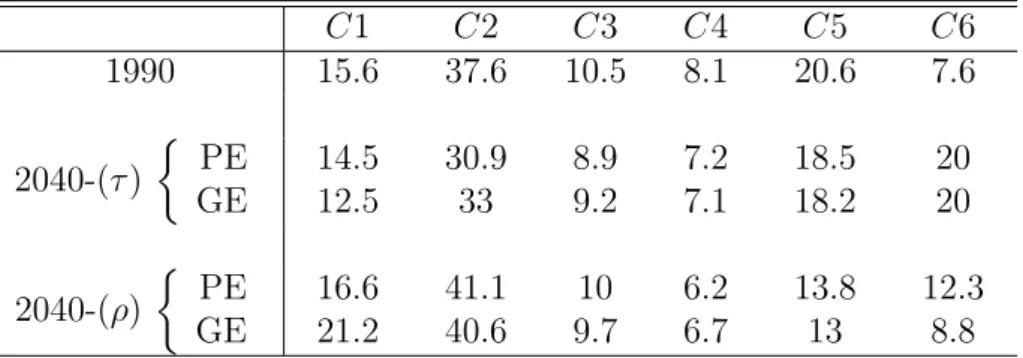
C1 C2 C3 C4 C5 C6 1990 15.6 37.6 10.5 8.1 20.6 7.6 2040-(τ ) ½ PE GE 14.5 12.5 30.9 33 8.9 9.2 7.2 7.1 18.5 18.2 20 20 2040-(ρ) ½ PE GE 16.6 21.2 41.1 40.6 10 9.7 6.2 6.7 13.8 13 12.3 8.8
References
Aiyagari, R.(1994): “Uninsured idiosyncratic risk and aggregate savings,” Quaterly Journal of Economics, 109, 659–684.
Alesina, A., E. Glaeser, and B. Sacerdote(2005): “Work and leisure in the US and Europe: Why so different?,” Discussion paper, Havard, Dartmouth and NBER.
Altonji, J., and J. Oldham (2003): “Vacation laws and annual work hours,” Economic Perspectives - Federal Reserve Bank of Chicago, pp. 19–29.
Arrondel, L., and Laferr´ere(1996): “Successions et h´eritiers `a travers les donn´ees fiscales,” Economie et Pr´evision, 100-101, 137–175.
Atkinson, T., M. Glaude, L. Olier, and T. Piketty (2001): In´egalit´es ´economiques. La documentation francaise.
Attanasio, O., J. Banks, C. Meghir, and G. Weber(1999): “Humps and bumps in lifetime consumption,” Journal of Business and Economic Statistics, 17, 22–35.
Bourguignon, F., and A. Morrisson (1987): “Profils de carri`ere d’un ´echantillon d’ouvrier et d’employ´es,” Economie et Statistique, 198, 21–35. Castaneda, A., J. Diaz-Gimenez, and V. Rios-Rull (2003): “Ac-counting for earnings and wealth inequality,” Journal of Political Econ-omy, 111, 818–857.
Charpin, J. (1999): L’avenir de nos retraites. La documentation francaise. Conesa, J., and D. Krueger (1999): “Social security reform with
het-erogeneous agents,” Review of Economic Dynamics, 2, 757–795.
De Nardi, M. (2004): “Wealth inequality and intergenerational links,” Review of Economic Studies, 71, 743–768.
Domeij, D., and P. Klein (2002): “Private pensions: to what extend do they account for Swedish wealth inequality?,” Review of Economic Dy-namics, 5, 503–534.
Fuster, L. (1999): “Is altruism important for understanding the long-run effects of social security?,” Review of Economic Dynamics, 2, 616–637.
Fuster, L., A. Imrohoroglu, and S. Imrohoroglu(2003): “Is altru-ism important for understanding the long-run effects of social security?,” International Economic Review, 44, 1247–1274.
Hubbard, R., andK. Judd(1987): “Social security and individual welfare: Precautionnary saving, liquidity constraints, and payroll tax,” American Economic Review, 77, 630–646.
Huggett, M., and G. Ventura(1999): “On the distributional effects of social security reform,” Review of Economic Dynamics, 2, 498–531. Imrohoroglu, A., S. Imrohoroglu, and D. H. Joines (1999):
“Com-putational models of social security: A survey,” in Com“Com-putational Methods for the Study of Dynamic Economies, ed. by R. Marimon, and A. Scott, pp. 221–237. Oxford University Press.
Ingenue (2002): “A long term model for the world economy,” in Mar-ket Imperfections and Macroeconomic Dynamics, ed. by J. Hairault, and H. Kempf, pp. 51–75. Kluwer.
INSEE (1998): Revenu et patrimoine des m´enages, no. 19.
(1999a): “Le mod`ele de microsimulation dynamique DESTINIE,” Document de travail de la direction des Etudes et Synth`ese Econoiques G9913, Division Redistribution et Politiques sociales.
(1999b): Revenu et patrimoine des m´enages, no. 28.
Kessler, D., and E. Wolff (1991): “A comparative analysis of house-hold wealth patterns in France and United States,” Review of Income and Wealth, 37, 249–264.
Piketty, T. (1997): L’Economie des In´egalit´es. La D´ecouverte.
Prescott, E. (2004): “Why do americans work so much more than euro-peans?,” Federal Reserve Bank of Minneapolis Quarterly Review, 28, 2–13. Rogerson, R.(2006): “Understanding differences in hours worked,” Review
of Economic Dynamics, 9, 365–409.
Rust, J. (1989): “A dynamic programming model of retirement behaviors,” in The Economics of Aging, ed. by D. Wise, pp. 359–398. Chicago Press. Storesletten, K., C. Telmer,andA. Yaron(1999): “The risk-sharing
implications of alternative social security arrangements,” Carnegie-Rochester Conference Series on Public Policy, 50, 213–259.
Tables
Table 1: Annual transitions between deciles
ǫ1 ǫ2 ǫ3 ǫ4 ǫ5 ǫ6 ǫ7 ǫ8 ǫ9 ǫ10 ǫ1 0.8735 0.0744 0.0208 0.0116 0.0033 0.0031 0.0039 0.0022 0.0040 0.0031 ǫ2 0.0398 0.8261 0.0726 0.0378 0.0113 0.0026 0.0028 0.0037 0.0010 0.0024 ǫ3 0.0296 0.0620 0.7860 0.1017 0.0005 0.0085 0.0068 0.0012 0.0032 0.0006 ǫ4 0.0156 0.0128 0.0706 0.7593 0.1210 0.0053 0.0061 0.0060 0.0004 0.0029 ǫ5 0.0116 0.0108 0.0397 0.0842 0.7477 0.0864 0.0095 0.0018 0.0078 0.0005 ǫ6 0.0113 0.0039 0.0066 0.0002 0.1105 0.7575 0.0845 0.0177 0.0046 0.0031 ǫ7 0.0074 0.0060 0.0019 0.0026 0.0009 0.0958 0.7822 0.0857 0.0130 0.0046 ǫ8 0.0053 0.0015 0.0013 0.0021 0.0039 0.0347 0.0771 0.8021 0.0653 0.0068 ǫ9 0.0032 0.0021 0.0002 0.0004 0.0001 0.0047 0.0239 0.0659 0.8640 0.0354 ǫ10 0.0027 0.0005 0.0003 0.0001 0.0007 0.0015 0.0031 0.0137 0.0367 0.9406
Table 2: Life-cycle profile of labor earnings
C1/R C2/R C3/R
earnings ratio 0.95 1.23 1.32
These statistics are computed using the data reported in IN-SEE (1999b). The reference year is 1996. R denotes the aver-age earnings for all the retirees.
Table 3: Replacement ratios according to social class
ǫ1 ǫ2 ǫ3 ǫ4 ǫ5 ǫ6 ǫ7 ǫ8 ǫ9 ǫ10
0.82 0.802 0.787 0.776 0.766 0.756 0.747 0.736 0.723 0.701
Table 4: Workers/retirees on average benchmark 1990 data
earnings 1.15 1.15
income 1.13 1.04
wealth 1.09 0.91
consumption 1.01
-Table 5: The life-cycle profiles
C1/R C2/R C3/R earnings: ½ data model 0.95 0.95 1.23 1.23 1.32 1.32 income: ½ data model 0.80 0.93 1.09 1.24 1.26 1.34 wealth: ½ data model 0.55 0.80 1.02 1.22 1.17 1.45
These statistics are computed using the data reported in INSEE (1999b). The reference year is 1996.
Table 6: Gini indexes
Wealth Income Earnings
data 0.710 0.320 0.270
model 0.760 0.324 0.273
Source: Kessler and Wolff (1991), INSEE (1998) and INSEE (1999b).
Table 7: Social security program adjustments
ρ τ
1990 0.757 0.263
2040-(τ ) 0.757 0.375 2040-(ρ) 0.450 0.263
Table 8: Social security reform and macroeconomic aggregates
1990 2040-(τ ) 2040-(ρ) PE GE PE GE A 2.44 6.2 2.59 8.21 2.81 A/Y 2.0 4.9 2.43 5.94 2.59 C 1.16 1.14 1.01 1.20 1.03 E(U ) -2.01 -2.06 -2.16 -1.99 -2.17 a = 0 (%) 29 14 35 7 27 r 5.75 5.75 5.09 5.75 4.44
Table 9: Workers versus retirees 1990 2040-(τ ) 2040-(ρ) PE GE PE GE earnings 1.15 1.15 1.15 1.95 1.95 income 1.14 1.11 1.15 1.58 1.86 financial wealth 1.09 1.03 1.2 1.14 1.5 consumption 1.01 1.01 1.02 1.21 1.37 workers with a = 0 (%) 31 15 33 5 24 retirees with a = 0 (%) 26 12 37 8 31
PE : Partial Equilibrium with r = r∗ 1990
GE : General Equilibrium with r = r∗ 2040
Table 10: Inequality of position
Gini D9/D1 D5/D1 D9/D5 1990 0.27 4.76 1.53 3.09 2040-(τ ) ½ PE GE 0.29 0.27 5.37 4.23 1.81 1.42 2.97 2.98 2040-(ρ) ½ PE GE 0.28 0.29 5.9 5.87 2.12 1.96 2.76 2.98
Table 11: Decomposition of the first decile by age (in %)
C1 C2 C3 C4 C5 C6 1990 60.4 0 0 5.3 23.7 10.5 2040-(τ ) ½ PE GE 40.2 49.5 12.1 0 2.6 0 5 4.3 16.9 19 23.1 27.2 2040-(ρ) ½ PE GE 17.7 0 0 0 3.3 0.1 6.3 6 25.7 34.3 47 58.9
Table 12: Inequality of perspectives 1990 2040-(τ ) 2040-(ρ)
PE GE PE GE