HAL Id: halshs-01317407
https://halshs.archives-ouvertes.fr/halshs-01317407
Submitted on 18 May 2016HAL is a multi-disciplinary open access
archive for the deposit and dissemination of sci-entific research documents, whether they are pub-lished or not. The documents may come from teaching and research institutions in France or abroad, or from public or private research centers.
L’archive ouverte pluridisciplinaire HAL, est destinée au dépôt et à la diffusion de documents scientifiques de niveau recherche, publiés ou non, émanant des établissements d’enseignement et de recherche français ou étrangers, des laboratoires publics ou privés.
Synchronization in human decision making
Yi-Fang Liu, Jørgen Vitting Andersen, Maxime Frolov, Philippe de Peretti
To cite this version:
Yi-Fang Liu, Jørgen Vitting Andersen, Maxime Frolov, Philippe de Peretti. Synchronization in human decision making. 2016. �halshs-01317407�
Documents de Travail du
Centre d’Economie de la Sorbonne
Synchronization in human decision making
Yi-Fang LIU, Jørgen Vitting ANDERSEN,
Maxime FROLOV, Philippe De PERETTI
Synchronization in human decision making
Yi-Fang Liu♣, Jørgen Vitting Andersen♣♣,♣♣♣,, Maxime Frolov♣♣♣ and Philippe de Peretti♣♣♣
March 2016
♣College of Management and Economics, Tianjin University, Tianjin, 300072, China
♣♣ CNRS, ♣♣♣Centre d’Economie de la Sorbonne, Université Paris 1 Pantheon-Sorbonne,
Maison des Sciences Economiques,106-112 Boulevard de l’Hôpital, 75647 Paris Cedex 13, France.
Just like soldiers crossing a bridge in sync can lead to a catastrophic failure, we show via experiments, theory, and simulations, how synchronization in human decision making can lead to extreme outcomes. Individual decision making and risk taking are well known to be gender dependent[1-8]. Much less is however understood about gender’s impact on the creation of collective risk through aggregate decision making, where the decision of one individual can affect the decision making of other individuals, eventually leading to synchronization in behavior[9-13]. To study the formation of collective risk created due to synchronization in human decision making, we have devised a series of experiments that can be analyzed and understood within a game theoretical framework. In the experiments each individual in groups of either men or women decide to buy or sell a financial asset based on an information set containing past price behavior. Risk can be generated collectively through coordination in the aggregate decision making, which leads to a price formation far from the fundamental value of the asset. Here we show how collective risks can be generated in groups of both genders, but the pathway to formation of collective risks happens through an individual risk taking which are different for groups composed of men respectively women. A priori we find that it is impossible to know whether a given group will engage in the formation of collective risk, but via a fluctuation based game theoretical framework we are able to estimate the likelihood that it will happen. Our results highlight some of the foundations for creation of excessive collective risks relevant for example in the understanding of financial systemic risks.
At the very height of the international credit crisis and during the near collapse of the Icelandic banking system end of 2008, beginning 2009, the Icelandic politician Johanna Sigurdardottir attracted voters by promising to “end the era of testosterone”. The business man of the year in 2008 in Iceland was a woman, and after Sigurdardottir became prime minister in February 2009, half of her new ministers were chosen women. Furthermore the CEOs in two of the three largest banks were replaced by women. If anything this Icelandic tale shows that both from the public but also political side there is the conception that risky behaviour is an attribute deeply rooted in male decision making, especially during crisis, and could be avoided by including more women into the decision process. Politically as well as economically it is therefore important to have some solid research telling us whether there is some truth in such a viewpoint. The specific purposes of this paper is indeed to introduce tools to understand the origins behind excessive risk taking formed through synchronization in collective decision making, taking into account the gender issue.
Recent research in cognitive and behavioural effects has highlighted the importance in the role of the endocrine system in the decision making of individuals [7-8]. For example it has been shown how the testosterone levels of traders in the City of London was able to predict their gains, whereas cortisol levels of a trader would rise with increasing uncertainty of the gains[7]. Later studies however showed that larger gains were only obtained by larger risk taking[8] Whereas such studies explains how individuals react and make their decisions in isolation, it does not probe how risk is created via collective decision making where the outcome in the decision making of one individual can influence subsequent decision makings of other individuals. As such the study we describe in the following can be seen as an example of social epistemology where the knowledge as a collective achievement is the knowledge of a number: the proper price of an asset[9]
To examine how risk at the level of a system can be created collectively we performed a series of trading experiments with students having at least 4 years of university studies of economics. The experiments were performed in the Laboratory of Experimental Economics in Paris (LEEP). In the experiments that ran over 60 periods the students would at each period receive general economic news and could decide whether to buy or sell an asset or simply do nothing. At the end of the 60 periods the students would be paid pro rata according to their performance, for more details about the setup of the experiments see the section “Methods”.
At the beginning of the experiment the students would be informed that initially the asset was properly priced according to rational expectations[14] which means that only information relevant to changes in dividends of the asset or interest rates should have a direct influence on the price of the asset. The flow of information was taken as general news from past real records of Bloomberg news items. The news were selected such that the general trend over the consecutive 60 periods was neutral, meaning that according to rational expectation there should be no overall price movements of the asset at the end of the 60 time periods. Thus an oscillatory price dynamics around the fundamental value is expected throughout the experiment.
Figure 1 to be placed here
.
Figure 1 | Outcome of collective decision making for different groups. Figure 1a: price
behavior (black dots) for a group of male participants. Figure 1b: adding to figure 1a a price history (white circles) created by collective decision making of a group of female participants.
Figure 1c: adding initial price formation created by another group of female participants (white triangles) which end up with a different (risk taking) trajectory as seen in figure 1d. However as seen in figure 1e such collective risk taking was completely dwarfed by another group of male participants (black squares). Figure 1f: price formation of all 10 experiments.
Figure 1a shows the price behavior (black dots) for a group of male participants where the collective decision making of the participants created a price history fluctuating around the fundamental value of 5$s. Figure 1b adds a price history (white circles) created by the collective decision making of a group of female participants. The resulting decision making of both groups looks stunningly similar throughout the two experiments. Figure 1c adds the price formation created by another group of female participants (white triangles). The outcome of the initial decision making of this group of women seems to deviate from the behavior reported in figures 1a-b. Indeed as seen in figure 1d the collective risk taking created by the group results in a value of the final price more than twice the fundamental value. However as seen in figure 1e such collective risk taking was completely dwarfed by the price formation generated by another group of male participants (black squares). Figure 1f show the price formation of the ensemble of the 10 experiments performed at LEEP.
Given that the information presented to the participants is the same for all the different groups, how come then that one observes such seemingly different behavior between the
groups? To answer this question a first and natural guess would be to relate the composition
of risk taking of the participants in a given group to the outcome of collective risk taking seen in the experiments[15], expecting the effect of larger collective risk taking caused by larger individual risk taking among the participants.
In order to check this hypothesis we evaluated prior to each experiment the risk profile of each participant according to a lottery-choice experiment[2], for more information see section “Methods”. As a measure of individual risk aversion we show in Table 1 the median of the safe choice number made by the participants in the Holt and Laury lottery-choice experiment[2] for a given group (the higher this number the more risk averse the choice[2]). As expected[2] the groups with men in general appeared less risk averse compared to the groups with women (overall the group with the least risk aversion was composed of men whereas the
two most risk averse groups were composed of women) but some deviations from this general patterns were seen.
.
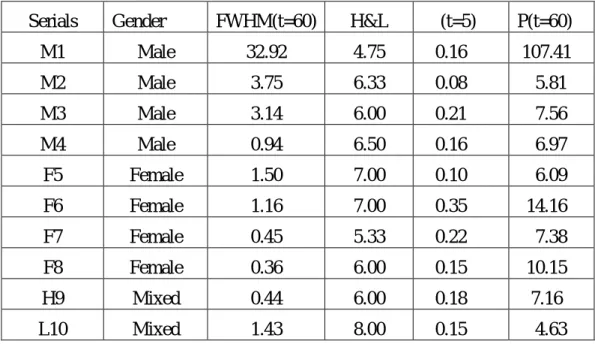
Table 1. Statistics of each experiment.
Serials Gender FWHM(t=60) H&L σ(t=5) P(t=60) M1 Male 32.92 4.75 0.16 107.41 M2 Male 3.75 6.33 0.08 5.81 M3 Male 3.14 6.00 0.21 7.56 M4 Male 0.94 6.50 0.16 6.97 F5 Female 1.50 7.00 0.10 6.09 F6 Female 1.16 7.00 0.35 14.16 F7 Female 0.45 5.33 0.22 7.38 F8 Female 0.36 6.00 0.15 10.15 H9 Mixed 0.44 6.00 0.18 7.16 L10 Mixed 1.43 8.00 0.15 4.63
Table 1 | statistics of the 10 experiments. FWHM denotes the full width at half maximum
of the loss/gain probability distribution over the duration of the experiments. H&L denotes the median of the safe choice number made by the participants in the Holt and Laury lottery-choice experiment. The standard deviation of the loss/gain of the participants after five time
steps is represented in the column σ(t=5). Finally the level of collective risk taking can be seen from the last column P(t=60).
Most importantly the individual risk taking seen from the lottery-choice experiments did not translate into a larger tendency for collective risk taking in the market experiments. Out of the 4 experiments with men, only 1 entered a collective speculative state defined by a final price larger than twice the fundamental price (see last column in table 1), whereas half of the experiments with the women entered a collective speculate state. This is so much the more remarkable since the individual risk taking (created collectively) in the experiments, FWHM
(measured by the full width at half maximum of the loss/gain probability distribution over the duration of the experiments), followed the tendency of the lottery-choice experiments with 3 out of the 4 experiments with men having a FWHM at least twice the largest value of FWHM seen in the experiment involving women. Furthermore it should be noted that the excessive price behavior made by the group of women in Figure 1d (white triangles) was made by the group of participants taking the least individual risks (as measured by FWHM) of all the 10 performed market experiments.
These facts gives a first indication that the pathway to excessive risk taking when considering the level of a system cannot be simply deduced from aggregate behavior of individual profiles of risk. To get a more thorough understanding of the conditions needed to observe excessive price behavior we therefore launched a series of agent based simulations[16-19] see Fig.2 for a graphical representation and the section Methods for a precise definition of the model.
Figure 2 to be placed here
Figure 2 | Illustration of agent based model used to understand the experiments. I) The
agents use the direction of the last m price moves, ℎ, in their decision making, adding scores
depending on the performance of each of their s strategies (a). II) Each agent then uses the
best strategy and places an order (buy/sell/do nothing) (b). III) All orders from the N agents
are collected leading to a new price movement (c).
Monte Carlo simulations of the agent based model allowed us to study which parameters could have an impact in the creation of excessive risk behavior. Figure 3 shows the probability to generate collective speculative price behavior versus a control parameter
= [ ]
( ) where N is the number of agents (i.e. number of participants in the experiments), s
the number of technical analysis strategies at their disposal and M the number of periods the agents use in their decision making whether to buy or sell an asset. It can be shown that the
first term in the nominator corresponds to the number of independent technical analysis strategies1 that exists on a time period of length M[20] Adding the strategy which uses fundamental price analysis the nominator therefore gives the total number of uncorrelated strategies using a time horizon of M periods. The denominator gives the number of strategies in the pool of strategies available to the agents. A small value of therefore describes a system with likely overlap in the trading strategies two agents hold, whereas a large describes the other limit where it becomes very unlikely to find two agents with overlap in trading strategies[21-22].
Figure 3 to be placed here
Figure 3 | Probability for excessive risk taking versus T for groups with different risk profiles. Collective speculative price behavior, defined via a final price larger than twice the
fundamental price, is shown versus a control parameter = [ ]
( ) . Inset show simulations of
games with different s, N but for fixed value of T and m≡2. The different symbols correspond to simulations done with populations having different risk profiles.
One of our main findings is that a given fixed M and T lead to the same probability to create excessive price behavior, see inset of Figure 3 which presents simulations of games with
different s, N but for fixed value of T and m≡2. The simulations were done for agents using
their total return as payoff function (the $-Game[16]), but different choices of payoff function (see description in the following) gave similar behavior.
In order to take into account populations of agents with different risk and loss aversion, we then modified the payoff function of their strategies accordingly =
/ / with R
the return of the strategy at the end of the 60 time periods and ± the standard deviation of the
losses (-s) respective gains (+s). The magnitude of the two exponents α and β defines the risk aversion whereas their difference in magnitude defines the amount of loss aversion. For α =
β = 0 the payoff corresponds to the pure $-Game whereas for α = β = 1 the payoff is similar to
the Sharpe Ratio. Increasing α , β corresponds to a population with increasing risk aversion.
The case α > β corresponds to strategies which are loss averse, a well-documented human bias documented in Prospect Theory[23,24]. Figure 3 shows simulations done with different values
of α and β for m=2 and m=4. Comparing populations with varying degree of risk aversion (α
= β ≠ 0) and different loss aversion (α > β) to the population without risk aversion (α = β = 0 - fat solid lines), one can see that populations with different risk profiles have a negligible impact on the probability for formation of collective risk taking. As discussed beforehand this result is accordance with the observed behavior in the experiments where the risk composition of the groups in general seemed to have little impact on the collective formation of risk.
We will never know in every detail the precise reasoning behind the decision making of each individual in the experiments. However having performed interviews with participants after each experiment it seems reasonable to assume a general use of some few strategies taking into account the price evolution over the last few time periods. Assuming the use of say s=3-5 strategies, the experimentally observed probability of 3/10 to create excessive risk taking, fits nicely the predictions coming from game theory for a population using the last m=4 time periods in their decision making. This is seen by comparing the populations with different risk profiles obtained in the simulation, to the horizontal line indicating the range of T values corresponding to experiments with participants using m=4 and 3< s < 5.
Our experimental findings of how synchronization in a population can occur have been supported by results from game theory and simulations. Returning to image of soldiers crossing a bridge in the introduction of this article, we have seen that it is not how hard each soldier tramp that matters (i.e. the individual risk taking), rather the tendency to synchronize
is the responsible factor in formation of collective risks. Specifically the idea of synchronization could prove relevant in a proper understanding of, for example, how systemic risks are formed in financial markets. However, the phenomenon of synchronization could well play a more general role in social interactions as well as opinion formation; examples include democratic elections[26,27], phone calls[28], email communication[29] and people clapping in phase during rhythmic applause[30].
Acknowledgments
The research leading to these results has received funding from the European Union Seventh Framework Programme (FP7-SSH/2007-2013) under grant agreement n 320270 SYRTO. This work was achieved through the Laboratory of Excellence on Financial Regulation (Labex ReFi) supported by PRES heSam under the reference ANR-10-LABX-0095. It benefitted from a French government support managed by the National Research Agency (ANR) within the project Investissements d’Avenir Paris Nouveaux Mondes (invesments for the future Paris-New Worlds) under the reference ANR-11-IDEX-0006-02.
References
1. Byrne, J. P., Miller, D. C., & Schafer, W. D. Gender differences in risk taking: A meta-analysis. Psychological Bulletin 125(3), 367-383 (May 1999).
2. Holt, Charles A., and Susan K. Laury. 2002. "Risk Aversion and Incentive Effects ." American Economic Review, 92(5): 1644-1655
3. Dwyer, P. D., Gilkeson, J. H & List J. A. Gender differences in revealed risk taking: evidence from mutual fund investors. Economics Letters 76, Issue 2, 151–158 (July 2002).
4. Powell, M. & Ansic, D. Gender differences in risk behaviour in financial decision-making: An experimental analysis. Journal of Economic Psychology 18, Issue 6, 605– 628 (November 1997).
5. Charness, G. & Gneezy, U. Strong Evidence for Gender Differences in Risk Taking.
Journal of Economic Behavior & Organization 83, Issue 1, 50–58 (June 2012).
6. Borghans, L., Golsteyn, B. H. H., Heckman, J. J., & Meijers, H., Gender differences in risk aversion and ambiguity aversion. Journal of the European
Economic Association 7, No.2/3, 649-658 (May 2009.
7. Coates, J. M. & Herbert, J. Endogenous steroids and financial risk taking on a London trading floor. Proc. Natl. Acad. Sci. 105, no. 16, 6167-6172 (2008).
8. Coates, J. M. & Page, L. A note on trader Sharpe ratios. PLoS ONE 4:e8036. doi:10.1371/journal.pone.0008036 (2011).
9. Vitting Andersen, J. & Nowak A. An Introduction to Socio-Finance. (Springer, Berlin 2013).
10.Kirman, A. Epidemics of opinion and speculative bubbles in financial markets. In: M. Taylor (Ed.), Money and Financial Markets (Macmillan, New York 1991).
11.Roszczynska-Kurasinska, M., Nowak, A., Kamieniarz, D., Solomon, S. & Vitting Andersen, J. Short and long term investor synchronization caused by decoupling.
PLoSONE 7, e50700 (2012).
12.Akerlof G. & Shiller R. Animal Spirits: How Human Psychology Drives the Economy,
and Why it Matters for Global Capitalism. (Princeton Univ. Press, Princeton, 2009).
13.Smith A., Lohrenz T., King J., Read Montague P. & Camerer C. Irrational exuberance and neural crash warning signals during endogenous experimental market bubbles.
PNAS 111, no. 29, 10503-10508 (2014).
14.Fama, E. F. Efficient capital markets: a review of theory and empirical work. Journal
of Finance 25, 383-417 (1970).
15.Hauser, O. P., Rand D. G., Peysakhovich A. & Nowak M. A. Cooperating with the future. Nature 511, 220-225 (July 2014).
16.Vitting Andersen, J. & Sornette, D. The $-game. European Physics Journal B31, 141–145 (2003).
17.Challet, D. & Zhang Y.-C. Emergence of cooperation and organization in an evolutionary game. Physica A246, 407–418 (1997).
18.Zhang, Y.-C. Modeling market mechanism with evolutionary games. Europhysics
News 29, 51–54 (1998).
19.Johnson, N. F., Hart, M. & Hui, P. Crowd effects and volatility in markets with competing agents. Physica A269, 1–8 (1999).
20.Challet, D. & Zhang, Y.-C. On the Minority Game: Analytical and numerical studies.
Physica A256, 514–532 (1998).
21.Challet, D. & Marsili, M. Relevance of memory in minority games. Physical Review E
22.Savit, R., Manuca, R. & Riolo, R. Adaptive competition, market efficiency, and phase transitions. Physical Review Letters 82, 2203–2206 (1999).
23.Tversky, A. & Kahneman, D. Judgment under uncertainty: heuristics and biases.
Science 185, 1124–1131 (1974).
24.Tversky, A. & Kahneman, D. Prospect theory: an analysis of decision under risk.
Econometrica 47, 263–291 (1979).
25.Tversky, A. & Kahneman, D. Loss aversion in riskless choice: A reference-dependent model. Quarterly Journal of Economics 106, 1039–1061 (1991).
26.Fiorina, M. P. & Abrams, S. J. Political polarization in the American public. Annu
Rev Polit Sci 11 563-588 (2008).
27.DiMaggio, P., Evans, J. & Bryson, B. Have Americans' social attitudes become more polarized? Am. J. Sociol. 102, 690-755 (1996).
28.Palla, G., Barabasi, A.L. & Vicsek, T. Quantifying social group evolution. Nature 446, 664-667 (2007).
29.Liben-Nowell, D. & Kleinberg J. Tracing information flow on a global scale using Internet chain-letter data. Proc Natl Acad Sci 105, 4633-4638 (2008).
30.Néda, Z., Ravasz, E., Bréchet, Y., Vicsek, T. & Barabási, A. L. Self-organizing processes: The sound of many hands clapping. Nature, vol. 403, 849–850 (2000).
Methods
Experimental setup. A series of 10 experiments were performed in the Laboratory of
Experimental Economics in Paris (LEEP,http://leep.univ-paris1.fr/accueil.htm) with students having at least 4 years of university studies of economics. The experiments were grouped into a series of 8 experiments each with 10 participants, 4 of the experiments with male and 4 with female participants and 2 experiments where an initial group of 20 participants (female and
male) were divided into two groups according to their risk preference. The students received 6 euros just for their presence and were in addition awarded by attending a lottery used to access the individual risk profiles of the participants[4]. The lottery had an averaged payoff of 10 euros. The final and most important part of the experiment was a financial market experiment, see Figure 4.
Figure 4 to be placed here.
Figure 4 Setup of financial market experiment. Screenshot of terminal used by the
participants showing the commonly shared information, price evolution, portfolio value as well as buy/sell buttons.
Each experiment ran over 60 time periods lasting 15 seconds each. In each time period a participant could chose to either do nothing, to buy, or to sell one share of an asset. The initial price of the asset was fixed to 5$s with an expectation of a 10cents dividend payout at the end of the 60 time periods. The participants were told that the asset was correctly priced according to rational expectations[14], that is, the price of the asset was supposed to correctly reflect all future discounted cash flow accrued to the asset. Each time period presented the students with some short (a couple of lines) general financial information taken from real financial news items obtained on Bloomberg over a two week period of time. The students were told the asset represented a portfolio of assets like an ETF or an index. They were all simultaneously presented the same information meant to reflect general financial news like e.g. bad or good U.S. employment numbers, price changes of commodities, price changes in currencies, etc. The news items were the same in all 10 experiments and had been chosen so as not to have any overall positive or negative bias. At the end of each time period the orders of the participants were gathered and a new price would be calculated based on the order imbalance
(with sign and magnitude determining direction respectively size of price movement) and shown to the participants graphically on their computer screen. Throughout the experiment the participants had a continuous update of the number of shares held and their gains/losses. The participants could borrow money to buy shares at an interest rate of zero and short selling was allowed. In the end of each of the 10 experiments a pool of 200 euros was distributed, pro rata, among the participants who had a positive gain.
Multi-agent based modeling. As a theoretical framework to understand the outcome of the
experiments we have used the $-Game[16]
which is a multi-agent agent based model that corresponds closely to the setup of the experiments. The game consists of N agents which (like the participants in the experiments) at each time period can buy, sell a share or simply do nothing. In the decision making of the agents they have at their disposal s technical analysis strategies (assigned randomly at the beginning of the game), trying to profit from the directions of the m past price trends, as well as a fundamental analysis strategy, based on the expectation of future dividends, buying when the present price is considered undervalued and selling when overvalued. Figure 2 illustrates the dynamics of the model, with prices increasing whenever there are more buyers than sellers via:
( + 1) = ( )!
"#$"%% &"'()&(*)
+,-.,&,*/ (1)
similarly to the price update used for the experiments (the liquidity was chosen as in the experiments). Figure 2 also illustrates the importance of feedback loops seen in both the experiments and the agent based simulations: as the market changes, the strategies of the participants change which in turn itself changes the market. In the $-Game the payoff function of the strategies is given by the return implied by a given decision of the strategy.