HAL Id: hal-01311576
https://hal.sorbonne-universite.fr/hal-01311576
Submitted on 4 May 2016HAL is a multi-disciplinary open access archive for the deposit and dissemination of sci-entific research documents, whether they are pub-lished or not. The documents may come from teaching and research institutions in France or abroad, or from public or private research centers.
L’archive ouverte pluridisciplinaire HAL, est destinée au dépôt et à la diffusion de documents scientifiques de niveau recherche, publiés ou non, émanant des établissements d’enseignement et de recherche français ou étrangers, des laboratoires publics ou privés.
Dominique Leguillon, M.C. Lafarie-Frenot, Y. Pannier, E. Martin
To cite this version:
Dominique Leguillon, M.C. Lafarie-Frenot, Y. Pannier, E. Martin. Prediction of the surface cracking pattern of an oxidized polymer induced by residual and bending stresses. International Journal of Solids and Structures, Elsevier, 2016, 91, pp.89-101. �10.1016/j.ijsolstr.2016.04.019�. �hal-01311576�
ACCEPTED MANUSCRIPT
Prediction of the surface cracking pattern of an oxidized polymer
induced by residual and bending stresses.
D. Leguillon1*, M.C. Lafarie-Frenot2, Y. Pannier2, E. Martin3
1
Institut Jean le Rond d'Alembert, CNRS UMR 7190, Sorbonne Universités, UPMC Université Paris 06, F-75005 Paris, France.
2
Institut Pprime, CNRS UPR 3346, ISAE-ENSMA, Université de Poitiers, F-86962 Futuroscope Chasseneuil, France.
3
Laboratoire des Composites Thermo-Structuraux, CNRS UMR 5801, Université de Bordeaux, F-33600 Pessac, France.
* Corresponding author: dominique.leguillon@upmc.fr
Abstract. The objective of the paper is to analyze four point bending tests performed on
samples of an epoxy-type thermoset polymer oxidized under several conditions, and to predict the failure mechanisms. Different responses are observed depending on the oxidation time: for small durations there is a linear elastic phase followed by an abrupt failure of the specimen whereas for higher oxidation times, the elastic phase is followed by a nonlinear one corresponding to the development of numerous superficial micro-cracks prior to failure. In order to predict this behavior, a finite fracture mechanics approach based on the coupled criterion is used. This criterion requires an energy and a stress condition to be fulfilled. This approach is here extended to take into account the gradient of properties of the oxidized layer: Young‟s modulus, tensile strength, toughness. One novelty of the approach is to implement the model in a periodic representative cell in order to process an increasing number of cracks. Despite the large scattering in the experimental detection of the initiation of the micro-cracks and their counting, the predictions agree rather well with the observations: the oxidation times leading either to a sudden failure of the sample or to micro-cracking are well reproduced, and
ACCEPTED MANUSCRIPT
the loads triggering the crack onset as well as the increase in number of cracks are somewhat well predicted.
1. Introduction
The use of fiber reinforced polymers is becoming more common in transportation industries, particularly in the manufacture of aircrafts. The weight ratio of composites is more than 50% in the two recent aircrafts Boeing-B787 and Airbus-A350. For similar performances, composites offer a substantial gain in weight that leads to a reduction in fuel consumption with all the well-known positive economic and ecological consequences. In return the polymers, used as a binder, suffer from an ageing phenomenon that alters their properties with time and that must be perfectly controlled for safety reasons. Three main sources for this ageing: the action of humidity, UV rays and oxidation. This work focuses on the latter mechanism that damages the exposed surfaces and that can even lead to cracking (Colin et al., 2005; Verdu, 2012). Therefore, it is important to quantitatively estimate this damage for having a better knowledge of the influence of the degradation on the composite performance (Vu et al., 2012; Vu et al., 2013; Daghia et al., 2015).
Several studies have been conducted on the behavior of the PR520 resin (Cycom, 2014), a polymer used in the aircrafts industry (Fard et al., 2014; Pecora, 2014; Pecora et al., 2016), both on the pristine and the oxidized material. They show that it is difficult to estimate the mechanical properties of the oxide as a function of the oxidation time, especially because, due to a large scattering, it is tricky to interpret tests on thin films supposed to be homogeneously oxidized. Thus measures must be carried out on thick specimens undergoing gradients of properties. This is accentuated when addressing the fracture properties: it is known that the material becomes more brittle with oxidation but it is virtually impossible to evaluate the tensile or flexural strength as well as the toughness, function of the oxidation time. In (Pecora, 2014) and (Pecora et al., 2016) 4-point bending tests are carried out, up to failure, on specimens after a controlled oxidation at 120 °C, either in air or in O2 pressurized atmosphere
at 3 bars. In the context of oxidizing thermomechanical loading of Carbon/epoxy composite laminates, some attempts have been done to identify the matrix toughness reduction with oxidation level through a micro-damage model (Lubineau et al., 2006; Lubineau et al., 2009). An interesting and challenging feature is that for low oxidation times samples failed abruptly after a linear elastic phase, whereas micro-cracking and non-linearity appear prior to failure for longer oxidation times.
ACCEPTED MANUSCRIPT
Micro-cracking is a complex phenomenon that has been more often studied in thin films bonded to a substrate (Laws and Dvorak, 1988; Nairn, 1989; Xia and Hutchinson, 2000, Kim and Nairn, 2000; Fu et al., 2013). Unlike the present case, the crack length is known (the thickness of the thin layer) and the problem is much easier to address. Micro-cracking is also observed during quenching of ceramics (Shao et al., 2010; Bahr et al., 2010; Jiang et al., 2012) or in drying processes (Jenkins, 2009; Maurini et al., 2013; Leguillon, 2013; Leguillon et al., 2014).
In the present case the situation is a little more intricate because surface micro-cracking occurs in a material with a gradient of properties through the oxidized layer. The model we proposed is based on the coupled criterion (CC) (Leguillon, 2002; Leguillon and Yosibash, 2003; Martin and Leguillon, 2004) which enters the framework of Finite Fracture Mechanics (see the review paper by Weissgraeber et al. (2015) for an extended list of references in the topic). It requires the knowledge of both the tensile strength and the toughness of a material to predict the onset of a new crack at stress concentration points. In order to take into account multiple cracks, it is implemented in a cell that is assumed to be representative of the whole cracked domain by periodic repetition. A major obstacle to overcome is the lack of knowledge of the mechanical parameters through the oxidized layer.
The first section presents the ageing process and the experiments carried out up to failure on polymer specimens. It shows known material parameters and the way they vary as functions of the oxidation time and the depth in the oxide layer, together with some assumptions made to overcome the unknowns. The next section is dedicated to an extension of the CC to materials with a gradient of properties. The numerical model based on the representative periodic cell is explained in the next section. It is followed by a first group of numerical results dedicated to long oxidation times and another one devoted to smaller oxidation times. A full FE simulation of the 4-point bending test is carried out for comparison on the onset of the first crack. A conclusion completes this work.
2. Material properties and experiments
Material, techniques and experimental conditions
The studied material (Cycom PR520) is an epoxy-type thermoset polymer, processed according to the parameters suggest by the supplier (Cycom, 2014). Complete curing of the material has been checked through DSC analysis leading to a glass transition temperature equal to 160°C. Specimens have been cut according to the geometry prescribed for a standard
ACCEPTED MANUSCRIPT
4-point bending test (L=120mm, l=10mm, h=3.5mm), and aged in an isothermal environment, at 120°C, under neutral or oxidizing gaseous atmospheres (respectively N2 and O2), for
different durations (Table 1).
Table 1. Ageing conditions for PR 520 samples.
Environment Pressure (bar) Duration (h) Temperature (°C)
Nitrogen (N2) 3 200 120
Oxygen (O2) 3 100 / 200 / 400 / 600 120
The change in local elastic properties of the resin, due to thermo-oxidation, was characterized by Ultra-Micro-Indentation tests: the indentation elastic modulus (EIT) evolution was
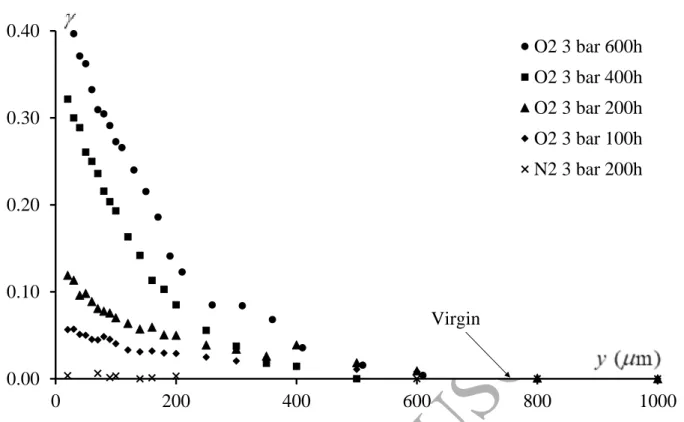
followed along the thickness of the specimen, from the surface exposed to the environment towards the sample core according to the protocol set up (Ho et al. 2006, Olivier et al., 2008). In Figure 1, the results of indentation tests are presented. Elastic indentation modulus (EIT) values have been normalized compared to that of the virgin material. So an oxidation tracer has been defined as
measured virgin EIT 1 EIT
The mean value of EITvirgin for the non-oxidised resin has been evaluated from 140 measures,
and each point of the graphic in Figure 1 tallies with the average value of a twelve-measure series, realised at the same distance from the external surface in contact with environment. To better understand the figure, the error associated with the average values is not represented on the graphic. Nevertheless, the error, evaluated through statistical analysis, is less than 1%.
ACCEPTED MANUSCRIPT
Figure 1. Elastic indentation module profiles (oxidation tracer ) for PR520 samples aged at 120°C for different durations, under neutral (3 bar N2) and oxidizing (3 bar O2) environments.
In Table 2, the characteristics of the oxidized layers for the considered ageing conditions are summarised. The indentation module variation, EIT (%), is the value of the parameter at a distance from the external surface of 30 μm, and the oxidized layer depth is defined as the zone size for which values are higher than 1%.
Table 2. Elastic indentation module variation and depth of the oxidized layer for different resin specimens, aged at 120°C in neutral and oxidizing environments.
Ageing conditions N2 200h O2 100h O2 200h O2 400h O2 600h
EIT variation (%) 0 5,7±1 11,3±0,9 26,3±0,6 40±0,6
Thickness of oxidized layer (µm) 0 475±50 600±75 700±100 750±100
In Figure 1 and in Table 2 it can be observed that ageing in a Nitrogen environment does not change the elastic behaviour of the material. On the other hand, during the ageing in oxygen, a gradient of properties develops between the virgin core and the external surface, in an oxidized layer whose dimension and module variation amplitude evolve according to
0.00 0.10 0.20 0.30 0.40 0 200 400 600 800 1000 O2 3 bar 600h O2 3 bar 400h O2 3 bar 200h O2 3 bar 100h N2 3 bar 200h Virgin
ACCEPTED MANUSCRIPT
exposure time. These local mechanical behaviour changes appear similar to those of other epoxy resins (Olivier et al., 2008; Lafarie-Frenot et al., 2010).
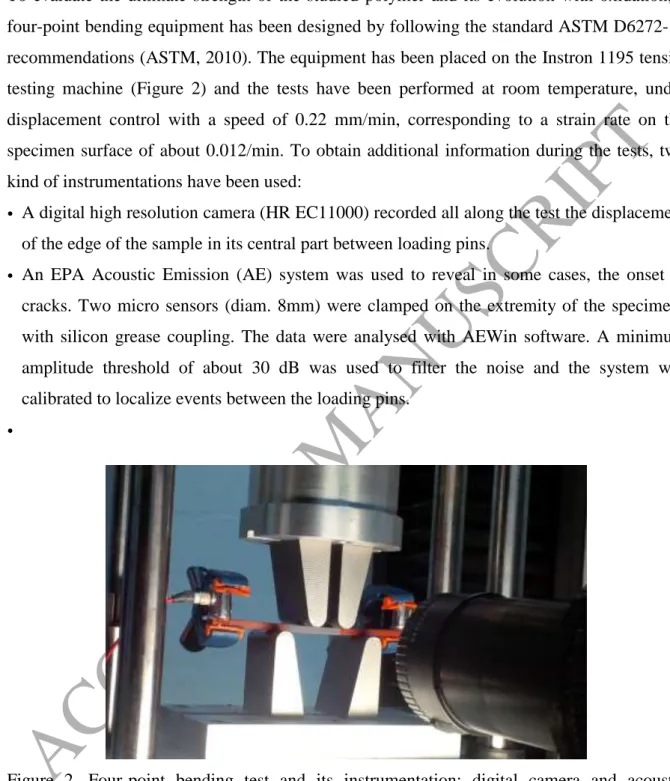
To evaluate the ultimate strength of the studied polymer and its evolution with oxidation, a four-point bending equipment has been designed by following the standard ASTM D6272-10 recommendations (ASTM, 2010). The equipment has been placed on the Instron 1195 tensile testing machine (Figure 2) and the tests have been performed at room temperature, under displacement control with a speed of 0.22 mm/min, corresponding to a strain rate on the specimen surface of about 0.012/min. To obtain additional information during the tests, two kind of instrumentations have been used:
• A digital high resolution camera (HR EC11000) recorded all along the test the displacement of the edge of the sample in its central part between loading pins.
• An EPA Acoustic Emission (AE) system was used to reveal in some cases, the onset of cracks. Two micro sensors (diam. 8mm) were clamped on the extremity of the specimens with silicon grease coupling. The data were analysed with AEWin software. A minimum amplitude threshold of about 30 dB was used to filter the noise and the system was calibrated to localize events between the loading pins.
•
Figure 2. Four-point bending test and its instrumentation: digital camera and acoustic emission.
Experimental results
For each ageing condition, from 3 to 5 samples have been tested in bending (Figure 3) which have shown a very good reproducibility, except on the values of strain at failure. In parallel,
ACCEPTED MANUSCRIPT
an enhanced beam model (EBM) was used to express the stresses along the tensile surface of the specimens. This improved model was developed in order to take into account the gradient of the Young modulus in the oxide layer (Pecora et al., 2016).
Figure 3. Schematic view of the 4-point bending test, due to symmetry only one half of the specimen is shown.
It has been observed that the virgin material has a non-linear behaviour beyond a maximum bending strain of 3% and that its failure strain is around 6% (corresponding to a failure stress of 187 ± 8 MPa according to the EBM). Moreover, an embrittlement of all oxidized specimens could be noticed: their failure bending strain is always less than 3%, and reach around 1% for highly oxidized specimens. Besides, it could be observed that the specimens aged 400h and 600h under 3 bars of oxygen exhibit a slightly non-linear behaviour consisting in a small decrease in stiffness before their ultimate failure. Contrarily to the other samples that failed suddenly, these highest oxidized samples have been concerned by a multi-cracking phenomenon: several cracks were observed in the lower part of the bent specimens, as shown in Figure 4, either on in-situ observations (Figure 4a), or on X-ray tomography pictures taken after the bending test (Figure 4b). These pictures show that cracks have almost the same length along the thickness, that they cross the entire width of the sample and are regularly distributed in the cracked zone.
ACCEPTED MANUSCRIPT
a- in-situ observation b- RX tomography picture
Figure 4. Multi-cracking phenomenon observed on PR520 resin aged at 120°C for 400h under 3bar O2.
In addition, this multi-cracking phenomenon has been observed and monitored during the whole bending tests, by counting cracks visually on in-situ photographs of the specimen side and by recording acoustic emission. From these data, the number of cracks has been evaluated for many specimens and plotted in Figure 5 vs. the maximum bending strain, according to the duration of ageing (400h or 600h under 3 bar of oxygen).
0 5 10 15 20 25 0 0.005 0.01 0.015 S 26 EA S 26 visu S 24 EA S 24 visu S 33 400 visu S 33 400 EA S 1 400 visu S 4 400 visu number of cracks
ACCEPTED MANUSCRIPT
Figure 5. Number of cracks visually measured (open symbols) or number of acoustic events (solid symbols) as function of the maximum bending strain in PR520 aged at 120°C under 3bar O2 during 400h (red), 600h (black). S XX denotes the specimen number.
Material parameters for the simulations
The mechanical parameters of the sound material (i.e. prior to any oxidation phenomenon) are given by the manufacturer data sheet (Cycom, 2014): Young‟s modulus E4000 MPa, Poisson‟s ratio 0.4, tensile strength c 82 MPa, flexural strength f 153 MPa,
toughness GIc 1400 J m-2, Weibull‟s modulus m16 (Fard et al., 2014).
Now, as already mentioned in the introduction, the main challenge is to know how the material parameters mentioned above evolve during the oxidation process through the oxidized layer. The thickness of the oxide layer is given in Table 2. Young‟s modulus changes (Figure 6) are supposed to be proportional to that of the EIT (Figure 1) and Poisson‟s ratio is assumed to remain unchanged. It is observed that Young‟s modulus almost linearly increases with the ageing time t . ox
3000 3500 4000 4500 5000 5500 6000 0.00 0.25 0.50 0.75 1.00 E (MPa) y (mm)
ACCEPTED MANUSCRIPT
Figure 6. Approximation Young‟s modulus E changes in the oxide layer function of the depth y for different values of the oxidation duration t . ox
The changes in the tensile strength have been estimated from the load at failure in the 4-point bending tests, using the EBM. It exhibits a dramatic drop (Pecora et al., 2016). However, it must be pointed out that the provided values correspond to the flexural strength whereas it is the tensile strength that is involved in the CC. It is claimed in (Leguillon et al., 2015a) that the tensile strength is the only material parameter, the flexural strength depending on the thickness of the specimens on which measures are done. These values must be corrected twice to recover the tensile strength: a correction deriving from the CC and a correction due to the Weibull statistics, both depending on the thickness. Although Weibull‟s modulus is known for the pristine material it remains unknown otherwise, it is probably smaller in the more brittle oxide layer. It was therefore decided to take the initial value (t = 0 h) provided by the ox
manufacturer and then apply the same rule of proportionality as that found in (Pecora et al., 2016) (Table 3). The distribution through the oxide layer is shown in Figure 7.
The evolution of the toughness G is definitely unknown, different attempts have been made Ic
to better match the observations as shown later (Table 3). The assumed distribution through the thickness of the oxide layer is depicted in Figure 8. Again there is a dramatic drop as can also be observed in (Han and Nairn, 2003) but in a different context (hydrothermal ageing) and a different material which only allow qualitative comparisons.
Table 3. Tensile strength and toughness functions of the oxidation time.
Ageing conditions O2 0 h O2 200 h O2 400 h O2 600 h
c
(MPa) 82 23.2 15.6 14.0
Ic
ACCEPTED MANUSCRIPT
Figure 7. Assumed tensile strength c changes in the oxide layer function of the depth y for different values of the oxidation time t . ox
0 20 40 60 80 0.00 0.25 0.50 0.75 1.00 y (mm) 0 400 800 1200 1600 0.00 0.25 0.50 0.75 1.00 y (mm)
ACCEPTED MANUSCRIPT
Figure 8. Assumed toughness G changes in the oxide layer function of the depth Ic y for different values of the oxidation time t . ox
3. The coupled criterion
The failure or the multi-cracking occurring during the 4-point bending tests are crack nucleation mechanisms. The Griffith criterion usually used in brittle fracture mechanics does not work, it can only be applied to the crack growth from a pre-existing crack. There are two conventional alternatives: the cohesive zone models and the CC (Cornetti, 2016; Martin et al., 2016). It must be pointed out that in both cases, two fracture parameters are required, they are either the peak stress and the critical opening in the former case or the tensile strength and the toughness in the latter. The formers are well-known in computational mechanics but lead to solve non-linear problems with the inherent convergence difficulties. In the present work we have selected the second approach. The CC states that two conditions must be fulfilled to predict crack nucleation: an energy condition and a stress one (Leguillon, 2002). To be implemented, only a given number of linear systems are solved.
The energy condition
The first condition derives from a basic energy balance between an uncracked initial state and a final state containing a crack of length a . In a homogeneous material it can simply be
written
P(0) P( ) Ic
W W a G a (1)
Where W a is the potential energy of the cracked structure and the right hand side member P( ) is the energy dissipated to create a crack of length a , G (J mIc
-2
) is the toughness of the material. Note that in this 2D framework the thickness of the specimen is omitted. The right hand side member can be expressed in term of the energy release rate G
P P P 0 ( ) (0) ( ) a ( )d with ( ) W y W W a G y y G y y
(2)ACCEPTED MANUSCRIPT
In the oxide layer the toughness G varies, it is a function of the depth Ic y and the right hand side member of (1) must be modified as follows
Ic 0 ( )d
a
G y y
So that the final formulation of the energy condition is
P(0) P( ) 0 Ic( )d a W W a
G y y (3) It is conveniently rewritten P P inc Ic Ic Ic 0 (0) ( ) 1 ( ) ( ) with ( ) a ( )d W W a G a G a G a G y y a a
(4)The function Ginc( )a is called the incremental energy release rate as opposed to the differential energy release rate defined in (2). Note that, using (2), the expression (4) can be remarkably simplified in Ic 0 1 ( ) ( ) with ( ) a ( )d G a G a G a G y y a
But this inequality is misleading. It might suggest an empirical weak form of the Griffith criterion involving averages, while it is physically based as explained above. Moreover, the energy condition is employed under the form (4) in the forthcoming calculations without direct references to ( )G a .
The stress condition
The stress condition involves the tensile strength c of the material and states that the
following stress condition (5) must be fulfilled, prior to fracture, all along the presupposed crack path of length a
c
( )y for 0 y a
ACCEPTED MANUSCRIPT
Where ( )y is the tensile component of the stress field acting on the presupposed crack path. In the domain of applicability of the CC, it is a non-increasing function of y and then (5) reduces to
c
( )a
(6)
Which looks like a point stress condition although it expresses the non-local condition (5). The simplified formulation (6) is permitted only in homogeneous materials where c is a material constant. In the oxide layer, c exhibits a gradient and the condition (5) must be written
c
( )y ( ) for 0y y a
(7)
In the present case, it is observed that c( )y is a non-decreasing function of y (see the next section) and together with the non-increasing function ( )y , (7) simplifies in
c ( )a ( )a
(8)
The coupled criterion
In order to plot the two conditions (4) and (8) in the same diagram, they are expressed in a dimensionless form inc Ic c ( ) ( ) 1 and 1 ( ) ( ) G a a G a a (9)
The main difference with a standard situation is that all the parameters depend on a , not only
the incremental energy release rate G and the tensile stress inc as usual, but also the material parameters G , Ic GIc and c.
Whenever possible, using asymptotic expansions to calculate the change in potential energy (Leguillon, 2002) shows that, in most general cases, fulfilling the inequality (3) implies a
ACCEPTED MANUSCRIPT
crack jump at onset and a finite lower bound a of admissible crack lengths can be derived as 0
a function of the applied load, hence the term Finite Fracture Mechanics due to Hashin (1996). In the same way, the second inequality (6) or (8) provides an upper bound of the admissible lengths. The combination of (3) and (6) or (8) leads to a unique determination of the initiation length a and the load intensity at failure, which is the CC principle. 0
Once the crack is initiated and using the same dimensionless formulation as (9), the condition for crack growth is the well-known Griffith criterion
Ic ( ) 1 ( ) G a G a (10)
4. The numerical model
A weight loss and a chemical shrinkage are accompanying the parameters changes during the ageing process. As a consequence, residual stresses arise, the surfaces are in tension and are balanced by a compression in the core of the specimen. They are calculated using Finite Elements (FE) by adjusting the parameters of a linear thermo-elastic model in order to match with the residual stresses described in (Pecora, 2014; Pecora et al., 2016) (Figure 9).
-5 0 5 10 15 20 25 0.00 0.25 0.50 0.75 1.00 y (mm) (MPa)
ACCEPTED MANUSCRIPT
Figure 9. Tensile component of the residual stress ch in the oxide layer function of the depth y for different values of the oxidation time t . ox
It is observed in the experiments that this tension is not large enough to trigger spontaneous surface cracking. However, it can be already noted that this holds true despite the fact the tensile stress along the surface is larger than the tensile strength for tox 600h (Table 3 and
Figure 9), as predicted by the CC as will be seen further.
Then, the specimens are submitted to a 4-point bending load up to failure and different results arise according to the oxidation time t . As already claimed, for the pristine material and for ox
ox 200h
t , there is an almost linear elastic phase followed by an abrupt failure. For
ox 400h
t and tox 600h, a non-linear phase follows the first elastic one, it corresponds to the onset of an increasing number of surface micro-cracks, the final failure is thus delayed. Our model is focused to best match with these different mechanisms. For this, it has to take into account a large number of small cracks and predict their spacing. To this aim, the active part of the specimen (i.e. between the two inner loading pins) is represented as a periodic sequence of representative cells (RC) (Figure 10). The length d of the cell is an unknown
parameter denoting the cracks spacing. For symmetry reasons, the FE calculations are carried out on one half of the RC.
Figure 10. The part of the specimen between the two loading pins and the representative cell.
As already mentioned, the chemical shrinkage is computed using a linear thermo-elastic model by adjusting the parameters to the experimental
Figure 11. The two loading modes of the RC to simulate the residual stresses.
ACCEPTED MANUSCRIPT
measures. In particular, it must not be forgotten that the shrinkage depends on the level of oxidation and is therefore variable through the thickness of the oxide layer.
Within one half of the RC, the residual stresses are assumed to be the sum of a thermo-elastic like problem with zero horizontal displacements on the left boundary (Figure 11a), and a mechanical loading with prescribed horizontal displacements on the same boundary (Figure 11b), such that the sum of the resultant forces vanishes. In both cases, symmetry conditions hold on the right boundary and the above and bottom ones remain stress free. The displacement field is denoted Uch (the index „ch‟ holds for chemical). Without crack, comparing with a complete calculation on a full specimen, this approximation proved to be very good in the active part of the specimen (more precisely, except in a vicinity of the two ends of the specimen).
The effects of bending on the RC are simulated by prescribing a rigid rotation proportional to d/ 2 on the left boundary (Figure 12a). Within the small strains assumption, it amounts to simply impose appropriate horizontal displacements, the corresponding displacement field is denoted Ube („be‟ for bending). Due to the lack of vertical symmetry when there is a crack along the symmetry axis, the non-zero resultant force must be balanced by a prescribed horizontal displacement (Figures 11b and 12b). Again, symmetry conditions hold on the right boundary and the above and bottom ones remain stress free.
A multiplier f modulates the results in function of the intensity of the applied bending load so that the elastic solution can be written f Ube. This model was sketched in the study of the formation of crack patterns in functionalized thin films (Leguillon et al., 2014).
Since all the material parameters vary through the thickness of the oxide layer, only a full FE calculation can be used to implement the CC, the asymptotic expansions are out of reach. Let us recall that this criterion requires the two conditions (9) to be fulfilled and this allows determining the a priori unknown initiation length of the crack. To this aim, a crack which length is half the thickness of the specimen is inserted along the symmetry axis of the half RC and this length is varied by buttoning the nodes. At each step, the potential energy W a P( ) stored in the structure is computed as a function of the crack length a
Figure 12. The two loading modes of the RC to simulate the bending.
ACCEPTED MANUSCRIPT
(
in
P RC 1 ( ) : d 2 W a
vWhere and denote respectively the stress and the strain tensor, and where in is the inelastic strain caused by the chemical shrinkage. The integral is calculated on the RC.
Once all the nodes are buttoned, there is no longer any crack, the tensile stress ( )y along the presupposed crack path (the symmetry axis) is calculated as a function of the depth y.
The number of linear systems to be solved thus equals the number of nodes to be buttoned along the virtual crack, there are 50 nodes in the present simulations. Whenever matched asymptotic expansions are available, solving only 2 linear systems is required, one for the so-called outer problem and the other for the inner one (Leguillon, 2002).
5. A first group of numerical results for tox 600 hand tox 400 h
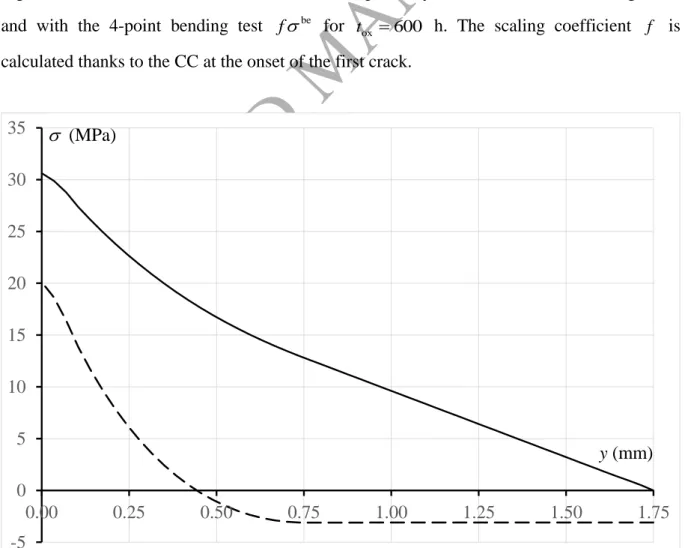
Figure 13 show the tensile stresses associated respectively with the chemical shrinkage ch and with the 4-point bending test fbe for tox 600 h. The scaling coefficient f is calculated thanks to the CC at the onset of the first crack.
-5 0 5 10 15 20 25 30 35 0.00 0.25 0.50 0.75 1.00 1.25 1.50 1.75 (MPa) y (mm)
ACCEPTED MANUSCRIPT
Figure 13. The elastic tensile stress be
f (solid line) and the residual stress ch
(dashed line), function of the depth y in the specimen for tox 600 h. The coefficient f is calculated such that the elastic solution f Ube corresponds to the onset of the first crack.
As already claimed, the total tensile stress ch fbe on the outer surface (the sum of the two components in Figure 13) at failure is widely above the tensile strength as a result of applying the CC that is, it must be remembered, a non-local criterion (see Figure 14).
Figure 14. The CC at onset of the first crack for tox 600 hand d12 mm: dimensionless tensile stress ( ) /a c( )a (solid line), incremental energy release rate inc
Ic ( ) / ( )
G a G a
(dashed line) and energy release rate G a( ) /G aIc( ) (dotted line) (dimensionless data).
In Figure 14 the initiation length a0 0.26mm derives straightforwardly from the CC (conditions on (a0) /c(a0) 1 and
inc
0 Ic 0 ( ) / ( ) 1
G a G a according to (9)). It is an arrest length because at this point G a( 0)GIc and G y( ) is a decreasing function.
0.0 0.5 1.0 1.5 2.0 0.00 0.25 0.50 0.75 1.00 a0 y (mm)
ACCEPTED MANUSCRIPT
As previously reported, the toughness G aIc( ) was adjusted in order to match with the experimental observations. In Figure 14, it is such that, at the surface GIc(0)50J m-2, if it is smaller, GIc(0)25J m-2, the load at onset is decreased by 12% and a drops to 0.21 mm; 0
whereas if the toughness is larger, GIc(0)100J m-2, then the load at onset is increased by 17% and a moves to 0.28 mm. 0
Figure 14 is drawn for d12 mm, but among the unknowns is the spacing between cracks.
Figure 15 shows the elastic stress fbe at the occurrence of a first crack for different values of the size d of the RC. Obviously, above d/ 26 mmthere is no longer any significant variation, the curve starts to increase below this value. The loading being monotonic, this means that the minimum spacing between cracks at the first appearance is around 12 mm. The inner span being 16 mm (Figure 10), a single crack appears first (see also the remark at the end of section 5).
To sum up, this single crack appears for ch be
20.9 29.4 50.3 MPa
f
, to be
compared to 417 MPa found in the experiments (Pecora et al., 2016). The prediction is slightly above the measured value, but it is still satisfying given the uncertainties on the fracture parameters of the oxide and the large scattering on the appearance of the cracks. Indeed, it is often observed that the first one does not appear in the active zone of the specimen but under one of the loading pin, due to the stress field induced by complex contact conditions. The followings appear as expected in the active zone.
ACCEPTED MANUSCRIPT
Figure 15. The elastic tensile stress be
f at the onset of the first crack function of the size d of the RC for tox 600 h.
After the occurrence of the first crack, when increasing the load, conditions for new subdivisions can be met. To model this mechanism, the RC is modified as shown in Figure 16. A short crack of length a is a
inserted along the left boundary of the RC, thus according to the periodicity conditions the spacing between the new set of cracks is
/ 2
d (Figure 16b), and the analysis (buttoning nodes) is carried out on the crack located as before along the symmetry axis. By reducing at each step the half length d/ 2 of the RC, similar RC can be used for successive subdivisions. The results are shown in Table 4 in terms of fbe. The displayed values are those which would prevail in the absence of micro-cracking but associated with the current value of f . They are directly proportional to the
0 5 10 15 20 25 30 35 40 0 3 6 9 d/2 (mm)
Figure 16. (a) The half of the RC used to determine the occurrence of the first crack, (b) the half of the RC used for the analysis of further subdivisions.
ACCEPTED MANUSCRIPT
applied load and thus can be compared to the values proposed in (Pecora et al., 2016) and calculated from the load at failure using the improved beam theory.
Table 4. Elastic tensile stress fbe at the appearance of the successive cracks for tox 600 h.
First crack First sub. Second sub. Third sub.
be
f (MPa) 29.4 31.9 34.1 46.5
Resulting crack spacing (mm) 12 6 3 1.5
It is then possible to compare the predicted number of cracks according to the above procedure with the number of cracks experimentally observed (Figure 17). To this aim, the elastic strain was extracted from the FE computations parallel to the tensile stress be
.
Figure 17. Comparison between predicted (CC, solid line) and experimental (symbols) number of cracks function of the elastic strain for tox 600h.
The good agreement between predictions and experimental data is quite encouraging. A large part of the observed gap could be attributed to the variability of the fracture parameters according to the Weibull statistics. Note that the final failure is difficult to predict because it
0 5 10 15 20 25 0 0.005 0.01 0.015 S 26 EA S 26 visu S 24 EA S 24 visu CC number of cracks
ACCEPTED MANUSCRIPT
should be necessary to take into account the simultaneous growth of all the cracks when the load increases, and this is not easily allowed by the current computations based on the RC. The last point of the solid line in Figure 17 is estimated from the growth of a single crack, it necessarily underestimate the actual value, since additional cracks tend to shield the primary one. An explanation will be given further in Section 6 on the arrest lengths, if any. Indeed, at this stage, the model does not control the growth of existing cracks. This could be partially improved assuming they all have the same length and they grow in the same way, which makes it possible to use the periodic pattern.
For tox 400 h, an analogous reasoning leads to similar results, although with a somewhat less good agreement with the experiments which seem however to be a little more scattered and less consistent (Figure 18). The first crack is found to appear for ch fbe 10.1 + 40.5 = 50.6 MPa and the arrest length is aa 0.35mm.
Figure 18. Comparison between predicted (solid line, CC) and experimental (diamonds) number of cracks function of the elastic strain for tox 400 h.
0 5 10 15 20 25 0 0.005 0.01 0.015 S 33 EA S 1 visu S 4 visu S 33 visu CC number of cracks
ACCEPTED MANUSCRIPT
The choice of the onset of the first crack for d/ 26 mm may seem arbitrary because the curve in Figure 15 is very slowly growing between d/ 26 mm and d/ 23 mm but in the end if one chooses d / 2 = 3 mm instead of 6 mm then 2 or 3 cracks may simultaneously appear and the final result in Figures 17 and 18 does not hardly change.
6. A second group of numerical results for tox 200 hand tox 0 h
Before going further in the
presentation of the results, a few words must be added on the definition of the crack arrest lengths. Let us assume that, there is a new crack of length a0, as predicted by the CC. Often at this pointGGIc (Figure 19), then, according to the Griffith criterion, the crack goes on growing in an unstable manner. Usually, the arrest length aa, if any, is defined by: G a( a)GIc and G a( )is a decreasing function (for the sake of simplicity, in a first step GIc is assumed constant). But obviously, at this point there is an excess energy corresponding to surface 1 (Figure 19). In an elastic body this excess energy can be dispersed by kinetic energy, acoustic waves… However, a part or the whole excess energy can also be dissipated in fracture (surface 2 in Figure 19), then aA is defined by
(
A 0 inc Ic A Ic ( ) d 0 ( ) a a G y G y G a G
The two lengths aa and aA define respectively a lower and an upper bound of the crack arrest lengths. This property holds also true if G varies with the depth Ic y, replacing G with Ic
Ic( A) G a
(
A 0 inc Ic A Ic A ( ) ( ) d 0 ( ) ( ) a a G y G y y G a G a
Figure 19. Definition of the bounds and of the crack arrest lengths.
ACCEPTED MANUSCRIPT
It can be observed in Figure 14 that the two arrest lengths aa and aA (i.e. the two bounds) merge since a0aa aA.
For tox 200 h (Figure 20) and tox 0 h (Figure 21), arrest lengths aa and aA are out of the framework of the figures limited to a depth y1 mm. This can be interpreted in both case as an abrupt failure.
Figure 20. The CC at failure for tox 200 h and d12 mm: tensile stress ( ) /a c (solid line), incremental energy release rate inc
Ic ( ) /
G a G (dashed line), energy release rate
Ic
( ) /
G a G (dotted line) (dimensionless data). 0.0 0.5 1.0 1.5 2.0 0.00 0.25 0.50 0.75 1.00 a0 y (mm)
ACCEPTED MANUSCRIPT
Figure 21. The CC at failure for tox 0 h and d12 mm: tensile stress ( ) /a c (solid line), incremental energy release rate inc
Ic ( ) /
G a G (dashed line), energy release rate
Ic
( ) /
G a G (dotted line) (dimensionless data).
The limit of the abrupt failure is between tox 300 h and tox 350 h. This does not mean that multi-cracking occurs above this limit, but that the new crack is arrested until the applied load increases (aa 0.56 mm,aA 0.66 mmfor tox 350 h, Figure 22) leading further either to an abrupt failure or to multi-cracking.
0.0 0.5 1.0 1.5 2.0 0.00 0.25 0.50 0.75 1.00 a0 y (mm)
ACCEPTED MANUSCRIPT
Figure 22. The CC at failure for tox 350 h and d 12 mm: tensile stress ( ) /a c (solid line), incremental energy release rate inc
Ic ( ) /
G a G (dashed line), energy release rate
Ic
( ) /
G a G (dotted line) (dimensionless data). The initiation length a and the two bounds 0 a a
and aA of the arrest length are distinct.
It must be noted that it is ambiguous to plot such curves (Figures 14, 20 and 21) for larger cracks because the kinematic model of bending illustrated in Figure 12 is less and less adequate for longer cracks.
7. A full FE simulation of the 4-point bending test
Predicting the nucleation of the first crack, leading to an abrupt failure or not, can also be done by performing an exact simulation of the 4-point bending test (Figure 3) and applying the CC to the entire structure as done for instance in (Leguillon et al., 2015b). A summary of the results is proposed in the following Table 5.
0.0 0.5 1.0 1.5 2.0 0.00 0.25 0.50 0.75 1.00 a0 y (mm) aa aA
ACCEPTED MANUSCRIPT
Table 5. Summary of strain and tensile stresses C
and on the surface in tension during the 4-point bending loading, at onset of the first crack for different oxidation time t , as ox
predicted by the CC using the periodic pattern (Per.) and a full FE simulation of the 4-point bending test (FE). Comparison with data and experimental measures (Pecora et al., 2016).
ox t (h) 0 200 400 600 (%) per. 2.5 1.5 0.8 0.6 (%) f 4-p 2.5 1.3 0.9 0.8 ch (MPa) 0 5.0 10.1 20.1 (MPa) Per. 100.6 70.7 50.5 50.7 (MPa) FE 100.3 72.7 56.2 62.9 exp (MPa) 153 # 189 6 50 4 35 3 41 7
Experimental values are obtained from the measured load at failure using an improved beam model (Pecora, 2014; Pecora et al., 2016). In the first row tox 0 h, exp in bold corresponds to the flexural strength found in the manufacturer data sheet, the experimental measure is beside. If we take into account the experimental dispersion, the last exp data (3rd and 4th rows) seems to converge to the same value.
To complete this analysis, it would be difficult to envisage the successive divisions leading to a significant numbers of new micro-cracks whose growth must be analyzed separately. However this could still be addressed, at a considerable numerical effort, as shown in (Li and Leguillon, 2016).
8. Conclusion
It is difficult to get values of the mechanical parameters: Young‟s modulus, Poisson‟s ratio, toughness and tensile strength, in the oxidized layer of a polymer sheet. Reliable values of the Young modulus can be obtained from indentation tests in the thickness for different ageing conditions. Poisson's ratio does not pose a major problem, its influence is small and it can be considered as constant through the thickness for any ageing condition. Unfortunately, it is also necessary to have accurate values of the toughness and the tensile strength to predict the onset of cracks on the surface and their growth in the layer using the CC (note that the same problem arises using CZM). Some flexural strength, or at least the state of stress prevailing on
ACCEPTED MANUSCRIPT
the surface at the instant of crack nucleation, can be derived from an improved beam theory, for different ageing conditions. But this does not provide much information on how this parameter varies in the thickness of the oxide layer. In addition, there is absolutely no information on the way the toughness changes, both through the thickness and for different oxidation time. The only available qualitative remark is that the oxide is more brittle.
Despite these partial data, we attempted to develop a model for predicting the formation of crack patterns on the surface of oxidized polymer specimens subjected to a 4-point bending loading. It is based on the Finite fracture Mechanics concept and the CC. In agreement with the experiments, this model has allowed predicting that the samples break abruptly for low oxidation times (i.e. tox 350 h). For longer oxidation time, multi-cracking appears on the
surface of the specimen and the model describing the number of cracks as a function of the applied load is quite encouraging. This is especially true, considering the wide scattering existing first when determining experimentally the onset of the first micro-crack, and then when counting the number of these small cracks.
There is an approximate agreement between the measured strains and stresses and the calculated ones. Indeed, the trends are the same and the orders of magnitude are well met but it is difficult to go into more details. Once again, the uncertainties on the data can be invoked. Moreover, the theoretical model based on computations performed on a simple RC is well suited to the simulation of multi-cracking but remains an approximate model with its own weaknesses. In particular, the quality seems to degrade for high oxidation times, i.e. for thick oxide layers and strongly changed Young‟s modulus. This is due to the fact that in the RC model cross sections are supposed to keep straight (the only assumption that agrees with the periodicity hypothesis) which is not entirely accurate, warping may be due to the varying value of the Young modulus in the oxide layer and to the presence of cracks that disturb the horizontal symmetry. Indeed such periodic conditions agree with an infinitely long structure made of an indefinite repetition of the RC.
Acknowledgements: Authors would like to acknowledge SAFRAN - SNECMA for
providing the material. This work was partially funded by the French Government program “Investissements d‟Avenir” (EQUIPEX GAP, reference ANR-11-EQPX-0018).
ACCEPTED MANUSCRIPT
References
ASTM, 2010. D6272-10: Standard Test Method for Flexural Properties of Unreinforced and Reinforced Plastics and Electrical Insulating Materials by Four-Point Bending.
Bahr H.A., Weiss H.J., Bahr U., Hofmann M., Fisher G., Lampenscherf S., Balke H., 2010. Scaling behavior of thermal shock crack patterns and tunneling cracks driven by cooling or drying, J. Mech. Phys. Solids 58, 1411-1421.
Colin X., Mavel A., Marais C., Verdu J., 2005. Interaction between cracking and oxidation in organic matrix composites, J. Comp. Mater. 39, 1371-1389.
Cornetti P., Sapora A., Carpinteri A., 2016. V-notches and short cracks: Finite fracture mechanics vs. Cohesive crack model, Engng. Fract. Mech. DOI: 10.1016/ j.engfracmech. 2015.12.016.
Cycom-Cytec, 2014. http://www.cytec.com.
Daghia F., Zhang F., Cluzel C., Ladeveze P., 2015. Thermo-mechano-oxidative behavior at the ply‟s scale: the effect of oxidation on transverse cracking in carbon-epoxy composites, Composite Structures 134, 602-612.
Fard M.Y., Raji B., Chattopadhyay A., 2014. The ratio of flexural strength to uniaxial strength in bulk epoxy resin polymeric materials, Polymer Testing 40, 156-162.
Fu Y., Zhang X.C., Xuan F.Z., Tu S.T., Wang Z.D., 2013. Multiple cracking of thin films due to residual stress combined with bending stress, Comp. Mater. Sci. 73, 113-119.
Hashin Z., 1996. Finite thermoelastic fracture criterion with application to laminate cracking analysis, J. mech. Phys. Solids 44, 1129-1145.
Ho, N.Q., Pons, F., Lafarie-Frenot, M.C., 2006. Characterization of an oxidized layer in epoxy resin and in carbon epoxy composite for aeronautic applications, in: Lamon, J., Torres-Marques, A. (Eds.), ECCM12, Biarritz, France.
Jenkins D.R., 2009. Determination of crack spacing and penetration due to shrinkage of a solidifying layer, Int. J. Solids Structures 46, 1078-1084.
Jiang C.P., Wu X.F., Li J., Song F., Shao Y.F., Xu X.H., Yan P., 2012. A study of the mechanism of formation and numerical simulations of crack patterns in ceramics subjected to thermal shock, Acta Mater. 60, 4540-4550.
Kim S.R., Nairn J.A., 2000. Fracture mechanics of coating/substrate systems Part II: Experiments in bending, Engng. Fract. Mech. 65, 595-607.
Lafarie-Frenot M. C., Grandider J.C., Gigliotti M., Olivier L., Colin X., Verdu J., Cinquin J., 2010. Thermo-oxidation behaviour of composite materials at high temperatures: A review
ACCEPTED MANUSCRIPT
of research activities carried out within the COMEDI program. Polymer Degradation and Stability 95, 965-974.
Laws N., Dvorak G., 1988. Progressive transverse cracking in composite laminates, J. Comp. Mater. 22, 900-916.
Leguillon D., 2002. Strength or toughness? A criterion for crack onset at a notch, Eur. J. of Mechanics - A/Solids 21, 61-72.
Leguillon D., Yosibash Z., 2003. Crack onset at a v-notch. Influence of the notch tip radius, Int. J. of Fracture 122, 1-21.
Leguillon D., 2013. A simple model of thermal crack pattern formation using the coupled criterion, C. R. Mécanique 341, 538-546.
Leguillon D., Haddad O., Adamowska M., da Costa P., 2014. Crack pattern formation and spalling in functionalized thin films, Procedia Materials Science, 3, 104-109.
Leguillon D., Martin E., Lafarie-Frenot M.C., 2015a. Flexural vs. tensile strength in brittle materials, C.R. Mécanique 343(4), 275-281.
Leguillon D., Martin E., Sevecek O., Bermejo R., 2015b. Application of the coupled stress-energy criterion to predict the fracture behaviour of layered ceramics designed with internal compressive stresses, Eur. J. Mech. A/Solids 54, 94-104.
Li J., Leguillon D., 2016. Finite element implementation of the coupled criterion for numerical simulations of crack initiation and propagation in brittle or quasi-brittle materials, submitted.
Lubineau G., Ladeveze P., Violeau D., 2006. Durability of CFRP laminates under thermomechanical loading, Comp. Sci. tech. 66, 983-992.
Lubineau G., Violeau P., Ladeveze P., 2009. Illustrations of a microdamage model for laminates under oxidizing thermal cycling, Comp. Sci. tech. 69, 3-9.
Martin E., Leguillon D., 2004. Energetic conditions for interfacial failure in the vicinity of a matrix crack in brittle matrix composites, Int. J. Solids Structures 41, 6937-6948.
Martin E., Vandellos T., Leguillon D., Carrere N., 2016. Initiation of edge debonding: Coupled criterion versus cohesive zone model, submitted to Int. J. Fract.
Maurini C., Bourdin B., Gauthier G., Lazarus V., 2013. Crack patterns obtained by unidirectional drying of a colloidal suspension in a capillary tube: experiments and numerical simulations using a two-dimensional approach, Int. J. Fract. 184, 75-91.
Nairn J., 1989. The strain energy release rate of composite microcracking: a variational approach, J. Comp. Mater. 23, 1106-1129.
ACCEPTED MANUSCRIPT
Olivier L., Ho N.Q., Grandidier J.C., and Lafarie-Frenot M.C., 2008. Characterization by ultra-micro indentation of an oxidized epoxy polymer: Correlation with the predictions of a kinetic model of oxidation, Polymer Degradation and Stability. 93, 489-497.
Pecora M., 2014. Etude de l‟influence de l‟oxydation sur les mécanismes de rupture des résines époxy. Rapport de stage, Institut P‟, Poitiers, France.
Pecora M., Pannier Y., Lafarie-Frenot M.C., Gigliotti M., Guigon C., 2016. Effect of thermo-oxidation on the failure properties of an epoxy resin, submitted to Polymer Testing.
Shao Y., Xu X., Meng S., Bai G., Jiang C., Song F., 2010. Crack patterns in ceramic plates after quenching, J. Am. Ceram. Soc. 93, 3006–3008.
Vu D.Q., Gigliotti M., Lafarie-Frenot M.C., 2012. Experimental characterization of thermo-oxidation-induced shrinkage and damage in polymer-matrix composites, Composites: Part A 43, 577-586.
Vu D.Q., Gigliotti M., Lafarie-Frenot M.C., 2013. The effect of thermo-oxidation on matrix cracking of cross-ply [0/90]S composite laminates, Composites: Part A, 44, 114-121.
Xia Z.C., Hutchinson J.W., 2000. Crack patterns in thin films, J. Mech. Phys. Solids, 48, 1107-1131.
Verdu J., 2012. Oxidative ageing of polymers. ISTE-Wiley.
Weissgraeber P., Leguillon D., Becker W., 2015. A review of Finite Fracture Mechanics: Crack initiation at singular and non-singular stress-raisers, Arch. Appl. Mech. DOI: