HAL Id: hal-02339222
https://hal.sorbonne-universite.fr/hal-02339222
Submitted on 30 Oct 2019
HAL is a multi-disciplinary open access archive for the deposit and dissemination of sci-entific research documents, whether they are pub-lished or not. The documents may come from teaching and research institutions in France or abroad, or from public or private research centers.
L’archive ouverte pluridisciplinaire HAL, est destinée au dépôt et à la diffusion de documents scientifiques de niveau recherche, publiés ou non, émanant des établissements d’enseignement et de recherche français ou étrangers, des laboratoires publics ou privés.
Neuro-computational Impact of Physical Training
Overload on Economic Decision-Making
Bastien Blain, Cyril Schmit, Anaël Aubry, Christophe Hausswirth, Yann Le
Meur, Mathias Pessiglione
To cite this version:
Bastien Blain, Cyril Schmit, Anaël Aubry, Christophe Hausswirth, Yann Le Meur, et al.. Neuro-computational Impact of Physical Training Overload on Economic Decision-Making. Current Biology - CB, Elsevier, 2019, 29 (19), pp.3289-3297.e4. �10.1016/j.cub.2019.08.054�. �hal-02339222�
Title: 1
Linking endurance sport to intellectual work: the impact of physical training overload on choice 2 neural mechanisms 3 4 Short Title: 5
Executive fatigue induced by sport training 6
7
Authors: 8
Bastien Blain1,2,3*, Cyril Schmit4, Anaël Aubry4, Christophe Hausswirth5, Yann Lemeur4,5, & Mathias 9 Pessiglione1,2* 10 11 Affiliations: 12
1 Motivation, Brain and Behavior Team, Centre de NeuroImagerie de Recherche, Institut du Cerveau et 13
de la Moelle épinière, Hôpital de la Pitié-Salpêtrière,75013 Paris, France; 14
2 INSERM UMRS 1127, CNRS UMR 7225, Université Pierre et Marie Curie-Paris 6, 75005, Paris, 15
France; 16
3 Centre d’Economie de la Sorbonne, Université Paris 1, 75013 Paris, France ; 17
4 French Institute of Sport, Expertise and Performance (INSEP), Research Department, Laboratory of 18
Sport, Expertise and Performance (EA 7370), Paris, France; 19
5 Laboratory LAMHESS (EA6312), University of Nice Sophia-Antipolis, Nice, France. 20
The two first authors contributed equally to this work. 21
The two last authors co-supervised this work. 22
*Correspondence should be sent to: bastien.blain@gmail.com or mathias.pessiglione@gmail.com 23
Summary
25
Overtraining syndrome is a form of burnout, defined in endurance athletes by unexplained
26
performance drop associated with intense fatigue sensation. Our working hypothesis is that the
27
form of fatigue resulting from physical training overload might share some neural
28
underpinnings with the form of fatigue observed after prolonged intellectual work, which was
29
previously shown to affect th e executive control brain system. Indeed, executive control may
30
be required to prevent any impulsive behavior, including stopping physical effort when it hurts,
31
despite the long-term goal of improving performance through intense training. To test this
32
hypothesis, we induced a mild form of overtraining in a group of endurance athletes, which we
33
compared to a group of normally trained athletes on behavioral tasks performed during fMRI
34
scanning. At the behavioral level, training overload enhanced impulsivity in economic choice,
35
which was captured by a bias favoring immediate over delayed rewards in our computational
36
model. At the neural level, training overload resulted in diminished activation of the lateral
37
prefrontal cortex, a key region of the executive control system, during economic choice. Our
38
results therefore provide causal evidence for a functional link between enduring physical
39
exercise and exerting executive control. Besides, the concept of executive fatigue bridges the
40
functional consequences of excessive physical training and intellectual work into a single
41
neuro-computational mechanism, which might contribute to other clinical forms of burnout
42
syndromes.
43 44
Keywords: decision making, executive control, delay discounting, sport training, fatigue,
45
burnout, prefrontal cortex, fMRI, computational modeling
46 47
INTRODUCTION
48
49
A few decades ago, a marathon superstar at the peak of his career suddenly stopped running for
50
several years, citing mental and physical exhaustion, in the absence of apparent injury. This
51
extreme state of fatigue is at the heart of the so-called overtraining syndrome, a form of burnout
52
that strikes athletes in various types of endurance sport. Beyond subjective fatigue, the
53
overtraining syndrome is objectively characterized by a decrease in performance that persists
54
beyond substantial rest period 1. It may also be accompanied by cardiac and endocrine
55
modifications, as well as symptoms shared with depression such as apathy, irritability,
56
restlessness, insomnia or loss of appetite 2. As the underlying mechanisms remain unknown,
57
the overtraining syndrome represents a major issue for both athletes and coaches, and a potential
58
cause of doping practice.
59 60
Here, we suggest a neural mechanism that might underlie the effects of excessive physical
61
training. More specifically, our idea is that training overload induces fatigue in the executive
62
control brain system. Executive control is needed whenever routine motor or cognitive
63
processes must be monitored, interrupted and modified so as to better align the behavior to
64
long-term goals 3,4. Maintaining physical effort for the sake of fitness, when aversive signals
65
such as aching muscles call for stopping, should therefore require executive control. This
66
assumption is difficult to test directly, as it would require monitoring executive control during
67
real-life endurance exercise. However, we reasoned that testing the signatures of a putative
68
fatigue in the executive control brain system might be feasible.
69 70
Indeed, we demonstrated in a previous fMRI study 5 that the executive control system is
71
susceptible to fatigue when engaged for a time as long as a workday. The demonstration
involved interleaving cognitive tasks meant to induce executive fatigue and choice tasks meant
73
to reveal executive fatigue. This procedure borrowed from sequential task paradigms that have
74
been widely used to assess resource depletion theories 6,7. Executive fatigue was revealed by
75
two markers recorded during inter-temporal decisions (choices between immediate and
larger-76
later monetary rewards). We observed: 1) at the neural level, a decreased excitability of the
77
lateral prefrontal cortex (LPFC) specifically during choice tasks, and 2) at the behavioral level,
78
an increased preference for immediate rewards in choice tasks.
79 80
Importantly, these markers were observed in the absence of any alteration in brain activity or
81
behavioral performance during cognitive tasks. This is consistent with the idea of an executive
82
fatigue, corresponding to an increase in the cost of mobilizing the executive control system, by
83
opposition to an executive dysfunction, as seen in patients with damage to the prefrontal cortex.
84
In other words, our notion of executive fatigue implies that executive control abilities are not
85
lost, but exerted with more parsimony. Thus, they are still mobilized in cognitive tasks where
86
performance has to be maintained, but not necessarily in choice tasks framed as mere expression
87
of subjective preference.
88 89
Here, we kept the label ‘executive fatigue’ for the collection of neural and behavioral signatures
90
previously observed following excessive cognitive work. If physical training overload also
91
leads to executive fatigue, then overtrained athletes should exhibit the same neural and
92
behavioral markers. The presence of these markers would provide evidence that physical
93
exercise over long periods might impact executive control and change temporal preferences.
94
This may be important for cognitive neuroscience in a context where failed replications have
95
casted serious doubt on whether control capacity can be reduced by its utilization at short time
scales 8,9. For the general public, these signatures of executive fatigue would document the
97
neural adverse effects of pushing too far the demand on physical fitness.
98 99
We tested these predictions in a mild case of overtraining, called overreaching (OR), since
100
inducing a full-blown overtraining syndrome would be obviously unethical. This state can be
101
considered as a preliminary step, in the pathway to overtraining, which usually vanishes in a
102
week or two if training load is drastically reduced. OR is characterized regarding physical
103
exercise by a decreased maximal power output (MPO) and an increased rating of perceived
104
exertion (RPE), associated in everyday life with enhanced fatigue sensation but no
depression-105
like symptoms 10,11.
106 107
To explore the effects of overreaching, we recruited 37 competitive male endurance athletes
108
(mean age around 35 years). Participants were assigned to either the control group with normal
109
training (n = 18) or to the group with training overload (n = 19), in a pseudo-random manner
110
that ensured matching of age and performance level. Their training program (Fig. 1) was
111
supervised during a total of nine weeks by the Insep (French institute for sport performance).
112
The overload concerned a period of three weeks (denoted phase III in Fig. 1) during which the
113
duration of each training session was increased by 40% on average. The general structure of
114
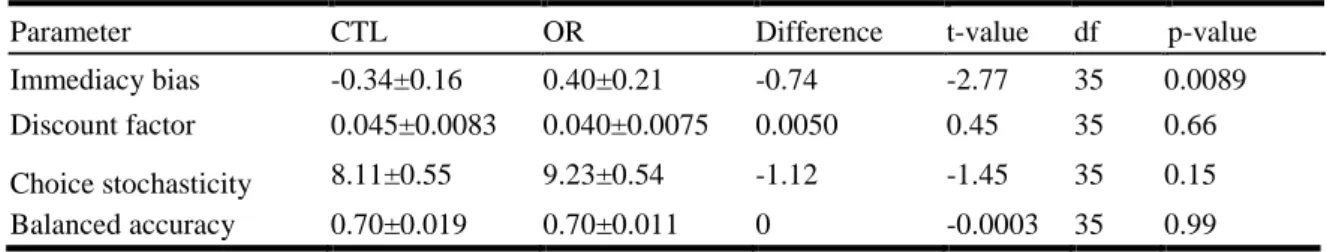
running, cycling and swimming sessions was maintained as usual. Physical performance was
115
monitored during cycling exercises performed on rest days (Pre, Post and Taper in Fig.1), and
116
subjective fatigue was assessed using a psychometric questionnaire 12 every two days.
RESULTS
118 119
The effects of training overload on physical performance and effort sensation were assessed
120
during cycling tests that were conducted on the two days following phase III.
121
On day 1, participants completed on a cycle ergometer an exercise protocol designed to
122
determine their Post MPO, which was compared to the Pre MPO measured before the start of
123
training phase III. MPO corresponds to the maximal workload (in Watts) that participants could
124
sustain when physiological measures reached exhaustion criteria.
125
On day 2, participants came to the MRI center for two scanning sessions, separated by a
45-126
min cycling trial, during which participants were instructed to give their best performance, i.e.,
127
to cover a maximal distance (see Fig. 2). The aim of including such an intense physical effort
128
was to disentangle the effects of acute (45-min) exercise from long-term (3-week) overload. It
129
also served to test for an interaction between exercise and overreaching, which would occur if
130
OR athletes were more fatigable (even by short exercises) than CTL athletes. Finally, it served
131
to measure perceived exertion, which was rated by participants every five minutes during the
132
cycling time trial, on a visual analog scale 13.
133 134
The behavioral and neural markers of executive fatigue were tested on day 2, during fMRI
135
scanning sessions (see Fig. 2). The behavioral marker was preference for immediate rewards,
136
relative to bigger-later rewards, in inter-temporal choices. Before scanning, participants
137
performed a calibration session where choice options were progressively adjusted, following a
138
bisection procedure, in order to find subject-specific indifference points. During scanning
139
sessions, inter-temporal choice task trials were tailored around subject-specific indifference
140
points, so their difficulty was matched across subjects. The neural marker was LPFC activity
141
during choice trials, compared to baseline. Choice trials were intermingled with executive task
trials (either N-back or N-switch), on which participants had been trained until passing a
143
threshold of 90% correct responses. There were two reasons for incorporating executive tasks.
144
The first reason was that we needed an independent contrast to isolate executive control regions,
145
which was provided by the difference between hard and easy versions of the tasks (change in
146
N). The second reason was that we intended to test the specificity of fatigue effects on choices,
147
which we observed in our previous study 5. Indeed, fatigue left unaffected brain activity
148
recorded during performance of executive tasks. The idea is that compensatory mechanisms
149
may be recruited to maintain performance, in tasks where there is an objective correct response
150
(N-back and N-switch), but not in tasks where the response is an expression of subjective
151
preference (inter-temporal choice).
152 153
Overreaching effects on cycling exercise. As predicted, MPO was significantly reduced by
154
training overload (Fig. 3A, left), but not by normal training (OR group: ∆MPO= -13.26±2.88
155
W, t18 = -4.61, p = 0.00022; CTL group: ∆MPO= 3.60±2.74 W, t17 = 1.2, p = 0.25), with a
156
significant difference in training effect (∆MPO) between groups (F1,32 = 16.3, p = 0.00031).
157
Training overload also had the expected impact on perceived exertion (see Fig. 3A, right),
158
which was higher in OR relative to CTL participants (OR: RPE = 15.59±0.16; CTL: RPE=
159
14.74±0.29; OR vs. CTL: t34 = 2.56, P = 0.014). Altogether, results from cycling exercises
160
confirmed that training overload was effective: it decreased physical performance while
161
increasing effort sensation.
162
Note that in the OR group, MPO measured after the last phase (Taper) was even higher than in
163
the Pre baseline (∆MPO= 7.68±3.67 W, t18 = 2.15, p = 0.046). Thus, athletes fully recovered
164
their physical capacity after training overload, showing that our manipulation was harmless in
165
the end.
166 167
Overreaching effects on psychometric questionnaire. The overreaching state induced by
168
training overload measures were corroborated by psychometric questionnaires (Brunel mood
169
scale) that participants filled every two days (Fig. 3B). Note that baseline fatigue level (at the
170
start of the training program) was matched between groups. The increase in subjective fatigue
171
between the beginning and the end of phase III was higher in OR relative to CTL participants
172
(OR: ∆fatigue = 3.78±0.98; CTL: ∆fatigue = 0.21±0.74; OR vs. CTL: F1,30 = 6.89, P = 0.014),
173
whereas there was no difference in the evolution of depression score (F1,30 = 0.72, p = 0.4).
174 175
Overreaching effects on behavioral task performance. Bayesian model selection indicated
176
that for both groups, the best account of choices made during calibration was provided by
177
exponential discounting of reward with delay, plus an additive parameter, termed immediacy
178
bias (IB), which captures the preference for immediate options, irrespective of reward and delay
179
(see Table 1).
180
When comparing between groups the proportion of impulsive choice made during the
181
calibration procedure, we observed a marginally significant difference, with a higher proportion
182
of impulsive choice following training overload (OR: Pim = 0.46±0.026; CTL: = 0.38±0.031;
183
difference: OR vs. CTL: t35 = -1.99, p = 0.054). Note that such model-free comparison is
184
limited because choices were progressively adjusted to indifference points through our adaptive
185
design. We thus compared fitted parameters (posterior means) between groups, and observed a
186
specific difference in the immediacy bias (Fig. 3C), which –in line with our key behavioral
187
prediction– was higher following training overload (OR: IB= 0.4±0.21; CTL: IB = -0.34±0.16;
188
OR vs. CTL: t35 = -2.77, p = 0.0089).
189
All the other parameters (Table 2), as well as the quality of fit (see Fig. 4, left), were similar in
190
the two groups. This suggests that training overload increased the attraction of immediate
191
rewards, but not the way option values were estimated and compared. In particular, the weight
assigned to delay (discount factor) and the stochasticity of choices (temperature parameter)
193
were not significantly affected by training overload.
194 195
However, such a difference in the immediacy bias between groups might come from a sampling
196
issue (the CTL group being by chance more patient than the global population, and/or the OR
197
group being more impulsive than the global population). To address this question, we included
198
as a reference a third independent control group of participants (n = 106), who were tested with
199
similar calibration procedures, for other purposes. Across all control participants, we conducted
200
permutation tests (1,000,000 iterations) to estimate the exact probability of observing by chance
201
a bias parameter of at least the same mean, with a sample of the same size, as that of the OR
202
group. This permutation procedure gave us a p-value of 0.025. We therefore conclude that the
203
observed bias parameter was unlikely to reflect a sampling issue, and more likely to represent
204
a true effect of training overload.
205 206
During scanning sessions, we observed no significant difference between groups in executive
207
task performance. We illustrate this absence of effect using correct response rate pooled across
208
tasks (Fig. 5A), but similar null results were obtained when analyzing tasks separately, or
209
comparing response time instead of accuracy, or focusing on switch cost. However, we
210
observed a trend for a remaining specific group difference in the immediacy bias (OR vs. CTL:
211
F1,35 = 3.99, p = 0.054), despite the adjustment of choice options following calibration (see Fig.
212
4). Regarding our secondary question, namely the effects of acute exercise, we found no
213
significant difference between scanning sessions, neither in executive task performance nor in
214
inter-temporal choices and no interaction between session and group (see table S1). Thus, 45
215
minutes of cycling, although athletes approached physical exhaustion, was insufficient to affect
216
executive control or to interact with the state of executive fatigue.
Overreaching effects on neural activity. To investigate the neural underpinnings of fatigue
218
effect on choice impulsivity, we isolated the executive control network using the conjunction
219
between choice-related activity (against baseline) and the difference in difficulty (hard minus
220
easy tasks), as was done in our previous study 5. The logic of this analysis was to locate brain
221
regions that are normally involved in both executive processing and inter-temporal choice (in
222
the control group). These regions would be candidate for mediating the impact of executive
223
fatigue on choice impulsivity, as they would be both responsive to executive demand and
224
recruited during inter-temporal decision-making. Thus, activity level extracted from these
225
regions served as a reference to assess the effects of training overload. As expected 5,14–20, we
226
observed significant conjunction in a bilateral prefronto-parietal network (Fig. 5B; see Table
227
S2), including the middle frontal gyrus (MFG) and the inferior parietal lobule (IPL).
228 229
We focused on the left MFG cluster, as it perfectly overlapped with the unique brain region that
230
was found in the previous study 5 to both activate in the conjunction analysis and deactivate
231
during choices in relation with behavioral fatigue effects. Neural activity was extracted using a
232
general linear model that controlled for task factors such as delay, reward level, eventual choice
233
and response time (see methods). Choice-related activity (but not task-related activity) in the
234
independent left MFG cluster (defined from previous study) was significantly reduced
235
following training overload (OR: β = 0.15±0.50; CTL: β = 1.86±0.43; OR vs. CTL: F1,35 = 6.36,
236
p = 0.016). As seen with behavioral variables, there was no effect of acute exercise (no main
237
effect of session and no interaction; see Table S3) on neural activity. The difference between
238
group in choice-related left MFG activity was not observed in other clusters such as the left IPL
239
or the right MFG (see Fig. S1 and Table S4). Also, left MFG activation with the difficulty of
240
executive tasks was not different between groups (see Fig. 5C and Table S3). Moreover, the
241
interaction between task and group was significant, indicating that training overload mainly
impacted choice-related activity (CTL: ∆β = 1.35±0.43; OR: ∆β = -0.20±0.48; CTL vs. OR:
243
F1,35 = 5.81, p = 0.021).
244 245
Thus, training overload effects were predominant in the left MFG cluster and during the
inter-246
temporal choice task. The fact that left MFG activity was independent from reward and delay
247
levels (see Fig. S2) suggests that training overload did not affect temporal discounting. This is
248
consistent with the computational modeling analysis showing an effect on the immediacy bias
249
but not on the discount factor. We did not find any increase in choice neural activity in the OR
250
group compared to the CTL group, even at a very liberal threshold (p<0.05 at the voxel level,
251
extent threshold of 4 voxels at the cluster level), even with a lower spatial smoothing that would
252
be more sensitive to activity in small subcortical regions such as the ventral striatum.
253 254
In addition, choice-related left MFG activity was correlated across participants with the
255
immediacy bias estimated during scanning sessions in the OR group (r= -0.36, t17 = -4.32, p =
256
0.0005). Although the coefficient should be interpreted with caution, due to the small sample
257
size21,22, this significant correlation establishes a link between the neural and behavioral
258
markers of executive fatigue (Fig. S3). Note that the left MFG ROI was selected from the
259
previous study, by conjunction between executive- and choice-related activities, to avoid
non-260
independence issues. Moreover, this correlation is independent from the difference between
261
groups, as it is restricted to the OR group. It shows that athletes who exhibited lower activity in
262
left MFG during decision-making had a stronger bias in favor of immediate over delayed
263
rewards.
264 265 266
DISCUSSION
267
Our findings indicate that physical training overload reduces the excitability of left MFG and
268
the capacity to resist temptation of immediate reward in inter-temporal choice. These
269
conclusions rely on significant differences between overtrained and normally trained groups of
270
athletes, in both brain activity and behavioral performance, during choice tasks. There were
271
trends for interactions between groups and sessions, in the sense that overtrained athletes were
272
more fatigued after a one-hour cycling exercise, but these trends were not significant. The
273
association of neural and behavioral differences between groups was corroborated by an
274
independent correlation, observed within the overtrained group, between reduced left MFG
275
activity and enhanced immediacy bias. Although this correlation does establish a link between
276
neural and behavioral effects of overtraining, it does not imply that the neural effects were
277
mediating the behavioral effects. Unfortunately, we could not apply here the kind of mediation
278
analysis conducted in our previous study 5, because the consequences of overtraining were
279
assessed between participants, and because we did not get baseline impulsivity measurement
280
(prior to training). The absence of baseline measurement is a potential limitation to the
281
conclusions, but comparison to other datasets in healthy volunteers ensured that the difference
282
was due to overtrained athletes being more impulsive than the normal population.
283 284
The difference in choice impulsivity was best captured by the additive bias in the exponential
285
discounting model 23. Interestingly, the two parameters of this (𝛽𝛿) model were previously
286
mapped onto opponent brain systems involved in the valuation of immediate versus delayed
287
reward. These opponent systems therefore had opposite influences on choice, with a more
288
‘future-oriented’ system including the lateral prefrontal cortex and a more ‘present-oriented’
289
system including the ventral striatum. Interpreted in such a framework, increased choice
290
impulsivity in overtrained athletes would correspond to a less active ‘future-oriented’ system
(decrease in left MFG activity) rather than a more active ‘present-oriented’ system (no increase
292
in ventral striatum activity). Indeed, we did not observe any brain region that would have been
293
more active in overtrained athletes during economic choice.
294 295
We previously suggested the notion of executive fatigue as a label for the two choice-related
296
markers (increased impulsivity with decreased MFG activity) observed in the absence of any
297
change in behavioral performance or brain activity during cognitive tasks. As all neural and
298
behavioral markers were present in the overtrained group, we conclude and physical training
299
overload can also induce executive fatigue. This notion of executive fatigue is different from
300
physical fatigue, because it can be induced by purely intellectual work 5. It is also different from
301
stress or sleep deprivation, which failed to influence inter-temporal choices in previous
302
experiments 24,25. Executive fatigue should also be distinguished from loss of motivation, since
303
it does not affect the arbitrage between reward and delay, as shown by computational modeling
304
of choice behavior, and because it impacts activity in a brain region (left MFG) that was not
305
sensitive to reward. Finally, executive fatigue does not imply that the choice process itself is
306
impaired, as would be reflected by a higher stochasticity, but rather that preference is shifted in
307
favor of immediate reward.
308 309
This new concept of executive fatigue should be contrasted to existing theories of ‘limited
310
willpower’ or ‘resource depletion’. These theories postulate that exerting self-control may
311
deplete a common limited resource and consequently affect performance in any subsequent task
312
that also involves self-control 6,7. However, the time scale typically envisaged in resource
313
depletion theories is that of minutes (e.g., 26). Meta-analyses and multi-lab replication attempts
314
have seriously questioned that depletion effects can be obtained in sequential task paradigms at
315
such short time scale 8,9. Consistently, we observed here no effect of 45-min cycling on working
memory, task switching, choice impulsivity or brain activity. These results therefore suggest
317
that exerting executive control might indeed affect subsequent recruitment of executive control
318
but at a time scale that is much longer than usually considered (here, three weeks). We
319
nonetheless acknowledge that our participants were well-trained endurance athletes, who had
320
exceptional recovery capacity and highly competitive spirit. It remains possible that recreational
321
cyclists would have shown earlier fatigue effects, as suggested by a previous study investigating
322
interactions between acute exercise and cognitive abilities 27.
323 324
Theories assuming that a resource is depleted by self-control have not identified what the
325
resource may be at the biological level 28. Blood glucose has been proposed as a suitable
326
candidate resource, with some supporting evidence initially 6,29. However, the beneficial effects
327
of glucose ingestion have been hard to replicate 30,31 and it was later suggested that they might
328
be more psychological than biological 32,33. In our study, glucose is unlikely to have played a
329
role because participants had free access to food and drinks during both training and experiment
330
days. Instead, we suggest a specific neural basis for our concept of executive fatigue, with a
331
precise anatomical location, in the left MFG. It is remarkable that such different tasks as training
332
for triathlon and making inter-temporal choice precisely interfered in a single brain region.
333
Indeed, other regions of the parieto-prefrontal executive network recruited by inter-temporal
334
choices did not show any fatigue effect. It is the same MFG region that mediated the increase
335
in choice impulsivity induced by prolonged working memory and task-switching performance
336
5, and the same MFG region on which transcranial magnetic stimulation (TMS) induced a
337
present bias in inter-temporal choice 16,34. Our findings therefore concur to designate the left
338
MFG as the weak spot of the brain executive control system 15,20, being susceptible to fatigue.
339 340
Yet our data are silent about why the MFG is harder to activate with fatigue. This may not
341
necessarily come from a local dysfunction of MFG neurons. Indeed, MFG activity could be
342
down-regulated by other brain systems for adaptive reasons, possibly because exerting
343
executive control would exhaust some energetic supply or accumulate some metabolic wastes.
344
It has been suggested for instance that stopping executive control might avoid the accumulation
345
of Amyloid-𝛽 peptide and allow its clearance during rest or sleep, such that neural cells remain
346
functional 35. More generally, executive fatigue might have origins in any of the numerous
347
physiological changes that have been reported following excessive sport exercise. One
348
interesting (but still debated) possibility is the release of inflammatory cytokines 36,37, which
349
are known to affect motivational processes 38,39. Yet the mechanisms through which peripheral
350
physiological changes would affect specific prefrontal cortex functions remain to be explored.
351 352
Alternatively, down-regulation could be adaptive at a functional rather than biological level,
353
for instance to avoid opportunity costs 40,41, i.e. to avoid losing the benefits of using executive
354
control resources for other purposes. Yet the latter hypothesis would imply that the opportunity
355
cost of executive control increases with time on task, which seems quite an arbitrary
356
assumption. Further studies are thus required to understand why the MFG is susceptible to
357
fatigue, whereas other brain regions such as the visual cortex can work all day long without any
358
behavioral consequence. In any case, the impact of fatigue can be construed as an increase in
359
the cost of recruiting the MFG, and thus exerting control. The implication is that control
360
resources can still be mobilized in a state of fatigue but for higher benefits. This would explain
361
why performance was maintained during executive control tasks, in which a precise financial
362
payoff was associated to every correct response. By contrast, the benefit of making a sound
363
decision in inter-temporal choice might have been too elusive to recruit executive control. Such
364
a view is consistent with suggestions that the effects of time-on-task on cognitive performance
and related brain activity are not robust 42,43, and that the consequences of mental fatigue are
366
better conceived as shifts in cost-benefit arbitrages 44,45.
367 368
The consequence of impulsive economic choice could itself be deemed adaptive, if immediate
369
rewards were instrumental to eliminate fatigue, as glucose is for reducing hunger. Yet in our
370
paradigm it remains unclear how a small amount of money could be used to improve
371
overreaching symptoms, so we consider as a bias the shift observed in favor of immediate
372
rewards. Another slightly different perspective could be that fatigue place subjects in a state of
373
need, pushing them to seek immediate rewards in order to restore their mood or some
374
overarching hedonic variable which they monitor on the long run. This hedonic regulation is
375
reminiscent of the spontaneous oscillations between pursuing ‘have to’ versus ‘want to’ goals
376
46 and may be the basis of the trade-off between work and leisure that is at the heart of labor
377
theory 47.
378 379
In conclusion, our findings provide the first demonstration that physical training overload
380
induces some fatigue in the executive control brain system, associated with more impulsive
381
economic decisions. They suggest a neural mechanism that might explain not only why
382
overtrained athletes fail to overcome pain or fatigue signals, but also why they are at risk of
383
doping, which may help with immediate performance but compromise long-term achievements.
384
They could also account for the rise of fatigue syndromes observed in amateurs of extreme
385
sports such as ultra-trail, who may put in danger not only their heart and knees, but also their
386
brains. Finally, these findings could perhaps be extended to other types of work overload, and
387
therefore have applications not only for sport coaching but also for work management and
388
health care, since excessive work is one of the possible routes to burnout syndrome. We should
389
keep in mind, however, that our overtrained participants were (fortunately) not in a full-blown
390
burnout state. It remains possible, and even likely, that factors other than executive fatigue come
into play for a transition to long-term burnouts. Further research is needed to investigate those 392 putative factors. 393 394 395 Acknowledgements 396
The study was funded by the French anti-doping agency (AFLD). This work also benefited
397
from the program ’Investissements d’avenir’ (ANR-10-IAIHU-06). BB received a PhD
398
fellowship from the Direction Générale de l’Armement. The funders had no role in study
399
design, data collection and analysis, decision to publish or preparation of the manuscript. We
400
wish to thank the staff of the Prisme facilities for behavioral testing and the Cenir facilities for
401 neuroimaging experiment. 402 403 Author Contributions 404
BB, CH, YLM and MP designed the experiment. CS, AA and YLM supervised the training
405
program. BB and CS collected the behavioral and fMRI data. BB and MP analyzed the data
406
and wrote the paper.
407 408
Competing Interests statement
409
Nothing to declare.
Figure Legends
411 412
Fig. 1. Training procedures.
413
Participants (37 male triathletes in total) were divided into two groups, following slightly different training 414
procedures. The loads assigned to the different training phases correspond to variations in daily exercise 415
duration (in proportion to subject-specific standard), while exercise intensity was kept constant. The 416
critical manipulation is the 40% increase in training load during the three weeks of phase III, in the 417
overreaching (OR) but not in the control (CTL) group. The other phases were identical in both groups, 418
with a two-week baseline phase of usual training at the beginning, and two tapering phases (recovery 419
periods) before and after the critical phase III. The maximal power output (MPO) was evaluated on rest 420
days before and after phase III, as well as after phase IV (as indicated by cyclist icons). The fMRI 421
experiment (indicated by brain icon) was conducted on the day following post-phase III MPO 422
measurement (see details in Fig. 2). 423
424
Fig. 2. fMRI experiment procedures.
425
Tasks are illustrated at different time scales from bottom to top. Participants performed two sessions of 426
behavioral tasks in the MRI scanner, before and after cycling (45-min time trial at maximal speed). 427
Sessions were divided into six 7-min runs, each including five blocks of executive tasks (back or N-428
switch) intermingled with inter-temporal choices (IC). Executive tasks were 3-back (3-B) and 12-switch 429
(12-S) in the hard condition (for a total of 8 blocks, in red), versus 1-back (1-B) and 1-switch (1-S) in the 430
easy condition (for a total of 4 blocks, in blue). The first three runs of a session implemented one 431
executive task (N-back or N-switch), and the last three runs the other one. In each block a series of 16 432
to 32 different letters was presented on screen, each starting a new trial. The task to be performed was 433
instructed at the beginning of the block. In N-back tasks, participants indicated whether the current letter 434
was the same as the one presented N trials before (irrespective of case and color). In N-switch tasks, 435
participants categorized the current letter as either vowel versus consonant or upper versus lower case, 436
depending on its color. In this case, N designates the number of switches (color changes) during the 437
block. At the end of the block participants made three self-paced choices (with a 5s limit) between 438
immediate and delayed monetary rewards. 439
Fig.3. Behavioral validation of overreaching effects
441
(A) Results of cycling tests conducted after phase III (see Fig. 1). Graphs show the change in maximal 442
power output (MPO, left) measured during the incremental cycling test on day 1, and how ratings of 443
perceived exertion (RPE, right) vary during the cycling time trial on day 2 separately for the control (CTL, 444
green) and overreaching group (OR, purple) groups. 445
(B) Results of fatigue psychometric assessment. Graphs show the change in fatigue score (extracted 446
from Brunel mood scale) observed between the beginning and the end of phase III (see Fig.1). 447
(C) Results of temporal discounting calibration. Graphs show the posterior mean of immediacy bias, a 448
parameter integrated in the choice model to account for preference between present and future, 449
irrespective of rewards and delays. Plain and dotted lines as well as the shadowed area in between 450
illustrate mean and confidence intervals of the immediacy bias observed in a larger, independent cohort 451
of healthy volunteers (n=106). Error bars and shaded areas correspond to intersubject SEM. Black stars 452
denote p-values (* < 0.05, ** < 0.01, *** < 0.001). 453
454
Fig. 4 Psychometric functions and model fits.
455
Graphs show observed choice rate (dots with error bars) and modeled choice probability (lines with 456
shaded areas) for immediate rewards (IR), as a function of modeled relative values (difference between 457
subjective values of immediate and delayed rewards). Error bars and shaded areas represent 458
intersubjects SE. Overreaching (OR) and control (CTL) groups are shown in purple and green, 459
respectively. Left, middle and right panels correspond to calibration, first fMRI and second fMRI 460
sessions, respectively. 461
462
Fig. 5. Neural underpinnings of overreaching effects.
463
(A) Behavior observed during fMRI. Top graphs show the immediacy bias (posterior mean of model 464
parameter fitted on inter-temporal choices) and bottom graphs the executive performance (correct 465
response rate in hard versions divided by correct response rate in easy versions of executive tasks) 466
separately for the control (CTL, green) and overreaching group (OR, purple) groups (see also Table 467
S1). (B) Whole-brain fMRI activity. Statistical maps show the conjunction between choice-related activity 468
(against baseline) and effect of difficulty (hard versus easy version of executive tasks) in the control 469
group. Significant activation (voxel-wise threshold: P < 0.001 uncorrected, cluster-wise threshold: P < 470
0.05 FWE corrected) was observed in a dorsal parieto-prefrontal network including the middle frontal 471
gyrus (MFG), the pre-central gyrus (PCG) and the inferior parietal lobule (IPL). The MFG cluster 472
overlaps with the unique brain region (shown in red) from the same conjunction that was susceptible to 473
executive fatigue in a previous study 5. The sagittal section (bottom) corresponds to the blue line on the 474
glass brain (top); it shows functional activations overlaid on anatomical scans averaged across subjects. 475
The x, y, z coordinates refer to the MNI space (see also Table S2). (C) Neural activity extracted from 476
the MFG cluster. Graphs show regression estimates (β) extracted from the cluster shown in red, for 477
neural activity observed during inter-temporal choices with respect to baseline (top) and for neural 478
activity observed during hard versions of executive task relative to easy versions (bottom; see also Table 479
S3). Error bars and shaded areas correspond to intersubject SEM. Black stars denote a p-value < 0.05, 480
daggers denote a trend. S1 and S2 refer to fMRI sessions conducted before and after cycling exercise, 481
respectively. 482
483 484
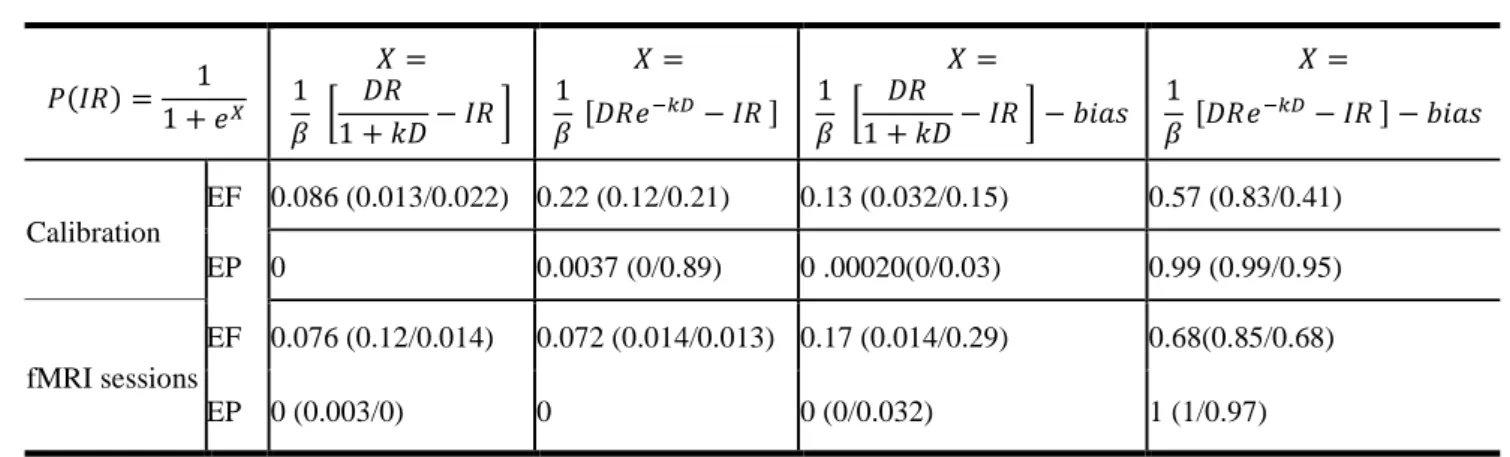
Tables 485 486 𝑃(𝐼𝑅) = 1 1 + 𝑒𝑋 𝑋 = 1 𝛽 [ 𝐷𝑅 1 + 𝑘𝐷− 𝐼𝑅 ] 𝑋 = 1 𝛽 [𝐷𝑅𝑒 −𝑘𝐷− 𝐼𝑅 ] 𝑋 = 1 𝛽 [ 𝐷𝑅 1 + 𝑘𝐷− 𝐼𝑅 ] − 𝑏𝑖𝑎𝑠 𝑋 = 1 𝛽 [𝐷𝑅𝑒 −𝑘𝐷− 𝐼𝑅 ] − 𝑏𝑖𝑎𝑠 Calibration EF 0.086 (0.013/0.022) 0.22 (0.12/0.21) 0.13 (0.032/0.15) 0.57 (0.83/0.41) EP 0 0.0037 (0/0.89) 0 .00020(0/0.03) 0.99 (0.99/0.95) fMRI sessions EF 0.076 (0.12/0.014) 0.072 (0.014/0.013) 0.17 (0.014/0.29) 0.68(0.85/0.68) EP 0 (0.003/0) 0 0 (0/0.032) 1 (1/0.97)
Table 1. Results of Bayesian model comparison.
487
The four models combine two discounting functions (hyperbolic vs. exponential) and two possibilities for 488
inclusion of an immediacy bias (present or absent) in the softmax choice function (see methods). IR and 489
DR are immediate and delayed reward magnitudes, D is delay. 𝛽, k and bias are free parameters (choice 490
stochasticity, discount factor and immediacy bias, respectively). The comparison was based on choices 491
made by the two groups of participants taken together, separately for the calibration and fMRI sessions. 492
EF is expected frequency and EP exceedance probability, provided for all participants and for each 493
group separately (CTL/OR). 494
496
Parameter CTL OR Difference t-value df p-value
Immediacy bias -0.34±0.16 0.40±0.21 -0.74 -2.77 35 0.0089
Discount factor 0.045±0.0083 0.040±0.0075 0.0050 0.45 35 0.66 Choice stochasticity 8.11±0.55 9.23±0.54 -1.12 -1.45 35 0.15 Balanced accuracy 0.70±0.019 0.70±0.011 0 -0.0003 35 0.99 497
Table 2. Comparison of model parameter estimates and quality of fit for choices made during
498
calibration session.
499
Models were fitted on the calibration session, separately for the control (CTL) and overreaching (OR) 500
groups. Parameters from top to bottom are denoted bias, k and 𝛽 in the models (see Table 1). Balanced 501
accuracy is the percentage of choices correctly predicted by the model, calculated separately for 502
impulsive and patient choices before averaging. Note that balanced accuracy is low because options 503
were adjusted to indifference points. Results are given as inter-subject means ± standard errors. Groups 504
were compared using two-sample two-tailed t-tests; df is degree of freedom. 505
STAR METHODS
507 508
Participants
509
The experimental design of the study was approved by the Ethical Committee of Hôpital de la
510
Pitié-Salpêtrière. Fourty-two well-trained male triathletes ([𝑉̇O2max] = 64.1 ± 4.9 ml·kg-1·min
-511
1) volunteered to participate in this study. They were paid a fix amount of 400€, plus one option
512
that was selected in a random trial of the choice task. All subjects had regularly competed in
513
triathlons for at least 3 years and were training a minimum of 10 hours per week. Their
514
performance level over the short (Olympic) distance triathlon (i.e., 1.5-km swimming / 40-km
515
cycling / 10-km running) ranged between 2 h and 2 h 20 min, which roughly corresponds to
516
national level of competition). Before participation, subjects underwent medical assessment by
517
a cardiologist to ensure normal electrocardiographic patterns and obtain a general medical
518
clearance. All subjects were free from chronic diseases and were not taking medication. After
519
comprehensive explanations about the study, all subjects gave their written informed consent
520
to participate.
521 522
Subjects were assigned to either the control group (CTL) or the overreaching group (OR) so as
523
to match performance level, habitual training volume, and past experience in endurance sports.
524
Five participants were excluded due to sleeping or excessive movements in the scanner or
525
failure to comply with instructions about behavioral tasks. In the end, our dataset included 18
526
CTL subjects (age = 36±1.5) and 19 OR subjects (age = 35±1.2).
527 528
To provide a reference point for the immediacy bias in the general population, we included
529
groups of participants with similar age, sex and education level, who were tested with the same
530
choice tasks in independent studies.
Training procedures
533
An overview of training procedure is shown in Fig 1. The training of each participant was
534
monitored for a period of nine weeks in total, which was divided into four distinct phases. The
535
two first phases (I and II) were similar in the OR and CTL groups. During the third phase (III),
536
the OR group completed a 3-week overload program designed to deliberately induce fatigue:
537
the duration of each training session was increased by 40% (e.g., a 1-hour run including 10
538
repetitions of 400 m at the maximal aerobic running speed was converted into an 85-min run
539
including 14 repetitions of 400 m at the maximal aerobic running speed). Participants
540
reproduced the same training program during each week of the overload period, which was kept
541
as usual, except for the increase in duration. The CTL group repeated its usual training program
542
during this third phase (III). Thereafter, all participants completed a 2-week taper period (IV),
543
where their normal training load (I) was decreased by 40%, following the guidelines for optimal
544
tapering in endurance sports 48.
545 546
During training, fatigue and depression were monitored by asking participants to fill the Brunel
547
mood questionnaire 12 every two days. We used a sub-selection of items to measure the change
548
in depression score (during the last two days, how often did you feel: “Miserable”, ”Unhappy”,
549
“Depressed”, “Unable to fall asleep”, “Insomniac”) and in fatigue score (“Collapsed”,
550
”Energetic” (-), “Tired”, “Exhausted”, “Having heavy legs”) between the beginning and end of
551
each phase. Fatigue and depression scores were not different between groups at the beginning
552
of the training program.
553 554
During phase I, all subjects were familiarized (on separate days) with both the cognitive tasks
555
going to be performed during fMRI scanning, and the maximal power output (MPO) test
556
(described below). The MPO test was performed on three occasions: before phase III (Pre),
after phase III (Post) and after phase IV (Taper), on the same day of the week and at the same
558
time of the day. To ensure that performance variations across MPO tests were due to the global
559
training regimen and not to the training session performed the day before testing, the subjects
560
were required to abstain from training during a 24-h period before each MPO testing session.
561
The day after Post MPO test, all participants completed two 45-min fMRI sessions during which
562
they performed cognitive tasks. The two sessions were interspaced with a 45-min self-paced
563
cycling time trial.
564 565
Cycling exercises
566
All MPO tests were performed using an electronically-braked cycle ergometer (Excalibur Sport,
567
Lode®, Groningen, The Netherlands). The incremental exercise protocol started with a 6-min
568
warm-up at a workload of 100 W, and then increased by 25 W every 2 minutes until voluntary
569
exhaustion to estimate MPO. Subjects wore a facemask covering their mouth and nose to collect
570
all expired breath (Hans Rudolph, Kansas City, MO) and calculate O2max using a
571
metabolimeter (Quark, Cosmed®, Rome, Italy). Complete exhaustion was confirmed by
572
physiological criteria 49 – that is, a plateau in O2max despite an increase in PO. MPO was
573
calculated as MPO = Wlast + 25 (t/120)50, where Wlast is the last completed workload and t the
574
number of seconds sustained in Wlast. O2max was defined as the highest 30-sec average of
575
breath-by-breath values51.
576 577
The 45-min self-paced time trial (TT) was completed between the two fMRI sessions.
578
Participants were instructed to achieve their best performance. Before the TT, participants
579
respected a 15-min warm-up (10 minutes at a workload of 100 W and 5 minutes at 50% of the
580
Post MPO). Both warm-up and TT were performed on participants’ own bike mounted on a
581
braked Cyclus2 ergometer (RBM GmbH, Leipzig, Germany). To mimic field conditions, the
triathletes were provided with distance, speed, PO, cadence information and ad libitum sport
583
drinks and water. Every five minutes during the TT, subjects’ rating of perceived exertion
584
(RPE) was recorded using the 6-to-20 point Borg’s scale13. This scale measures effort sensation,
585
with 6 corresponding to sitting in a chair, and 20 to the maximal effort ever experienced.
586 587
fMRI experiment
588
Participants came to the lab on the second day after the end of phase III. On this day, they
589
performed an inter-temporal choice calibration procedure to elicit their indifference curve.
590
Inter-temporal choices were real in the sense that the chosen option in one pseudo-randomly
591
selected trial was actually implemented (any trial could be drawn, except those where a delay
592
longer than one year had been selected). Subjects then performed two sessions of executive
593
tasks while fMRI data were acquired. Each session lasted for about 45 minutes (5 mins of setup,
594
10 mins of structural MRI acquisition before the first and after the last session, + 30 mins of
595
functional MRI during task performance). Sessions were divided into three consecutive runs of
596
N-switch blocks (two 12-switch runs separated by one 1-switch run) and three consecutive runs
597
of N-back blocks (two 3-back runs separated by one 1-back run). Each run comprised five
598
successive blocks. The task to be performed was indicated by a 5-s instruction screen presented
599
at the beginning of each block. The length of blocks was randomly varied between 16 and 32
600
trials (24 on average, duration = 43s) for N-switch tasks and between 18 and 26 trials (22 on
601
average, duration = 40s) for N-back tasks. The order of N-switch and N-back tasks was
602
counterbalanced across subjects. Every 50s on average (at the end of blocks), another 5-s
603
instruction screen indicated to participants that they would have to make three successive
inter-604
temporal choices, giving a total of 90 choices per session. The options proposed in
inter-605
temporal choices were tailored based on the results of the calibration session conducted just
606
before the fMRI experiment.
608
Behavioral tasks
609
For executive tasks, participants were instructed to reach the best possible performance level
610
(correct response rate) with the shortest possible response time. On the week before the
611
experiment as well as on the day of the experiment (before MRI sessions) they read the
612
instructions and were trained to perform all versions of executive tasks until they reached a
613
performance criterion (4 consecutive blocks above 90% of correct responses), or until they
614
reached a maximal duration of three hours.
615 616
In both the N-back and N-switch tasks, letters appeared successively at the center of the screen.
617
They could be vowels (e,a,i,o,u,y) or consonants (b,c,g,k,m,p), written with either upper or
618
lower case, and with either red or green color. On every trial, the letter was displayed for 900
619
ms, corresponding to the time window during which participants could give their response,
620
followed by a blank screen lasting for 400 ms.
621 622
For the N-back task, participants were instructed to indicate when the current letter was the
623
same as that presented N trials before. The ‘yes’ and ‘no’ responses were given by pressing left
624
or right arrow on the keyboard (key-response associations being counterbalanced across
625
participants). Difficulty was manipulated by changing N from 1 (easy version) to 3 (hard
626
version). The sequence of letters was pseudo-randomized so as to get one third of ‘yes’ and two
627
thirds of ‘no’ trials, among which half was made of traps (2- or 3-back repeats in the 1-back
628
version, and 1- or 2-back repeats in the 3-back version). Color and case were varied but had to
629
be ignored in this task.
630 631
For the N-switch task, color served as a contextual cue telling participants whether to perform
632
a vowel/consonant or an upper/lower case discrimination task. As an example, a subject had to
633
indicate consonant (left arrow) versus vowel (right arrow) when the letter was green, or upper
634
case (left arrow) versus lower case (right arrow) when it was red. Colors, discrimination tasks
635
and response keys were fully counterbalanced across participants. Letters were
636
pseudorandomly distributed over trials in order to balance the frequency of each task
637
(vowel/consonant or upper/lower case discrimination) and the side of correct response (left or
638
right). The difficulty was imposed by the frequency of switches (color changes) from one per
639
block in the easy version to 12 per block (40% of trials) in the hard version.
640 641
Just before the experiment, participants performed a calibration session with real choices. They
642
were told that one of the choices made either during the calibration or during test sessions would
643
be randomly drawn and implemented. This was actually done except that randomization was
644
biased in order to exclude delays longer than one year. The amount of money that they could
645
get varied between 1€ and 100€, which was quite significant relative to the fixed payoff (400€
646
for the entire experiment).
647 648
Choice task trials were intermingled with executive task trials (three per minute on average).
649
There were 90 choices per fMRI session, thus a total of 180 choices in the entire experiment.
650
Every trial, participants had a maximum of 5 s to state their preference between a small
651
immediate reward (with variable amount) and a delayed reward (with variable reward and
652
delay). The location (left or right) of the immediate and delayed options on the screen was
653
counterbalanced across trials. There were ten possible delays (3 days, 1 week, 2 weeks, 3 weeks,
654
1 month, 3 months, 6 months, 1 year, 5 years and 10 years) and three possible delayed rewards
655
(50€, 75€, 100€), which were presented in a randomized order. The immediate rewards were
derived from subject-specific indifference points, which describe how each of the delayed
657
reward is discounted with delay. These indifference points were obtained using a bisection
658
procedure (with 11 steps for each delayed reward and each delay) that was implemented in the
659
calibration session following on our previous study 5. In each session of the experiment, three
660
immediate rewards were presented for each of the ten delays and each of the 3 delayed rewards:
661
one around the indifferent point, one above and one below. The two options of a choice were
662
therefore close in (discounted) value, maximizing the sensitivity to potential fatigue effects, as
663
it was previously implemented for TMS studies 52. Between sessions, the amounts proposed as
664
immediate rewards were randomly varied by +/- 1€ to avoid repeating choices and hence
665
automatic responding. Note that delays and reward levels were different in the calibration
666
procedures used for the other datasets included as a reference point for the immediacy bias. The
667
immediacy bias is nevertheless comparable across datasets, because it is an additive parameter
668
(on top of reward and delay terms in the computation of subjective value).
669 670
Behavioral data analysis
671
Two main dependent variables were analyzed: first executive performance (correct choice rate
672
in hard relative to easy executive tasks, N-back and N-switch trials pooled together), second
673
the parameters of the best choice model (present bias, discount factor and choice temperature).
674
For each variable the main analyses tested the main effect of training overload (comparison
675
between groups), the main effect of acute physical exercise (comparison between sessions), as
676
well as the interaction between these two factors. Main effects and interactions were assessed
677
using two-way ANOVA, with session as a within-subject factor and group as a between-subject
678
factor. For comparisons involving only one factor (such as comparing between groups the
679
model parameters fitted on the calibration choices), we used two-tailed t-tests. We checked that
680
all significant results were maintained when we replaced t-tests by non-parametric tests
(Wilcoxon rank sum tests). For testing the effect of training overload on the immediacy bias,
682
we also computed the exact probability of obtaining at least the same mean, in a group of the
683
same size, from random sampling (1,000,000 iterations) within the cohort of control
684 participants (n=106). 685 686 Computational modeling 687
To fit impulsive choices (selection of immediate reward IR vs. delayed reward DR), we used a
688
standard softmax function of the relative value (RV) between the two options. This standard
689
model was compared to a variant including an additive immediacy bias that captures a
690
preference for the present independently from rewards and delays (eq 1 vs eq 2). In both cases,
691
RV was weighted by a temperature parameter 𝛽 that adjusts the stochasticity of choices. To
692
calculate RV, we compared two classical delay discounting models, where rewards decrease
693
hyperbolically vs. exponentially with delay (see eq 3 vs. eq 4). In both cases, sensitivity to delay
694
(D) was captured by a discount parameter k. The four models were:
695 𝑃(𝐼𝑅) = 1 1+exp(𝑅𝑉 𝛽) , (𝑒𝑞 1); 𝑃(𝐼𝑅) = 1 1+exp(𝑅𝑉 𝛽−𝑏𝑖𝑎𝑠) , (𝑒𝑞 2); 𝑅𝑉 = 𝐷𝑅 1+𝑘𝐷− 𝐼𝑅, (𝑒𝑞 3); 696 𝑅𝑉 = 𝐷𝑅 × exp(−𝑘𝐷) − 𝐼𝑅, (𝑒𝑞 4). 697
The four models (two softmax times two discounting functions) were fitted to choices made
698
during the calibration session (210 choices) and during each MRI session separately (90 choices
699
each) by the two groups of participants. Models were inverted by minimizing free energy, using
700
a variational Bayes approach under the Laplace approximation 53,54, as implemented in the VBA
701
Matlab toolbox 55, available at http://mbb-team.github.io/VBA-toolbox/). This algorithm not
702
only inverts nonlinear models to provide posterior distributions on fitted parameters, but also
703
estimates their evidence, which represents a trade-off between accuracy (goodness of fit) and
704
complexity (degrees of freedom). The log-evidences, estimated for each participant and model,
705
were submitted to a group-level random-effect analysis 56. This analysis was used to generate
exceedance probability, which measures the plausibility that a given model is more frequently
707
implemented by participants that any other model in the comparison set. For the calibration
708
session choices, priors were set between 0 and .1 for the discount rate parameter k, and between
709
0 and 10 for the choice stochasticity parameter 𝛽, with variance being adjusted so as to get a
710
flat prior. For the immediacy bias parameter, prior distribution was centered on 0, with a
711
variance equal to 1 (or 0 for the model without bias). For the MRI session choices, priors were
712
centered on the posterior means estimated on calibration choices. An illustration of best model
713
fit is provided in Fig. 4.
714 715
MRI data acquisition
716
T2*-weighted echo planar images (EPIs) were acquired with BOLD contrast on a 3.0 T
717
magnetic resonance scanner (Siemens Verio). A tilted-plane acquisition sequence was used to
718
optimize sensitivity to BOLD signal in the orbitofrontal cortex (44). To cover the whole brain
719
with sufficient temporal resolution (TR = 2.180s) we used the following parameters: 40 slices,
720
2.5 mm thickness, 1mm interslice gap. Structural T1-weighted images were coregistered to the
721
mean EPI, segmented and normalized to the standard T1 template and then averaged across
722
subjects for anatomical localization of group-level functional activation. EPI images were
723
analyzed using statistical parametric mapping (SPM8) environment (Wellcome Trust Center
724
for NeuroImaging, London, UK). Preprocessing consisted of spatial realignment,
725
normalization using the same transformation as anatomical images, and spatial smoothing using
726
a Gaussian kernel with a full width at a half-maximum of 8 mm.
727 728
MRI data analysis
729
In order to identify regions involved in both executive tasks and inter-temporal choices, we
730
regressed subject-level preprocessed fMRI time series against the following GLM. Two first