HAL Id: tel-00731252
https://tel.archives-ouvertes.fr/tel-00731252
Submitted on 12 Sep 2012
HAL is a multi-disciplinary open access archive for the deposit and dissemination of sci-entific research documents, whether they are pub-lished or not. The documents may come from teaching and research institutions in France or abroad, or from public or private research centers.
L’archive ouverte pluridisciplinaire HAL, est destinée au dépôt et à la diffusion de documents scientifiques de niveau recherche, publiés ou non, émanant des établissements d’enseignement et de recherche français ou étrangers, des laboratoires publics ou privés.
de la dynamique des éruptions Stromboliennes de l’Etna
Mathieu Gouhier
To cite this version:
Mathieu Gouhier. Application du radar Doppler (VOLDORAD) à l’étude de la dynamique des érup-tions Stromboliennes de l’Etna. Volcanologie. Université Blaise Pascal - Clermont-Ferrand II, 2008. Français. �NNT : 2008CLF21888�. �tel-00731252�
ÉCOLE DOCTORALE DES SCIENCES FONDAMENTALES
THÈSE
Présentée pour obtenir le grade de
DOCTEUR D’UNIVERSITÉ
Spécialité : Volcanologie
par
Mathieu GOUHIER
Diplômé de Master RechercheApplication du radar Doppler (VOLDORAD) à l’étude de
la dynamique des éruptions Stromboliennes de l’Etna
Soutenue publiquement le 28 Novembre 2008 devant la commission d’examen composée de : Patrick ALLARD Laboratoire Pierre Süe, CE – Saclay Rapporteur Mauro COLTELLI INGV – Sezione di Catania (Italia) Rapporteur Sylvie VERGNIOLLE Institut de Physique du Globe de Paris Examinatrice Jean-François LÉNAT Université Blaise Pascal, Clermont-Ferrand II Président
Franck DONNADIEU Université Blaise Pascal, Clermont-Ferrand II Directeur de thèse Timothy DRUITT Université Blaise Pascal, Clermont-Ferrand II Directeur de thèse
ÉCOLE DOCTORALE DES SCIENCES FONDAMENTALES
THÈSE
Présentée pour obtenir le grade de
DOCTEUR D’UNIVERSITÉ
Spécialité : Volcanologie
par
Mathieu GOUHIER
Diplômé de Master RechercheApplication of Doppler radar (VOLDORAD) to the study
of Strombolian eruptions dynamics at Etna
Soutenue publiquement le 28 Novembre 2008 devant la commission d’examen composée de : Patrick ALLARD Laboratoire Pierre Süe, CE – Saclay Rapporteur Mauro COLTELLI INGV – Sezione di Catania (Italia) Rapporteur Sylvie VERGNIOLLE Institut de Physique du Globe de Paris Examinatrice Jean-François LÉNAT Université Blaise Pascal, Clermont-Ferrand II Président
Franck DONNADIEU Université Blaise Pascal, Clermont-Ferrand II Directeur de thèse Timothy DRUITT Université Blaise Pascal, Clermont-Ferrand II Directeur de thèse
Tout d’abord, je tiens à remercier aussi sincèrement que chaleureusement Franck Donnadieu pour son encadrement sur ce sujet technique et tout à fait nouveau. Merci de m’avoir fait confiance en me laissant notamment beaucoup d’autonomie et d’indépendance dans la réalisation de mon travail de thèse. Tu as été encadrant et collaborateur à mon sens, ce qui m’a permis, je crois, une vraie émancipation dans ma démarche de recherche, grâce notamment, aux nombreux conseils et discussions que nous avons pu avoir. J’ai beaucoup apprécié nos relations de travail, avec simplicité et bonne humeur, ce qui est à mon avis, indispensable au bon déroulement d’un travail en collaboration. Dès le DEA, où nous avons fait du terrain ensemble au Costa Rica, mais aussi par la suite, j’ai pu apprécier tes qualités humaines qui m’ont rendu ces quatre années fort agréables. J’espère ainsi que nous aurons à nouveau l’occasion de travailler ensemble.
Merci à mon deuxième directeur de thèse: Tim Druitt, notamment pour son aide quant à la rédaction des articles de ma thèse, mais aussi pour ses précieux conseils et son expérience. Merci au Laboratoire Magmas et Volcans et les deux directeurs que j’ai connu pendant ces quatre années, Olivier Merle et Pierre Schiano, pour m’avoir permis la réalisation de ce travail de thèse.
Mes remerciement se tournent maintenant vers les personnes sans qui ce travail sur VOLDORAD n’aurait pas pu être réalisé, je veux parler de tous ceux qui ont contribué de près ou de loin à la réalisation de ce projet à Clermont-Ferrand, depuis sa germination jusqu'à la fabrication du radar et à l'acquisition des données à l'Etna, en particulier J. Kornprobst, G. Dubosclard, Roland Cordesses, Claude Hervier, Jacques Fournet-Fayard ainsi que l'ensemble des membres du Service de Développement Technique de l'OPGC. Les soutiens durables de Jean-François Lénat, Timothy Druitt, Claude Jaupart (contrat INSU-PNRN) et de Patrick Allard (contrat CEE MVRRS: Monitoring Volcanic Risks by Remote Sensing, ENV4-CT96-288, coordonné par Peter Francis) ont également été très précieux.
Un grand merci à Sylvie Vergniolle, tout d’abord pour avoir mis à disposition ses données acoustiques, mais surtout pour son aide indispensable sur ce travail de corrélation radar-acoustique. Merci a Patrick Allard qui a contribué aux mesures radar des 4, 7, 13 Juillet 2001, pour avoir effectué seul les mesures radar des 29 et 31 Juillet, et fourni ses enregistrements vidéo.
Je tiens aussi à remercier le jury d’avoir accepté de juger mon travail, et permis l’amélioration de mon manuscrit de thèse : les rapporteurs Patrick Allard et Mauro Coltelli, Sylvie Vergniolle en tant qu’examinatrice, et le président du jury Jean-François Lénat.
A présent mes remerciements se tournent vers mes collègues : des thésards avant tout ! Je vais être bref et non exhaustif sinon je crois que je devrais écrire une seconde thèse rien que de « private jokes » et autres spéciales dédicaces. Alors un grand merci à tous pour ces trois années passées entre les quatre murs du LMV où les cinq continents se côtoyèrent tous les jours pour mon plus grand plaisir. Je n’oublie pas non plus les extérieurs J/E/R qui se reconnaîtront…il est loin le temps du gormen’s.
Je souhaite maintenant remercier ma famille qui fut toujours à mes coté pendant toutes ces années d’études…et même avant ! Enfin, mes plus grands mercis se tournent vers la personne la plus chère à mon cœur, ma mie : Armelle, qui a aussi passé pas mal de temps avec VOLDORAD ces trois dernières années. Elle m’a apporté tellement que ces quelques mots ne suffisent évidemment pas à retranscrire l’importance et la nécessité de sa présence à mes cotés.
Abstract
VOLDORAD, a low power UHF Doppler radar, is a portable ground-based system, developed by the Observatoire de Physique du Globe de Clermont-Ferrand (France), especially for the study of explosive volcanic activity. The capabilities of such remote sensing methods to probe safely hazardous eruption jets and plumes constitute a real step forward regarding the in-depth analysis of physical processes controlling the dynamics of volcanic eruptions. The main objective of this work is to bring more stringent constraints, particularly from the development of methodological procedures, on the interpretation of Doppler radar data, with the final aim of better understanding the explosive dynamics. This study has been achieved from Doppler radar measurements carried out at Etna Southeast crater during the eruption of July 4, 2001, and focused on the Strombolian activity. However, processing methods, theoretical forward models and inversion procedures developed here have been achieved with the scope of a more general application, i.e., for various types of eruptions. The thorough analysis of Strombolian explosions by ground-based Doppler radar has permitted to obtain a wide range of source parameters, mainly related to kinetic, loading and geometrical features. Accurate quantitative assessment of these parameters and their evolution with time is crucial for (1) monitoring and early warning of active volcanoes, and (2) to provide better constraints on assumptions included in models of eruptive dynamics, useful for the volcanological community, as well as for ash dispersal prediction models used for risk mitigation.
Résumé
VOLDORAD, un radar Doppler UHF moyenne puissance, est un système portable basé au sol, développé par l’Observatoire de Physique du Globe de Clermont-Ferrand (France), spécifiquement pour l’étude de l’activité volcanique explosive. La capacité de ces méthodes de télédétection à sonder l’intérieur des jets et des panaches volcaniques dangereux constitue un vrai pas en avant concernant l’analyse des paramètres physiques qui contrôlent la dynamique des éruptions volcaniques. L’objectif principal de cette thèse est d’apporter des contraintes plus précises, notamment à partir du développement de procédures méthodologiques, sur l’interprétation des données radar Doppler, dans le but final d’améliorer notre compréhension de la dynamique explosive. Ce travail a été réalisé à partir de mesures radar Doppler acquises pendant l’éruption du cratère Sud-est de l’Etna en Juillet 2001, et s’intéresse plus particulièrement à l’activité Strombolienne. Cependant, les méthodes de traitement, les modèles directs et les procédures d’inversion développés dans cette étude ont été réalisés dans une optique plus générale, et applicable sur différents types de dynamismes. L’étude détaillée de l’activité Strombolienne par la méthode radar Doppler a permis d’obtenir une large gamme de paramètres sources, notamment : les vitesses et masses de gaz et de particules, ainsi que les caractéristiques géométriques des jets. L’estimation quantitative précise de ces paramètres, et de leur évolution au cours du temps est cruciale pour (1) la surveillance et la détection précoce de l’activité volcanique, ainsi que (2) pour l’apport de contraintes sur les hypothèses formulées dans les modèles de dynamique éruptive et dans les modèles de prédiction de dispersion des cendres, indispensables à la minimisation des risques.
CONTENTS
11 17 37 61 95 123 161 199 211 217 227 IntroductionChapter I – Basics of explosive dynamics at Mt. Etna and introduction to remote
measurements methods in volcanology
Chapter II –VOLDORAD (Volcano Doppler Radar): technical characteristics and
theoretical considerations
FIRST PART: DOPPLER RADAR STUDY
Chapter III – Kinetic features of Strombolian jets: insight from coupled Doppler
radar and numerical modelling approach, and correlation with video data
Chapter IV– Loading features of Strombolian jets: insight from inversion of
Doppler radar measurements
Chapter V – Geometrical features of Strombolian jets: insight from numerical
modelling of Doppler-radar spectra
SECOND PART: MULTI-METHOD APPROACH
Chapter VI – Acoustic-video correlations: The last steps of a Strombolian bubble
approaching the top of the magma column
Chapter VII – Acoustic-radar correlations: constraints on the shallow dynamics
of Strombolian explosions
Conclusions and further works References
11 17 19 19 19 20 21 22 24 24 26 27 28 29 29 30 30 32 33 37 39 39 42 44 44 44 44 46 46 48 49 49 51 53 61 63 64 64 65 Introduction
Chapter I - Basics of explosive dynamics at Mt. Etna and introduction to remote sensing methods in volcanology
I.1. Mt. Etna Volcano and its explosive dynamisms I.1.1. Volcanological context of Mt. Etna
I.1.1.1. Geodynamical setting
I.1.1.2. Past activity and Etna edification
I.1.2. Eruptive dynamics at Etna I.1.3. The July-August 2001 eruption I.2. Dynamics of explosive basaltic eruptions
I.2.1. Strombolian vs. Hawaiian activity
I.2.2. Deep origin of explosive basaltic eruptions
I.2.2.1. Collapsing foam (CF) model I.2.2.2. Rise speed dependent (RSD) model
I.3. Introduction to remote sensing techniques I.3.1. Satellite-based methods
I.3.2. Ground-based methods
I.3.2.1. Spectroscopic remote sensing techniques I.3.2.2. Acoustic measurements
I.3.2.3. Doppler radar systems
Chapter II - VOLDORAD (Volcano Doppler Radar): Technical characteristics and theoretical considerations
II.1. Presentation of VOLDORAD
II.1.1. VOLDORAD technical characteristics II.1.2. VOLDORAD setting at Etna on July 4, 2001 II.2. VOLDORAD parameters acquisition
II.2.1. Radar power and velocity
II.2.1.1. Recorded power II.2.1.2. Recorded velocity
II.2.2. Calculation of the spectral moments
II.2.2.1. Doppler spectra II.2.2.2. Time series
II.3. Doppler radar: theoretical considerations II.3.1. Formulation of the radar equation II.3.2. Calculation of the radial velocity
II.3.3. Calculation of the power spectral density
FIRST PART: DOPPLER RADAR STUDY
Chapter III - Kinetic features of Strombolian jets: insight from coupled Doppler radar and numerical modelling approach, and correlation with video data
III.1. Introduction
III.2. Insight from video analysis method
III.2.1. Lava-bubble vs. lava-jet explosions III.2.2. Video-derived gas measurements
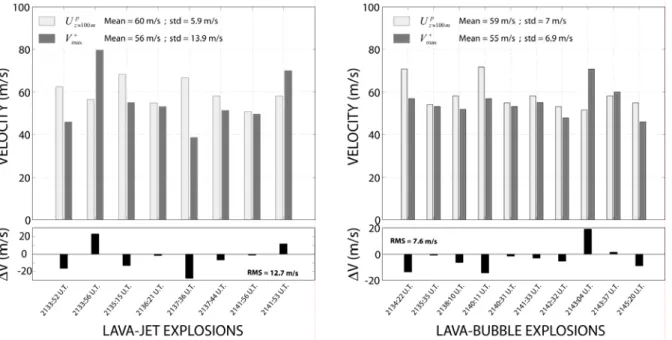
III.2.3. Video-derived particles measurements 66 68 69 70 72 74 74 75 75 77 77 79 81 82 84 86 89 89 90 91 92 95 97 98 99 103 105 105 107 108 108 109 110 111 114 114 116 117 118 III.2.4. Radar/video correlations of particles velocities
III.2.4.1. Lava-jet explosions III.2.4.2. Lava-bubble explosions
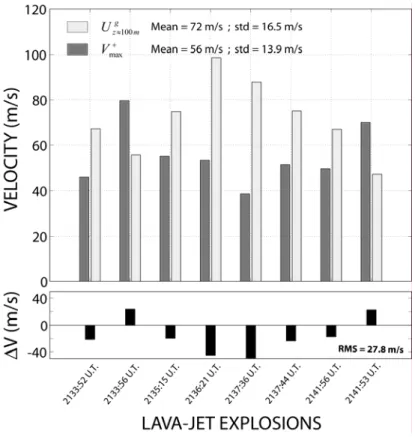
III.2.5. Radar/video correlations of gas velocities III.3. Insight from numerical ballistic model
III.3.1. Ballistic model definition III.3.2. Parametric constraints III.3.3. Gas vs. particles velocities III.4. Source parameters retrieval method
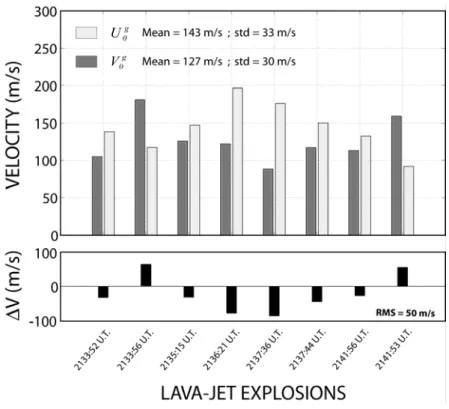
III.4.1. Initial gas velocity retrieval
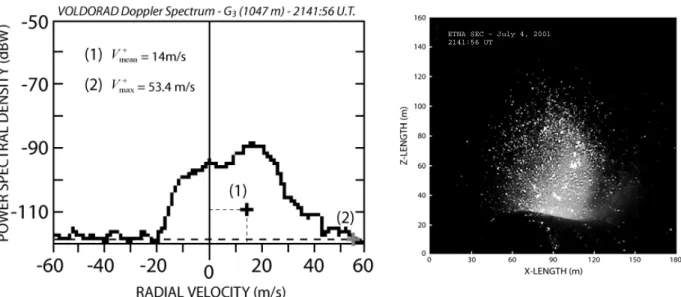
III.4.2. Initial particle velocity and mean diameter retrieval III.5. A case study: explosion at 2141:56 UT
III.5.1. Initial gas and particles velocities
III.5.2. Comparison of radar/video initial gas velocities
III.5.3. Gas velocity decrease: insight from radar and video methods III.6. Long sequence analysis of Strombolian activity
III.6.1. Doppler radar data
III.6.2. Kinetic parameters retrieval III.6.3. Loading parameters retrieval II.7. Discussion
Chapter IV - Loading features of Strombolian jets: insight from inversion of Doppler radar measurements
IV.1. Introduction
IV.2. Acquisition of radar power parameters IV.3. Electromagnetic scattering model IV.4. Inversion method
IV.5. Polydisperse particle size model IV.5.1. Particle size distribution IV.5.2. Parameter constraints
IV.5.2.1. Shape factor, k IV.5.2.2. Shift factor, Λ IV.5.2.3. Scale factor, Nmax IV.6. Monodisperse particle size model IV.7. Radar data
IV.8. Results
IV.8.1. Particle loading parameters IV.8.2. Derived parameters
IV.8.3. Possible effects of outsized particles IV.9. Discussion
Chapter V - Geometrical features of Strombolian jets: insight from numerical 123 125 126 126 128 131 132 135 137 138 138 141 142 144 144 147 150 150 151 153 159 161 165 164 165 165 166 167 169 169 170 171 172 174 175 modelling of Doppler-radar spectra
V.1. Introduction
V.2. Recorded Volcano Doppler spectra (VOLDORAD) V.2.1. Data acquisition with VOLDORAD V.2.2. Spectral moment calculations
V.3. Synthetic Volcano Doppler spectra (numerical modelling) V.3.1. Ballistic model
V.3.2. Electromagnetic scattering model V.3.3. Synthetic Doppler spectra V.4. Parametric tests
V.4.1. Ejection angle vs. particle sizes distribution sensitivity V.4.2. Ejection angle anisotropy
V.4.3. Mean ejection angle inclination
V.5. Geometrical properties of two contrasted Strombolian explosions V.5.1. Top-hat-shaped spectra
V.5.2. Triangular-shaped spectra
V.6. Statistical analysis of geometrical features for a large number of characteristic Strombolian explosions
V.6.1. Relationship between radial velocity and ejection angle V.6.2. Statistical analysis of isotropic distributions
V.6.3. Ejecta concentration inside the dispersion cone V.7. Discussion
SECOND PART: MULTI-METHOD APPROACH
Chapter VI - Acoustic-video correlations: the last steps of a Strombolian bubble approaching the top of the magma column
VI.1. Introduction
VI.2. Setting and material
VI.3. Acoustic and video observations data VI.3.1. Description of video data
VI.3.1.1. Bubble radius measurement procedure VI.3.1.2. Instabilities on the magma-air interface VI.3.1.3. Bubble vibration mode
VI.3.1.4. Magmatic film rupture
VI.3.2. Description of acoustic data
VI.3.2.1. Acoustic waveforms of typical Strombolian explosions VI.3.2.2. Detailed analysis on 9 large bubbles
VI.3.2.3. Bubble depth estimate corresponding to the first acoustic precursor VI.3.2.4. Spectral content analysis on a 300-s sequence
176 176 176 178 180 181 182 185 186 186 186 188 193 194 196 199 201 201 201 203 204 205 205 206 207 208 209 211 217 227 229 235 245 VI.4. Theoretical features
VI.4.1. Possible sources of sound generation
VI.4.1.1. Acoustic precursors: bubble vibration at depth VI.4.1.2. Main acoustic pulse: bubble nose vibration at the magma-air interface
VI.4.1.3. Last acoustic event: bubble bottom vibration VI.4.1.4. Summary of possible mechanisms at work
VI.4.2. Synthetic modelling of acoustic waveform VI.4.3. Video-derived modelling of acoustic waveform
VI.5. Results: Comparison between measured, synthetic and video-derived acoustic waveforms
VI.5.1. Bubble Vibration as a source of sound
VI.5.1.1. Synthetic vs. measured acoustic waveform comparison VI.5.1.2. Synthetic vs. video-derived acoustic waveform comparison VI.5.1.3. Video-derived vs. measured acoustic waveform comparison
VI.5.2 Alternative mechanism: balloon bursting model VI.6. Conclusion
Chapter VII - Acoustic-radar correlations: constraints on the shallow dynamics of Strombolian explosions
VII.1. Introduction
VII.2. Temporal correlations of acoustic and radar measurements VII.2.1. The case of four large bubbles
VII.2.2. Analysis of a 100-s sequence of Strombolian activity VII.2.3. Acoustic pressure as a function of the radial velocity VII.3. Gas velocity correlations from acoustic and radar measurements
VII.3.1. Calculation of the gas velocity from acoustic measurements VII.3.2. Example on 9 large bubbles
VII.3.3. Analysis of a 100-s sequence of Strombolian activity
VII.3.4. Long period correlation between acoustic and radar measurements VII.4. Conclusion
Conclusions and further works References
Appendix
Appendix A: Ballistic model equations and code
Appendix B: Electromagnetic scattering model equations, code and graphical interface Appendix C: Gouhier, M., and F. Donnadieu (2008), Mass estimation of ejecta from
Strombolian explosions by inversion of Doppler radar measurements, J. Geophys. Res., 113, B10202.
Volcanoes: a dynamic phenomenon actively displaying tremendous spectacles, remain the seat of too often unexpected killing disasters, reminding us the importance of better understanding eruptive mechanisms.
The study of eruptive dynamics is however very complex, particularly because of the spatial evolution of physicochemical processes integrated over the whole edifice scale. Indeed, the diversity of volcanic surface activities is the result of deeply rooted mechanisms emerging from the chamber (bubble nucleation and coalescence, foam collapsing, etc.) and evolving in the conduit (exsolution, coalescence, gas overpressurisation and fragmentation) up to the free surface of the magma column (bubble expansion and bursting, lava clots ejection). Moreover, the evolution of these processes on various time scales adds to the difficulties of understanding eruption dynamics. Besides, some technical difficulties of measurements related to huge and hazardous volcanic phenomena also make the study of volcanic activity not easy. Indeed, in some cases, in situ measurements are unfeasible, particularly for the explosive dynamics (Strombolian activity, ash plumes or pyroclastic flows), but also regarding deep mechanisms occurring from the magma chamber to the conduit surface. Therefore, remote sensing instruments turn out to be key tools for in-depth analysis of integrated eruptive processes. Many remote sensing techniques have been used for a few decades in order to better understand the dynamics of explosive eruptions. Satellite imagery and ground-based weather radars have been used rather to monitor the long-range evolution of ash dispersion than dynamics itself.
A major challenge is now to measure physical quantities closer to the vent in order to retrieve directly the true source parameters (1) that potentially provide more stringent constraints on the eruption dynamics, and (2) that permits close volcano monitoring for early warnings and risks mitigation: such is the purpose of this thesis.
In this work, we focus on the study of Strombolian dynamics at Mount Etna volcano by means of a pulsed ground-based Doppler radar (VOLDORAD = Volcano Doppler Radar) developed by the Observatoire de Physique du Globe de Clermont-Ferrand (France) specifically for the sounding of explosive volcanic activity. First studies, carried out at Etna during the eruption of October 1998 (Dubosclard et al., 1999, 2004) for the testing of VOLDORAD, had pointed out the great potential of Doppler radar techniques for volcanic applications. Further works realized at Etna (Italy) during the eruption of July-August 2001,
and at Arenal volcano (Costa Rica) in February 2004, have proved the powerful capabilities of VOLDORAD to retrieve quantitative estimates of source parameters on various types of volcanic activity (Donnadieu et al., 2003, 2005). A second step has been achieved in this thesis with the retrieval of loading parameters (Gouhier and Donnadieu, 2008). In addition, some efforts have been made in the understanding of Doppler radar signals for a better interpretation of kinetic and geometric parameters particularly.
The analysis of surface processes by ground-based Doppler radar potentially permits to obtain two sets of fundamental parameters: (1) velocimetric parameters (e.g., particle and gas velocities, gas fluxes, kinetic energy), and (2) loading parameters (e.g., ejected particle mass, ejecta concentration, volume, mean particle diameter, mass fluxes, thermal energy). Furthermore, information on geometrical features of lava jets and plumes can also be assessed.
This thesis work has particularly focused on the development of methodological procedures that aimed at improving our interpretation of the Doppler radar data, with the final goal of better understanding eruption processes and source parameters valuable to the volcanological community. This work has been achieved from Doppler radar measurements carried out at Etna southeast crater (SEC) during episodes of Strombolian activity in July 2001. Nevertheless, processing methods, theoretical forward models and inversion procedures developed in this study have been realized with the scope of a more general application, i.e., for various types of eruptive dynamisms, ranging from mild Strombolian activity to large ash plumes. Thus, we did not aim at investigating in depth physical mechanisms at work at Etna but rather to develop some general tools that could be further used routinely in volcano monitoring as well as for scientific investigations of a given eruptive behaviour. Mount Etna is rather used as first-rate example of explosive basaltic volcano to test and improve the interpretations of Doppler radar data.
Also, comparisons with other techniques (video, acoustic) probing the same object but with different angle shots has been carried out. Video methods portray the surface activity as well as VOLDORAD and hence permit close correlations valuable to validate interpretations of Doppler radar signals. Acoustic methods are particularly interesting to describe shallow processes at the interface between the surface and the chamber. Comparisons with Doppler radar signals must bring interesting constraints on the decoupling of physical processes from depth to the surface. Comparisons between Doppler radar and other techniques that represent
a smaller part of this thesis have to be regarded as preliminary works. However, they appear promising in the study of eruption dynamics to unravel the links between degassing processes at depth and the surface eruptive behaviour of a volcano.
The first chapter of this manuscript gives a brief overview of the volcanological context at Mt. Etna: the explosive basaltic dynamism and particularly the description of the eruption that took place in July, 2001. We then review remote sensing techniques applied to volcanic eruptions described in the literature.
The second chapter is devoted to the detailed presentation of VOLDORAD, whose data have been used extensively, and more generally to the Doppler radar technique.
In a first part, that comprises the chapters III, IV and V, we focus on the study of Doppler radar data, in particular for the analysis of kinetic, loading and geometrical features:
- The third chapter is devoted to the study of Doppler radar velocity measurements from a coupled approach with ballistic numerical modelling and video analysis. We particularly focus on gas/particle discrimination, and quantitative assessment of source parameters such as initial gas and particle velocities.
- In chapter four we present a method to estimate particle loading parameters (mass, volume, concentration, mean particle diameter particularly) of eruptive jets by inversion of echo-power data measured by VOLDORAD. The automatic inversion algorithm uses the complete Mie (1908) formulation of electromagnetic scattering waves. We also present an alternative approximation specifically devoted to the rapid assessment of loading parameters for real-time volcanic monitoring purposes.
- The fifth chapter presents a complete synthetic model of Doppler radar spectra devoted to the understanding of geometrical properties of Strombolian jets, based on both ballistic and electromagnetic scattering models mentioned previously.
The second part, which comprises the chapters VI and VII, is devoted to the correlations of acoustic-video and acoustic-radar methods:
- In chapter six we focus on acoustic and video measurements for the study of bubble oscillation and bursting mechanisms at the top of the magma column. In spite of some difficulties related to the visual observations, the thorough analysis of video snapshots permits to build video-derived acoustic waveforms subsequently compared with
recorded acoustic waveforms. In addition, by best fit matching of synthetic acoustic waveforms generated by a theoretical bubble vibration model with video-derived and recorded acoustic waveforms, we can estimate crucial physical parameters such as bubble overpressure and volume.
- In the last chapter, we have carried out preliminary correlations between acoustic and radar measurements. Processes recorded by these two methods are different but directly linked, as the overpressurized bubble bursting is at the origin of the fragmentation and ejection of lava clots subsequently recorded by VOLDORAD.
CHAPTER I
Basics of explosive dynamics at Mt. Etna and
I.1 Mt. Etna Volcano and its explosive dynamisms
We present here some general elements related to the geological framework of Mount Etna Volcano and some basics related to the explosive dynamism. However, bearing in mind the technical purposes of this thesis that shed light on methodological aspects rather than focusing on the volcanic dynamism itself, we just aim at giving a brief introduction necessary to the understanding of that work.
I.1.1. Volcanological context of Mt. Etna
I.1.1.1. Geodynamical setting
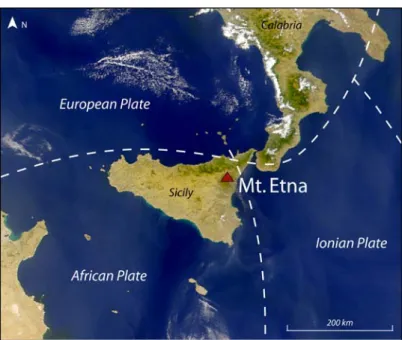
Mount Etna is the largest European active volcano covering an area of 1250 km² and reaching 3340 m elevation. It lies on the Sicilian continental crust (30 km thick), at the boundary with the African and European plates (Figure I.1), and the Ionian micro-plate constituted by a thinner (10-12 km) oceanic crust that undergoes subsidence and consumption below Calabria (Scandone et al., 1981).
Figure I.1. Satellite-based view of Mt. Etna (Sicily) showing its focal position between
The geodynamical context of Mt. Etna volcano is complex and the origin of the volcanism is still a matter of debate. Hotspot origin has long been suggested associated with upwelling of deep mantle material (e.g., Tanguy et al., 1997; Clocchatti et al., 1998), but more recent studies have also pointed out the possible contribution of subduction-related mechanisms (Schiano et al., 2001). Further shallow structural processes have been proposed to explain the edification of Mt. Etna. As many volcanoes, it was first assumed that Etna derives from an extensional strain field. On the contrary, taking into account the regional framework of eastern Sicily, Lentini (1982) concludes that Etna functions in a sector undergoing compression. More recent studies, owing to the distribution of the discontinuities have suggested that recent volcanic activity at Etna is controlled by deep-seated “rift zones” oriented mainly N-S, (e.g., Tanguy and Kieffer., 1993; Lanzafame et al., 1997b). Numerous geophysical studies (e.g., Chiarabba, 2000; Patanè et al., 2002) have provided some constraints on the structure of the crust that revealed two main units: the first one is constituted (0 – 3.5 km) of flysch nappes and the second one (3.5 – 10 km) of carbonated nappes. These sediments lie on 8 – 10 km of crystalline crust constituted of metamorphic rocks. This substratum is intersected by a wide plutonic body that represents the dykes’ network of the feeding system.
I.1.1.2. Past activity and Etna edification
The earliest geological studies of Etna volcano were performed during the first half of the 19th century (e.g., Gemmellaro, 1858). They compiled the first geological map of Etna and performed the first stratigraphic studies that allowed them to recognize the polygenetic origin of the volcano. More recent stratigraphic and structural data (e.g., Rittman, 1973, Branca et al., 2004) have allowed subdividing the almost continuous evolution of Etnean volcanism into four main phases lying from about 600 Ka to present day.
(1) The first phase, called pre-etnean (600-250 ka) consists mainly of sub-alkaline tholeiitic basalts (Condomines et al., 1995). (2) The Timpe phase, (250-100 ka) is related to a volcanism that crop out in the lower and intermediate portion of tectonic escarpments locally known as Timpe (Corsaro et al., 2002). In the volcanic succession formed during that period, the transition from sub-alkaline to alkaline lavas is recorded. (3) During the Valle del Bove phase (80- 40 ka), the products emitted are essentially lava flows. These rocks mostly outcrop in the walls of the Valle del Bove, forming stratigraphic sections (Gillot et al., 1994). Lavas compositions vary from hawaiitic to benmoreitic. (4) The stratovolcano phase, (40 ka to
present day), is related to an eruptive activity that was essentially fed by two central volcanic edifices: Ellitico and Mongibello, which lavas composition range from alkali-basalts to trachytes. If current Etna’s activity is at the present time considered to be the site of mild explosive eruptions, such as Strombolian activity, to effusive eruptions, note however that in the past 100 ka, several main periods of subplinian to plinian activity have been recorded (Coltelli et al., 2000, Del Carlo et al., 2004). After the end of Ellitico activity, Mongibello activity started filling the caldera with its products and built the volcano edifice from which the historical and present activity originates (Gillot et al., 1994; Condomines et al., 1995). Nowadays, the Mt. Etna activity is mainly located north-westward to the Valle del Bove, and centred on four summit craters: Northeast crater, Voragine, Bocca Nuova and Southeast Crater.
I.1.2. Eruptive dynamics at Etna
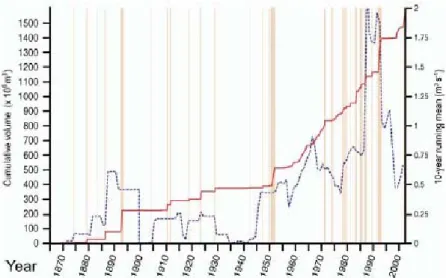
Mount Etna is among the few volcanoes on Earth that erupt nearly continuously, emitting large amount of gas even during quiescence periods (Allard et al., 1991). As a comparison, SO2 emissions of Mt. Etna volcano represent about 10% of the total amount produced by
volcanoes on earth. However, its activity undergoes significant fluctuations in time. The analysis of the eruptive dynamics at Etna (Allard et al., 2006) has revealed the existence of long-term eruptive cycles lasting several centuries, and assumed to reflect a general magma draining from the shallow plumbing system (FigureI.2). On the other hand, short-term eruptive cycles extending over several decades have been pointed out corresponding mostly to the refill of the plumbing system (Behncke and Neri, 2003a,b). Long-term cycles consist of three phases, beginning with low-level activity followed by nearly continuous summit activity and culminating with a series of flank eruptions, the last commonly being the most voluminous. In contrast, short-time eruptive cycles consist of three distinct phases, starting with a short period of quiescence following by increasing activity centred at the summit and ending with a series of flank eruptions (Behncke et al., 2004).
The feeding system at Mt. Etna is complex; nevertheless, many studies carried out in the last few decades, particularly from the tomography, geochemistry and gas analyses have permitted the understanding of the present plumbing system. It has become widely accepted that no major shallow magma reservoir currently exists beneath Etna, the magma thus rises rapidly from the mantle, about 18 – 20 km under the volcano, although shallow magma storage area are necessary to account for the magma differentiation (Corsaro and Pompilio, 2004a,b).
Indeed, geophysical studies (De Gori et al., 2005; Murru et al., 2005) suggest the presence of two main active magma ponding zones at depths of 10±2 km and 5±1 km below the sea level, included in a large plutonic complex 5 – 10 km wide emplaced in the sedimentary basement. Further results, based on the analysis of melt inclusions depth entrapment during flank eruptions of 2001 and 2002-2003, confirm the existence of such a shallow ponding area (Métrich et al., 2004; Spilliaert et al., 2006). Seismic and ground deformation data acquired since 1993, suggest that Etna’s magmas ascend across the plutonic body, generating internal overpressures, the shallower ponding zone acting as a temporary storage system that regulates the eruptive activity (Patanè et al., 2003a). Additional studies based on volcanic gas fluxes show that between 1975 – 1995, about 4 times more magma had degassed than extruded, implying that magma degassing is predominantly intrusive in the long term (Allard, 1997).
Figure I.2. Plot of cumulated erupted lava volume at Etna between 1865 and 2001 (plain line), and the
variation of effusion rate averaged on 10 years (dotted line), from Behncke and Neri (2003a)
I.1.3. The July-August 2001 eruption
The July-August 2001 eruption takes part in a new short-term cycle, initiated in 1993, after a major flank eruption that drained all magma from the shallow plumbing system (Rymer et al., 1995). From April 1993 until July 1995 the activity is characterized by a profound quiescence and only non-eruptive degassing from the summit craters. From late July 1995, the eruptive activity increased progressively, but still confined at the summit craters until the flank eruption of July 17, 2001. Indeed, over 6 years the summit activity had increased progressively starting with lava fountains at Northeast Crater (NEC), followed by explosive paroxysms sometimes reaching Sub-Plinian intensity (Crater Voragine, 1998). Finally, series
of about 100 lava fountains of high intensity arose at Southeast Crater (SEC) in 09/1998 – 02/1999; 01/2000 – 07/2000; and 05/2001 – 07/2001. The progressive increase of the summit activity stresses the refilling of the shallow plumbing system pressurizing until the surfacing of the flank eruption in July 17, 2001 (Figure I.3). Note that flank eruptions are not related to simple magma drainage of the central conduits but rather to the intrusion of distinct dykes propagating from depth.
(b)
(a)
Figure I.3. (a) Plot of SO2 flux at Mount Etna from January, 2001 to October, 2002 showing
particularly a progressive augmentation from May to early July, 2001 followed by a sudden dramatic increase of the SO2 flux during the flank eruption of July 17, 2001 (courtesy INGV). (b) Focus plot of
the maximum radial velocity and radar power evolution during the eruption of July 4, 2001 showing successive periods of quiescence and intense activity with a paroxysm phase between 2100:00 UT and 2200:00 UT as shown simultaneously by the tremor signal (Donnadieu et al., in prep).
In this general context, and after more than 8 months of minor activity (slow lava flows, degassing, light ash emission, and low-level Strombolian activity), a new episode of vigorous activity began at the Southeast Crater on 9 May 2001. From then until July 17, 2001, eruptions occurred at Etna SEC every 3-5 days, each lasting on average a few hours and involving multiple Strombolian explosions and lava fountaining. Doppler radar measurements used for this thesis were carried out over about 5 hours during the eruption of July 4, 2001. The activity began at about 18:00 UT and at first involved small explosions repeated every ~10 s in average. The intensity then increased progressively, culminating in very powerful Strombolian explosions every 2-3 s, with the bursting of very large bubbles sometimes rising above the crater rims, between 21:00 UT and 22:00 UT but without real lava fountains. The
eruption intensity then decreased rapidly from 22:00 UT and ended at 23:00 UT after about five hours of mainly Strombolian activity. This eruption with especially high eruptive intensity showed a typical Strombolian activity, and constitutes an ideal framework for the study of explosive dynamics by mean of remote sensing techniques. Radar measurements carried out in July 7, 13 at Etna SEC, showed an increase in eruptive intensity until the flank eruption. Additional radar measurements were realized by P. Allard in July 29-31 on laghetto (~2700 m a.s.l) newly formed cone.
I.2. Dynamics of explosive basaltic eruptions
I.2.1. Strombolian vs. Hawaiian activity
Strombolian activity takes its name from the frequent, small-scale, transient explosions exhibited by Stromboli, a volcano which forms one of the Aeolian Islands north of Sicily. The term ‘‘Strombolian’’ is most commonly used to denote the relatively mild explosions that occur from the accumulation of gas beneath the cooled upper surface of a magma column (e.g., Blackburn et al., 1976; Wilson, 1980). But in a more general way, the Strombolian and Hawaiian activities are the end members’ expression of explosive basaltic eruptions.
Strombolian activity is associated with discrete explosions at the surface of the magma column owing to the bursting of a large overpressurized bubble (Figure I.4). The overlying magmatic film thus breaks into fragmented lava clots ejected violently in the surrounding air by the gas release. Note that in Strombolian explosion, the gas amount can exceed the solid fraction (e.g., Chouet et al., 1974; Allard et al., 1994a,b), showing a possible gas separation at depth. Nevertheless some difficulties remain on understanding of shallow two-phase flow mechanisms.
Figure I.4. Photograph of typical Strombolian explosion by B. Chouet in December 1969, showing a
close view of Stromboli Volcano (Italy) erupting incandescent molten lava fragments.
Hawaiian activity, although less frequent at Etna, displays tremendous spectacle in form of fire fountains. They are almost continuous jets propelling fragmented magma rather vertically with a high gas fraction. (Figure I.5).
Figure I.5. Scene of a ~ 200-m-tall fountain of lava appeared at Etna (Sicily) on 24 July 2001. The
fountain emerged from a 150-m-wide crater formed along a fissure at ~ 2,500 m. Copyrighted photo provided by courtesy of Tom Pfeiffer.
Although these eruptions are generally much less violent than their more silicic counterparts they are, nonetheless, explosive and need to be considered as part of a continuum of explosive activity that embraces not only the familiar explosive basaltic eruption styles (Hawaiian and Strombolian) but includes sub-Plinian, Plinian, and ultra-Plinian (Figure I.6). Walker (1973) proposed a classification of explosive eruption styles based on the magma fragmentation degree and the dispersal of pyroclasts. At Etna, excluding some exceptional sub-plinian (July 22, 1998) or plinian (122 BC) eruptive phase (Coltelli et al., 2005), the very large majority of explosive episodes present a Strombolian activity associated with discrete explosions, and less frequently Hawaiian activity related to lava fountains.
Our understanding of the mechanisms of explosive basaltic eruptions has advanced considerably during the past ~30 years due to the collection and analysis of new field data (e.g., McGetchin et al., 1974; Self, 1976; Parfitt, 1998), volcano monitoring (e.g., Chouet et al., 1974; Blackburn et al., 1976; Vergniolle and Brandeis, 1994, 1996; Ripepe, 1996; Hort and Seyfried, 1998; Dubosclard et al., 2004; Allard et al., 2005), laboratory studies (e.g.,
Jaupart and Vergniolle, 1988; Seyfried and Freundt, 2000) and through mathematical modelling (Sparks, 1978; Wilson, 1980; Vergniolle and Jaupart, 1986; Jaupart and Vergniolle, 1988; Woods, 1993; Parfitt and Wilson, 1995, 1999).
Figure I.6. Diagram showing Walker’s (1973) classification scheme for explosive volcanic eruptions
which is based on the degree of fragmentation (F) of the magma and the dispersal area (D) of the tephra.
I.2.2. Deep origin of explosive basaltic eruptions
It is now widely accepted that Strombolian eruptions result from the formation and bursting of a gas pocket (slug) close to the surface (e.g., Blackburn et al., 1976; Wilson, 1980; Vergniolle and Brandeis, 1994, 1996), although some details of the mechanism are still disputed. Indeed, two contrasting models of the dynamics of explosive basaltic eruptions are in current usage: the rise speed dependent (RSD) model (Wilson, 1980; Head and Wilson, 1987; Fagents and Wilson, 1993; Parfitt and Wilson, 1994, 1999; Parfitt 2004) and the collapsing foam (CF) model (Vergniolle and Jaupart, 1986, 1990; Jaupart and Vergniolle, 1988, 1989; Vergniolle, 1996). Both models do not differ very much in their view of Strombolian activity. They both treat this explosive activity as occurring from gas accumulation forming large bubbles that cause a raising and up-doming of the surface of the magma column. Actually, the main difference between the models concerns where and how does gas accumulation occur within the magmatic system. More recent studies (Burton et al., 2007) demonstrate that gas slugs
may originate from as deep as the volcano-crust interface ( 3 km at Stromboli volcano),
where both structural discontinuities and differential bubble-rise speed can promote slug
explosion quakes may be a common feature of strombolian activity, determined by the
geometryof plumbing systems.
I.2.2.1. Collapsing foam (CF) model
In the CF model, magma is assumed to be stored within some sort of storage area (a shallow magma chamber or a dike system) at a depth at which gas can exsolve from the magma. The gas bubbles, once formed, rise and accumulate at the roof of the storage area and become close-packed into a foam layer. When the foam layer reaches a critical thickness, it becomes unstable and collapses, with bubbles coalescing to form a gas pocket. The slug then rises up an open vent system and is erupted. Strombolian eruptions, represent repeated partial foam collapse events, called “slug flow” (Figure I.7a) whereas fire fountains occur from complete and almost instantaneous foam collapse called “annular flow” (Figure I.7b). This model is based on separated two-phase flow regime, and implies a differential transfer of the gas phase.
(a)
Strombolian explosions
SLUG (b)
Fire fountains
ANNULAR
Figure I.7. Experiments of the alternating regimes of foam build up and collapse model (from Jaupart
and Vergniolle, 1989). After bubble accumulation at the roof of the tank, the foam collapses at a critical thickness (a) either partially into successive pulsed single gas pockets (slug flow) which start erupting as Strombolian explosions, (b) or completely and continuously (annular flow) with a central gas jet erupting as fire fountains (experiments from Vergniolle and Jaupart, 1990).
I.2.2.2. Rise speed dependent (RSD) model
The RSD model is based on the observation that larger bubbles rise faster than smaller ones and therefore have the opportunity to overtake and coalesce with smaller bubbles. However, coalescence is possible if bubbles have the opportunity to move upwards relative to the magma, i.e., as long as the magma rise speed is low (Figure I.8a). For low magma rise speed, bubbles can coalesce easily, leading in extreme case to the formation of a single large slug producing a Strombolian explosion at the surface. In contrast, if the magma rise speed is high, there is no bubble coalescence leading to the formation of fire fountains. At a given gas content, the eruptive style is therefore directly dependent on the magma rise speed (Figure I.8b). This model is based on homogeneous two-phase flow regime, and implies mainly syn-eruptive gas segregation.
(a) (b)
Figure I.8. (a) Plot showing the relationship between final bubble size and magma rise speed. (b) Plot
showing the controls of magma rise speed and gas content on basaltic eruption style as predicted by the RSD model (Parfitt and Wilson, 1995).
Both models show the importance of the gas phase in the dynamics of explosive basaltic eruption. However, they significantly depart on the origin of the gas phase which should betray different chemical signature. In situ measurements of the gas composition inside lava fountains have been carried out at Etna from Open-Path Fourier Transform Infrared (OP– FTIR) and revealed a separated two-phase flow mechanism (CF model) implying differential gas transfer primarily accumulated in a shallow ponding zone at about 1.5 – 2 km under the crater (Allard et al., 2005).
I.3. Introduction to remote sensing techniques
Remote sensing, in the simplest words, means obtaining information about an object without touching the object itself. Human eye is the best example of such a remote data acquisition technique using passively natural electromagnetic waves scattered by surrounding objects to build a coloured image of our environment. In situ measurements of volcanic eruptions are one of the major challenges left in geophysical Volcanology. Bearing in mind obvious difficulties to study hazardous explosive eruptions, remote sensing techniques turn out to be a very powerful tool for direct observations and quantitative measurements inside eruptive jets. The volcanological community has rapidly perceived the great ability of remote sensing systems to the monitoring and risk assessment of dangerous volcanoes.
I.3.1. Satellite-based methods
Satellite-based remote sensing systems have been used abundantly for volcanic applications. Large spatial coverage is one of the main important advantages of satellite-based methods, which can be advantageously used for tracking the long range evolution of large ash plumes.
Bearing in mind the profusion of these systems, we just aim at giving some key example of satellite-based studies. Particularly infrared systems such as MODIS (Moderate Resolution Imaging Spectroradiometer), have a low earth polar orbit satellite with a good spatial resolution up to 250 m (e.g., Gu et al., 2003; Watson et al., 2004), and a poor temporal resolution inherent to its orbit. MSG (Meteosat second generation), has a high earth geosynchronous orbit with a low spatial resolution (2.5 km) and very high temporal resolution (1 image per 15 min) related to its geosynchronous orbit (Prata et al., 2007). Such systems are complementary and permit both the detailed analysis and real-time monitoring of large ash plumes dispersal.
In contrast, Ultra-violet systems such as TOMS (Total Ozone Mapping Spectrometer; Krueger, 1983; Bluth et al., 1993) or more recently OMI (Ozone Monitoring Instrument; Krotkov et al., 2007; Carn et al., 2008) are both low earth polar orbit satellite and are rather devoted to volcanic SO2 retrieval.
However, these satellite-based methods operating at small wavelengths (ultra-violet to infrared) compared to radar techniques meet real difficulties for the quantitative assessment of ash and gas loading. Indeed, micrometric wavelengths are very sensitive to fine particles that constitute the earth’s atmosphere, and hence the contribution of water vapour reflectivity for instance remains problematic for the estimation of volcanic products dispersed into the atmosphere. In addition, satellite-based techniques often fail to probe early eruptive processes or even low intensity eruption because of either low temporal or spatial resolutions, and hence they cannot be used easily routinely for early warnings.
I.3.2. Ground-based methods
Simultaneously to the development of satellite-based systems, a wide range of ground-based remote sensing devices had emerged. First we present a group of tools devoted to the determination of volcanic gas release and composition, based on the spectroscopic techniques. Then we give some details on radar techniques used particularly for determination of volcanic clasts loading and velocity.
I.3.2.1. Spectroscopic remote sensing techniques
Most of the spectroscopic methods are geared toward quantifying the SO2 input into
atmosphere because SO2 is believed to be one of the most important volcanic gases and has a
strong short-term influence on the global climate. The application of spectroscopic remote sensing techniques turns out to be a key tool for the monitoring of hazardous volcanoes. In addition to real-time capabilities, these techniques permit the thorough study of various volcanic gas species inside the eruptive jet providing stringent constraints on the state of the plumbing system.
COSPEC
The Correlation Spectrometer (COSPEC) is the first and most common spectroscopic remote sensing technique employed at volcanoes. This UV sensitive opto-mechanical instrument is able to measure slant or vertical SO2 column, which is purely volcanic and NO2 purely
atmospheric. The retrieval of gas abundance is based on the comparison between blue-sky, calibration cell (without volcanic gas), and a volcanic plume scan. Gas flux can hence be
determined multiplying the integrated SO2 cross-section by estimated plume transport
velocity, derived from simultaneous measurements of wind speed and direction. However, the accuracy of gas velocity estimation is crucial for evaluating reliable volcanic gas fluxes. The uncertainty of the wind speed at high altitude contributes greatly to the error in the flux evaluation outlined by COSPEC users. The uncertainty (15–25% according to Caltabiano et al., 1994) does not invalidate remote COSPEC SO2 measurements as flux variations are
considered significant. For 30 years, the correlation spectrometer (COSPEC) has been the principal tool for remote monitoring of volcanic SO2 fluxes, particularly at Mt. Etna (e.g.,
Haulet et al., 1977; Bruno et al., 2001). During this time, the instrument has played a prominent role in volcanic hazard assessment. Though innovative for its time, COSPEC is now outdated in several respects.
DOAS
The Differential Optical Absorption Spectroscopy (DOAS) is a proven method for accurate spectral analysis that has been recently applied to volcanic gas monitoring (e.g., McGonigle et al., 2002), and turns out to be a serious alternative to COSPEC instruments. There are a number of advantages to such spectrometers including the collection of broadband ultraviolet spectra, which gives the potential to sense other atmospheric trace gases and to model the radiative transfer. Furthermore, ultra-compact and light-weight mini-DOAS systems recently developed offers the possibility to obtain plume SO2 measurements with the minimum of
logistical support. Note that in some cases radars such as VOLDORAD can be used to provide an accurate transport speed of ash cloud and hence be coupled advantageously with DOAS for estimating SO2 gas flux.
FTIR
The Fourier Transform Infrared (FTIR) spectroscopy is a technique that has first been widely used in laboratory analyses, and has provided excellent results in open path air for volcano monitoring (Francis et al., 1996). At Etna for instance, Allard et al. (2005) proved the emptying of a large gas bubble layer previously accumulated at about 1.5 km depth below the erupting crater. This technique represents an important step forward as it permits to obtain real-time measurements of absolute column abundances, and relative concentration ratio for different gas species. Indeed, OP-FTIR can determine the identity and molar path amount of a large range of gas species (H20, CO2, SO2, N2O, HCL, HF and CO) along the beam path
length from spectral absorption lines of the infrared radiation emitted by hot bodies (pyroclasts or lava flows), or simply from solar occultation.
Digital camera
Forward Looking Infrared Radiometer (FLIR) cameras offer a unique view of explosive volcanism by providing an image of calibrated temperatures. FLIR camera operates at typical temporal resolution up to 30 Hz. The FLIR is able to detect both ash plumes and coarse ballistic scoria, meet in various styles of eruptions (e.g., Patrick et al., 2007). In addition to temperature information, this technique also permits the estimation of particle and gas velocities.
More recently, a ultra-violet digital camera has been developed for imaging and quantification of volcanic plume SO2 (Bluth et al., 2007). This camera utilizes a bandpass filter to collect
photons in the ultra-violet (UV) region where SO2 selectively absorbs UV light. SO2 is
quantified by imaging calibration cells of known SO2 concentrations. Reliable images can be
acquired from distances ranging from 4 to 16 km away from the volcanic target, with a temporal resolution of up to 6 images per minute. In addition to a very short set-up time capabilities, the camera can observe variable in-plume concentrations, and accurate plume speeds (or rise rates) can readily be determined by tracing individual portions of the plume within sequential images.
I.3.2.2. Acoustic measurements
A different technique, also based on the Doppler shift during acoustic sounding (SODAR) was used by Weill et al. (1992) who carried out measurements of eruption velocities at Stromboli Volcano. They measured more than 100 explosions from which vertical velocities close to the vent ranging from 20 to 80 m/s were determined. This technique allows continuous monitoring of volcanic eruption, but the weight (~500 kg) and high energy consumption of the antenna do not make this instrument easy to operate in difficult areas. In addition, the speed of sound is a strong function of the temperature; therefore its accurate knowledge is necessary for calculating eruption velocities.
Radar (Radio detection and ranging) is an active remote sensing system for the detection and location of reflecting objects. By contrast to passive remote sensing systems, radars operate by radiating their own electromagnetic source into space with a wavelength (Figure I.9) typically ranging from 1–8 cm (apart for VOLDORAD) for volcanic applications (X, C, or S-band). The spectral region investigated by radar systems permit the detection of solid particles as fine as few millimetres up to several dozens of centimetres thus covering the particle size range of typical volcanic eruptions. Systems are typically amplitude modulated (AM), based on short pulses of very high power. In addition to their capability to detect the amount of particle inside distinct sampling volumes (the so-called range gates), most radar systems utilize Doppler shift-based techniques to measure the velocity of moving targets. Such radar systems have long been employed for meteorological purposes, and utilized opportunistically for volcanic applications.
Figure I.9. Electromagnetic spectrum showing spectral bands of most common radars. Weather
radars usually utilized for volcanic applications operate at wavelengths ranging typically from 1 – 8 cm (X, C, or S-band). We also focus on VOLDORAD system that operates at the singular wavelength of 23.5 cm (L-band), and specifically devoted to the sounding of explosive volcanic activity.
Weather radars
Since nearly three decades ground-based weather radars were used to track the long range evolution and some physical characteristics (ash plume velocity, ash concentration, geometrical extent of the volcanic plume) of large ash clouds derived from explosive eruptions of various volcanic targets, such as Mount St. Helens (e.g., Harris et al., 1981; Harris and Rose, 1983). But these radar systems are fixed and have to be used opportunistically in a maximum distance range of about 500 km to the target. At such a distance, the sampling volume resolution is low leading to some incapability to detect small
eruptive events and obtain accurate information on internal structure dynamics. Moreover, the earth curvature impedes weather radars to provide information on early ash plume component (Lacasse et al., 2004). Therefore, they just permit to probe the upper convective part of high eruption columns and provide information on fine ash only that ultimately constitute the distal volcanic products (Marzanno et al., 2006a,b). Most of all, considering their real-time capabilities, weather radar systems are devoted to the tracking of large ash clouds dispersal, valuable for the risk mitigation related to air transport for instance. In addition, some weather radars operate at small wavelength, lower than a centimetre (mm to X-band), and hence serious difficulties arise for the detection and quantification of ash particles loading under rainy conditions.
Volcanological Doppler radars
A major challenge is henceforth to measure physical parameters such as ash masses and velocities closer to the vent in order to retrieve directly the true source parameters that permit the understanding of the explosive dynamics.
In this aim, portable Doppler radar system has allowed a great step forward, providing velocities and mass estimates of pyroclasts right above the crater. Particularly, VERDEMOS (Hort and Seyfried, 1998; Seyfried and Hort, 1999) is a system constituted of a Doppler radar operating with a frequency-modulated continuous wave (FMCW) and working at 1.24 cm wavelength (Ku-band). Note that in this spectral region some difficulties related to the
detection of volcanic ash may arise under harsh rain condition. Such radar systems give a very high velocity resolution (~0.2 m/s) but the location of the target is rendered much more difficult. Hort et al. (2003) have provided at Stromboli from Doppler radar measurements average velocities of 19 and 8 m/s for ascending and descending particles respectively, with a maximum vertical velocity of 60–70 m/s. Under some assumptions based on the terminal settling velocities of particles they obtain a mean particle size of 3 mm at Stromboli. Three coupled FMCW radar were also used at Erebus volcano to determine the directivity of Strombolian explosions (Gerst et al., 2008). Finally, another version of FMCW radar operating at about 3 cm wavelength was used at Merapi volcano for active lava dome monitoring (Voge and Hort, 2009).
Besides, VOLDORAD is a Doppler radar exclusively devoted to the study of volcanic activity. It operates with a pulsed wave at a 23.5 cm wavelength (L-band) that permits the detection of fine ash under any weather conditions. The resolution (~0.9 m/s) and maximum range (>1000 m/s) velocity of VOLDORAD is suitable, as well as the temporal resolution (>10 Hz), for the detailed analysis of explosive activity. Dubosclard et al. (1999, 2004) have provided initial particle velocities of 80–90 m/s and maximum particle radial velocity inside the beam of about 60 m/s at Etna during the eruption of October, 1998. Donnadieu et al., (2003, 2005) obtained maximum radial particle velocities of 90 m/s and 110 m/s for the eruption of July 13, and July 29, 2001 respectively. Gouhier and Donnadieu (2008) give mean particle diameter ranging from 1.3 to 1.6 cm and ejecta mass estimate between 60–200 tons for a typical Strombolian explosion at Etna during the eruption of July 4, 2001.
Portable ground-based Doppler radar techniques allow direct kinetic and loading measurements on volcanic gas and/or particles immediately above the vent. Therefore, in addition to their significant monitoring potential and early warnings, these radar systems permit us to study, under any weather conditions, explosions of lesser intensity barely imaged by satellites or weather radars, so as to retrieve physical source parameters.
CHAPTER II
VOLDORAD (Volcano Doppler Radar): technical
II.1. Presentation of VOLDORAD
We wanted to provide a chapter exclusively devoted to the thorough description of VOLDORAD as it was extensively utilized for the study of this thesis. After a detailed presentation of VOLDORAD and its derived parameters, we give some theoretical elements related the Doppler radar method.
II.1.1. VOLDORAD technical characteristics
ANTENNA
RADAR
Figure II.1. Photograph of the sounding conditions during the radar acquisition campaign of July, 2001
at Mt. Etna SEC, and we provide close views of the 4-Yagi antenna array, and radar core.
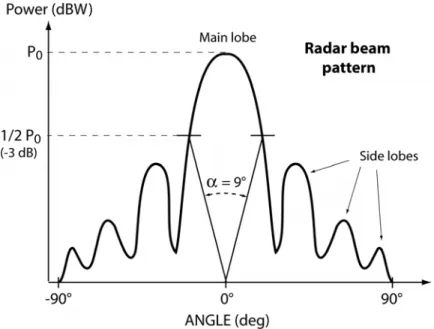
VOLDORAD literally VOLcano DOppler RADar, belongs to the family of pulsed ground-based Doppler radars, and was developed by the Observatoire de Physique du Globe de Clermont-Ferrand (France), specifically for the remote sensing of volcanic jets and plumes. A first prototype was successfully used at Etna during the eruption of October 1998 (Dubosclard et al., 1999, 2004), operating at 1238 MHz (equivalent wavelength of 24.2 cm) with a high-power transmitter up to 1 kW. The second version of VOLDORAD, more compact, was used at Etna during the eruption of the Southeast crater (SEC) on July 4, 7, and 13, 2001 and at the Laghetto cone on July 29 and 31, 2001 (Figure II.1). This version works with a low-power transmitter (60W), and an array of 4 Yagi antenna with a beamwidth α = 9° for a total weight of about 70 kg. These improvements permit the radar to be set up easily in the field with a four-wheel-drive and supplied by an electric generator. The VOLDORAD antenna radiation
pattern, like typical Doppler radar, is not focussed such as a laser, but comprises a main lobe surrounded by several side lobes. The aperture angle is defined at -3 dB beamwidth of the main lobe (Figure II.2). However, side lobes may reach the slopes of the crater and hence be responsible for ground clutter echoes, readily eliminated with basic treatments.
Figure II.2. Sketch of a typical radar beam pattern showing the multiple lobes, and the beam aperture
angle (α=9°) as calculated from the beamwidth of the main lobe at -3dB of P0.
VOLDORAD is designed to monitor all types of explosive volcanic activity of variable magnitude. It operates at a medium distance range (0.2 – 12 km), at a wavelength (λ) of 23.5 cm (equivalent frequency of 1274 MHz), and with a high sampling rate ≥10 Hz, which permit the sounding under any weather conditions and the detailed analysis of early eruptive processes. Note that the intensity of the scattered signal is a strong function of the particle size and can be separated into three regions of strictly different behaviour, depending on the relation of particle diameter (D) and the wavelength (λ) of the transmitted wave. In many cases the power of the scattered signal (P) is proportional to the number of particles in the volume, where scattering takes place. For D>>λ, the theory of geometrical optics is applicable, and the scattered power P is proportional to the square of the particle diameter (P
∝ D2). The range D ≈ λ is called the Mie region after the first theoretical approach to the complete scattering theory by Mie (1908). Here the scattered power P becomes a function of the transmitted frequency and the location around the particle (see Appendix B for more details). Rayleigh scattering takes place for D<<λ with the scattered power being proportional
to the sixth power of the particle diameter (P ∝ D6). Bearing in mind the large wavelength used by VOLDORAD (23.5 cm), we show that for volcanic ejecta size in the millimetre range, mostly Rayleigh scattering occurs, and beyond a particle diameter threshold found to be around 6 cm, Mie scattering starts to become dominant (Gouhier and Donnadieu, 2006). Considering the wide range of particle sizes for Strombolian explosions exceeding the diameter threshold by far, the Mie scattering formulation is required for any modelling of the scattering field. Note that for smaller wavelengths, as it is the case for most of Doppler radars used for volcanological applications, the Rayleigh approximation validity limit arises at even lower diameter threshold.
Figure II.3. Sketch showing the principle of emission/reception of an electromagnetic (EM) signal by a
Doppler radar, and used for the characterization of the range resolution of the sampling volumes (range gates). The range resolution is directly defined by the pulse duration (PD) taken as τ = 0.8 µs at Etna, and corresponds to half the travel distance of the transmitted wave through the pulse duration cτ/2 = 120 m. Actually the radar is able to record the backscattered signal only during the receive time interval PRI-PD, thus characterizing the minimum and maximum unambiguous distance range.
Pulsed Doppler radars also permit to define easily distinct sampling volumes (the so-called range gates), which make possible the localization of the plume inside the beam. The range resolution of successive sampling volumes can be determined directly from the pulse duration (τ). At Etna, the pulse duration was taken as 0.8 µs, which corresponds to a radial range resolution of 120 m, i.e., half of the travel distance of the transmitted wave through the pulse duration (cτ/2), c being the celerity of light. The azimuthal and elevation range resolution depends on the aperture of the antenna beam (α) and hence varies with the distance
between the considered range gate and the antenna. At Etna, we defined a mean azimuthal range resolution of about 165 m at 1 km. Likewise, we characterize a minimum and maximum unambiguous range from the pulse duration (τ) and the pulse repetition interval (tr) taken as
100 µs at Etna of 120 m and 15 km respectively (Figure II.3).
The pulsed repetition interval (tr) and the number of coherent integrations (6 – 10) of radar
pulses in the time domain selected at Etna permit to define a maximum radial velocity range of about 59 and 98 m/s from Vrad = λ/(4Nctr), with a radial velocity resolution of 1.8 m/s and
3 m/s respectively. The principal technical characteristics of VOLDORAD are summarized in Table II.1.
Table. II.1. Technical characteristics of VOLDORAD version 2.
* Parameters set for the sounding at Etna SE crater on 4 July 2001.
Technical characteristics of VOLDORAD 2 Symbols Values
Transmitted frequency (MHz) ft 1274
Wavelength (cm) λ 23.5
Peak power (W) Pt 60
Pulse repetition interval (µs) * tr 100
Pulse duration (µs) * τ 0.8
Radial range resolution (m) * L 120
Mean azimuthal/elevation range resolution (m) * H 165
Antenna beamwidth (°) α 9
II.1.2. VOLDORAD setting at Etna on July 4, 2001
VOLDORAD was set up at an altitude of about 3000 m, at a horizontal distance of 930 m to the centre of the crater, 280 m below the summit of the SEC, and with an antenna elevation angle θ = 23°. Moving particles were detected in successive range gates (G1 to G4)
corresponding to a slant distance of 807-1167 m to the radar antenna with a mean gate width of 120 m and a gate height ranging from 127-184 m (Figure II.4). The centre of range gates G1 and G2 are located at 78° and 34° respectively to the south of the vertical axis, whereas
range gate G3 and G4 are oriented at 23° and 43° respectively to the north of the vertical axis.
The centre of the range gate G3 is located at a horizontal distance of 54 m and an elevation of
127 m to the center of the crater. Note however that echo-power can be recorded as soon as particles enter the range gate G3, i.e., about 40 m above the crater rims. In this configuration,