HAL Id: insu-01897911
https://hal-insu.archives-ouvertes.fr/insu-01897911
Submitted on 24 Oct 2018
HAL is a multi-disciplinary open access
archive for the deposit and dissemination of
sci-entific research documents, whether they are
pub-lished or not. The documents may come from
teaching and research institutions in France or
abroad, or from public or private research centers.
L’archive ouverte pluridisciplinaire HAL, est
destinée au dépôt et à la diffusion de documents
scientifiques de niveau recherche, publiés ou non,
émanant des établissements d’enseignement et de
recherche français ou étrangers, des laboratoires
publics ou privés.
Comment on “Modeling Extreme “Carrington-Type”
Space Weather Events Using Three-Dimensional Global
MHD Simulations” by C. M. Ngwira, A. Pulkkinen, M.
M. Kuznetsova, and A. Glocer”
Bruce Tsurutani, Gurbax Lakhina, Ezequiel Echer, Rajkumar Hajra,
Chinmaya Nayak, Anthony Mannucci, Xing Meng
To cite this version:
Bruce Tsurutani, Gurbax Lakhina, Ezequiel Echer, Rajkumar Hajra, Chinmaya Nayak, et al..
Com-ment on “Modeling Extreme “Carrington-Type” Space Weather Events Using Three-Dimensional
Global MHD Simulations” by C. M. Ngwira, A. Pulkkinen, M. M. Kuznetsova, and A. Glocer”.
Journal of Geophysical Research Space Physics, American Geophysical Union/Wiley, 2018, 123 (2),
pp.1388 - 1392. �10.1002/2017JA024779�. �insu-01897911�
Comment on
“Modeling Extreme “Carrington-Type” Space
Weather Events Using Three-Dimensional Global MHD
Simulations
” by C. M. Ngwira, A. Pulkkinen,
M. M. Kuznetsova, and A. Glocer
”
Bruce T. Tsurutani1 , Gurbax S. Lakhina2 , Ezequiel Echer3 , Rajkumar Hajra4 , Chinmaya Nayak5 , Anthony J. Mannucci1 , and Xing Meng1
1
Jet Propulsion Laboratory, California Institute of Technology, Pasadena, CA, USA,2Indian Institute of Geomagnetism, Navi Mumbai, India,3INPE, São José dos Campos, Brazil,4LPC2E, CNRS, Orléans, France,5Department of Physics and Astronomy,
George Mason University, Fairfax, VA, USA
Abstract
An alternative scenario to the Ngwira et al. (2014, https://doi.org/10.1002/2013JA019661) high sheath densities is proposed for modeling the Carrington magnetic storm. Typical slow solar winddensities (~5 cm 3) and lower interplanetary magnetic cloud magneticfield intensities (~90 nT) can be used to explain the observed initial and main phase storm features. A second point is that the fast storm recovery may be explained by ring current losses due to electromagnetic ion cyclotron wave scattering.
Plain Language Summary
The 1859 Carrington magnetic storm is the largest storm in recorded history. It is used as a model of an "extreme storm" by the U.S. Homeland Security for effects of such an event on the U.S. population. Computer modelers have tried to duplicate the magnetic ground signatures of the storm that were published in Tsurutani et al. (2003, https://doi.org/10.1029/2002JA009504). Some have used extremely high solar wind densities, values which have never been detected in the space age. Here we explain why assumptions of such high densities are unnecessary.1. Results
We commend Ngwira and coauthors for their scholarly and excellent effort on modeling the Carrington 1859 magnetic storm. We have several comments, which, if adopted, may help improve modeling results. We hope that the authors will accept our comments in a positive light and redo their modeling in the near future.
2. Plasma Densities
High sheath solar wind densities of ~400 cm 3have been assumed by Ngwira et al. (2014). Other researchers have assumed quite different values for the solar wind densities. The steady state solution of Manchester et al. (2006) predicts an unusually high slow solar wind density of 38 cm 3at 1 AU. With a shock compression factor of about 4 times, their model produces a downstream sheath density of 146 cm 3.
We believe that there is already evidence that plasma densities in the sheath sunward of (behind) the fast forward interplanetary shock were not particularly high, but lower than the above two assumed values. If we take an average solar wind density of ~5 cm 3and a maximum compression ratio of ~4 as experimentally (Kennel, Edmiston, et al., 1984; Kennel, Scarf, et al., 1984; Tsurutani et al., 2008) and theoretically (Kennel, Edmiston, & Hada, 1985) shown for interplanetary space, we get a downstream sheath density of ~20 cm 3. That taken with the Tsurutani et al. (2003) and Lakhina et al. (2012) derived solar wind speed of ~1,850 km s 1at 1 AU gives a ram pressure of 114 nPa. This ram pressure can produce a Sudden Impulse (SI+) of ~160 nT less ground induction effects (Araki et al., 1993; Siscoe et al., 1968; Tsurutani & Lakhina, 2014). Thus, the 120 nT SI+observed at the Colaba Observatory in 1859 extreme magnetic storm event (Tsurutani et al., 2003) is easily explained by more-or-less ordinary solar wind density values. It should be noted that a SI+value of 120 nT is high, but nowhere near the record value of ~202 nT for the 24 March 1991 shock event measured at Kakioka, Japan (Araki et al., 1997).
We note that the shock and sheath are not part of the interplanetary coronal mass ejection (ICME) (see Tsurutani et al., 2011), as some people have mistakenly stated in the literature. Although they are
Journal of Geophysical Research: Space Physics
COMMENT
10.1002/2017JA024779This article is a comment on Ngwira et al. (2014) http://doi.org/10.1002/ 2013JA019661.
Key Points:
• The densities used in Ngwira et al. (2014) are unnecessarily too high. Such densities are not needed • It is shown that typical solar wind
densities can be used to explain the Carrington storm features • High solar wind densities are not
needed to explain the Carrington storm short recovery phase. An alternate mechanism is given
Correspondence to:
B. T. Tsurutani,
bruce.t.tsurutani@jpl.nasa.gov
Citation:
Tsurutani, B. T., Lakhina, G. S., Echer, E., Hajra, R., Nayak, C., Mannucci, A. J., & Meng, X. (2018). Comment on “Modeling extreme “Carrington-type” space weather events using three-dimensional global MHD simulations” by C. M. Ngwira, A. Pulkkinen, M. M. Kuznetsova, and A. Glocer”. Journal of Geophysical Research: Space Physics, 123, 1388–1392. https://doi.org/10.1002/ 2017JA024779
Received 13 SEP 2017 Accepted 26 DEC 2017
Accepted article online 18 JAN 2018 Published online 26 FEB 2018
©2018. American Geophysical Union. All Rights Reserved.
physically located adjacent to the ICME proper, the plasma does not come from the same location of the Sun. The sheath is swept up and shocked (heated and compressed) slow solar wind plasma and magnetic fields. The solar and solar wind origins of the sheath plasma and magneticfields are different from those of the ICME.
One part of the ICME, the magnetic cloud (Burlaga et al., 1981; Echer et al., 2008; Tsurutani et al., 1988), is characterized by low plasma beta (β = 8π NkT/B2) values, where k is the Boltzmann constant, T is the plasma temperature, and B is the magnetic field magnitude. Thus, this region should not be a high plasma density region either.
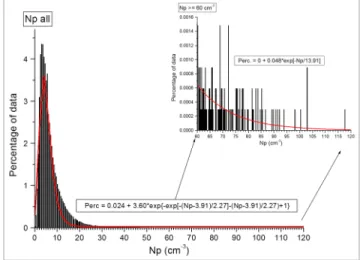
If there are very high plasma densities, where would they be located? There is one part of an ICME, which is known to have very high plasma densities. This is the most sunward part, called the“filament” (see Illing & Hundhausen, 1986). In almost all cases, this part of the CME does not reach 1 AU (this is one reason why we use a different name for ejecta that reach 1 AU:“interplanetary CMEs” or ICMEs). Very few (~4%) filaments have been detected at Earth distances (Lepri & Zurbuchen, 2010). Thefirst case of a filament was observed by the Wind spacecraft in the 10–11 January 1997 ICME event and reported by Burlaga et al. (1998). Thefilament had a peak density of ~164 cm 3(several 5 min average values) and was located sunward of the magnetic cloud. This location is the standard position within a CME at the Sun, as indicated by Illing and Hundhausen (1986). Li et al. (2006) had placed a high-density ~1,800 cm 3plasma plug in the region sunward of the magnetic cloud to model a Dst ~1,600 nT Carrington magnetic storm. The authors placed such high densities behind the magnetic cloud to attempt to explain the short duration of the magnetic storm recovery phase. The high solar wind density produced consistency between an empirical model of Dst (Temerin & Li, 2002) and solar wind parameters. This location would imply that such a high-density plasma plug might be an ICMEfilament. In order to address the question of how high solar wind densities can become, we have examined all avail-able 1 h averages at 1 AU from 1964 to 2017, ~54 years. Figure 1 shows the distribution of these hourly aver-age densities taken from the OMNI data site. In the right-hand side of thefigure is an enlargement of the density events with values between 60 and 120 cm 3. The peak density occurred on day 210, 1977 and was 118 cm 3. This appears to be a sheath event.
The average density for the ~54 years was 6.8 cm 3, a median of 5.2 cm 3, and a standard deviation of 5.5 cm 3. The peak in the histogram is at ~3.0 cm 3. In our previous calculation, we used the median value. The reader should note that different solar wind features are known to have different densities. Thisfigure includes high-speed streams, slow-speed streams, ICMEs, corotating interaction regions (CIRs), and the helio-spheric current sheet.
The density main distribution has beenfitted with a skewed Gaussian function. This was done because the value starts at zero and shows a tail distribution due to extreme values associated with ICMEs, sheaths, CIRs, and HPS. The central position of thisfitted function is 3.9 cm 3, which is closer to the med-ian value rather than to the average value. The spread of thisfitted function is 2.3 cm 3, which is ~1/2 of the standard deviation of a normal Gaussian function. Note that the density functional curvefits well only around the peak, underestimating values between ~10 and 30 cm 3, but overestimating the extreme tail for densities above 60 cm 3.
For the extreme values, here taken as Np> 60 cm 3, another exponential decay function has beenfitted, with an exponential of e (n/13.9 cm 3), This extreme tail function could be used by modelers to identify the probability of the occurrence of extreme densities.
3. Magnetic Field Intensities
Figure 2 shows the OMNI 1 h average interplanetary magneticfield magnitude over the same time inter-val as in Figure 1, from 1964 to 2017. The average magnetic field magnitude is 6.3 nT, the median is
Figure 1. One-hour average solar wind densities from 1964 to 2017. The main part of the distribution isfitted with a skewed Gaussian function. The extreme values (>60 cm 3) are blown up on the right-hand side. The latter is fitted with an exponential function.
5.6 nT, and the standard deviation is 3.2 nT. The maximum magnetic field was 62 nT and the minimum was 0.4 nT. The peak in the histogram is at 5.0 nT. We make the same caveats as for the plasma densities: the composition of these magneticfield values is a mixture of many differ-ent types of solar wind phenomena.
The entire magneticfield magnitude distribution has also been fitted with a skewed Gaussian function. The central position of thisfitted function is 4.9 nT, which is closer to the median than to the average. The spread of this fitted function is 1.9 nT. The function fits the bulk of the distribution well, but underestimates the region between ~13 and 20 nT and overestimates the distribution for values>30 nT.
For magneticfield magnitude values >30 nT, an exponential decay fit has been made (e (B/ 4.7 nT)). This exponential decay can be used to calculate the probability of extreme magneticfield magnitude events.
We believe that the value of interplanetary magneticfield Bz= 210 nT
considered by Ngwira et al. (2014) is too large and a bit unrealistic for the 1859 Carrington magnetic storm. Tsurutani et al. (2003) and Lakhina and Tsurutani (2017) have used the empirical relationship between the solar wind speed and the magneticfield intensity of the magnetic cloud at 1 AU (Gonzalez et al., 1998) to obtain the magnetic cloud magneticfield of ~90 nT for the Carrington storm. This leads to a maximum interplanetary electricfield of ~160 mV m 1. During the Carrington magnetic storm, the lowest latitude auroras were seen at 23° (Kimball, 1960). Using this latter information, the plasmapause location was determined to be at L = 1.3. This in turn was used to derive the magnetospheric convection elec-tricfield of ~20 mVm 1(Tsurutani et al., 2003). Assuming a magneticfield reconnection efficiency of ~10%, this convection electricfield corresponds to an interplanetary electric field of ~200 mVm 1. Thus, these two estimates of the interplanetary electricfield are in good agreement with each other. The resultant calculated magnetic storm intensity was Dst = 1,760 nT.
4. High Plasma Densities and Fast Storm Recovery Phases
It was noted by Li et al. (2006) that the Carrington magnetic storm recovery phase was quite rapid, thus the inclusion of a high-density plasma plug sunward of the magnetic cloud in their model. Here we postulate a new idea for rapid storm recovery phases during extremely intense magnetic storms.
The magnetic storm intensity is related to the magnetospheric convection electricfields (Gonzalez et al., 1989). The larger the convection electricfield, the deeper the midnight sector penetration of the plasmasheet ions and electrons toward the Earth. Assuming conservation of the particle adiabatic invariants, the ring cur-rent particles gain more kinetic energy, leading to the observed larger negative Dst values (large storm intensities).
Besides the higher ring current particle energies, there are several other important aspects of the convection of energetic plasma to low L regions of the magnetosphere that are typically not considered. First, the extreme compression of the particles in perpendicular temperature (conservation of thefirst adiabatic invar-iant) will lead to greater free energy for the loss cone instability (Kennel & Petschek, 1966; Tsurutani & Lakhina, 1997). Additionally at lower L the loss cone size is substantially larger. Thus, for both of these reasons, we suspect that the wave intensities (both proton electromagnetic ion cyclotron waves and electron electro-magnetic (chorus) waves) will be substantially greater for extreme electro-magnetic storms. This can be tested by wave measurements during magnetic storms of lesser intensities and theoretical modeling. Second, because of the greater loss cone size and the greater wave intensities, rapid ring current losses can be expected. The more intense the storm, the faster the ring current loss rate. Wave coherency (Tsurutani et al., 2009, 2013; Lakhina et al., 2010; Bellan, 2013; Remya et al., 2015) in wave-particle cyclotron resonant interactions should be considered in any updated model.
In the above, we have focused on wave-particle interactions for the loss of extreme storm ring current parti-cles. However, it is noted that other (standard) loss processes (Jordanova et al., 1998; Kozyra et al., 2006) will
Figure 2. Same format as in Figure 1 but for the interplanetary magnetic field magnitude B0. A blowup of the magneticfield between 30 nT and
also be in effect for extreme magnetic storm cases. Coulomb collisions and charge exchange processes may be substantially higher for low L-shell ring currents. Theoretical comparisons should be made to determine the relative losses associated with the different mechanisms.
5. Final Comments
Our hope is that Ngwira et al. and other magnetic storm modelers will try to include some of these para-meters to model the Carrington magnetic storm. So far, a variety of parapara-meters have been assumed and used, with only mixed results so far. We have made arguments why high plasma densities either in the sheath, the ICME magnetic cloud, or trailing ICMEfilament are not needed to explain the Carrington event features. However, it should be recognized that ring current particle losses are nonlinear (increasing rate of loss with increasing storm intensity), and not just a constant factor. We hope modeling with the numbers given in this comment will allow a better match between models and observations.
References
Araki, T., Fujitani, S., Emoto, M., Yumoto, K., Shiokawa, K., Ichionose, T.,… Liu, C. F. (1997). Anomalous sudden commencement on March 24, 1991. Journal of Geophysical Research, 102, 14,075–14,086.
Araki, T., Funato, K., Iguchi, T., & Kamei, T. (1993). Direct detection of solar wind dynamic pressure effect on ground geomagneticfield. Geophysical Research Letters, 20, 775–778. https://doi.org/10.1029/93GL00852
Bellan, P. M. (2013). Pitch angle scattering of an energetic magnetized particle by a circularly polarizec electromagnetic wave. Physics of Plasmas, 20(4), 042117. https://doi.org/10.1063/1.4801055
Burlaga, L., Fitzenreiter, R., Lepping, R., Olgilvie, K., Szabo, A., Lazarus, A.,… Larson, D. E. (1998). A magnetic cloud containing prominence material: January 1997. Journal of Geophysical Research, 103, 277–285. https://doi.org/10.1029/97JA02768
Burlaga, L., Sittler, E., Mariani, F., & Schwenn, R. (1981). Magnetic loop behind an interplanetary shock: Voyager, Helios, and IMP 8 observa-tions. Journal of Geophysical Research, 86, 6673–6684. https://doi.org/10.1029/JA086iA08p06673
Echer, E., Gonzalez, W. D., Tsurutani, B. T., & Gonzalez, A. L. C. (2008). Interplanetary conditions causing intense geomagnetic storms (Dst≤ 100 nT) during solar cycle 23 (1996-2006). Journal of Geophysical Research, 113, A05221. https://doi.org/10.1029/2007JA012744 Gonzalez, W. D., Clua de Gonzalez, A. L., Dal Lago, A., Tsurutani, B. T., Arballo, J. K., Lakhina, G. S.,… Ho, C. M. (1998). Magnetic cloud field
intensities and solar wind velocities. Geophysical Research Letters, 25, 963–966. https://doi.org/10.1029/98GL00703
Gonzalez, W. D., Tsurutani, B. T., Gonzalez, A. L. C., Smith, E. J., Tang, F., & Akasofu, S.-I. (1989). Solar wind-magnetosphere coupling during intense magnetic storms. Journal of Geophysical Research, 94, 8835–8851. https://doi.org/10.1029/JA094iA07p08835
Illing, R. M. E., & Hundhausen, A. J. (1986). Disruption of a coronal streamer by an eruptive prominence and coronal mass ejection. Journal of Geophysical Research, 91, 10,951–10,960. https://doi.org/10.1029/JA091iA10p10951
Jordanova, V. K., Farrugia, C. J., Janoo, L., Quinn, J. M., Torbert, R. B., Ogilvie, K. W.,… Belian, R. D. (1998). October 1995 magnetic cloud and accompanying storm activity: Ring current evolution. Journal of Geophysical Research, 103, 79–92. https://doi.org/10.1029/97JA02367 Kennel, C. F., Edmiston, J. P., & Hada, T. (1985). A quarter century of collisionless shock research. In Collisionless shocks in the heliosphere: A
tutorial review, Geophysical Monograph Series (Vol. 34, p. 1). Washington DC: American Geophysical Union.
Kennel, C. F., Edmiston, J. P., Scarf, F. L., Coroniti, F. V., Russell, C. T., Smith, E. J.,… Temerin, M. (1984). Structure of the November 12, 1978, quasi-parallel interplanetary shock. Journal of Geophysical Research, 89, 5436–5452. https://doi.org/10.1029/JA089iA07p05436 Kennel, C. F., & Petschek, H. E. (1966). Limits on stably trapped particlefluxes. Journal of Geophysical Research, 71, 1–28. https://doi.org/
10.1029/JZ071i001p00001
Kennel, C. F., Scarf, F. L., Coroniti, F. V., Russell, C. T., Wenzel, K.-P., Sanderson, T. R.,… Scholer, M. (1984). Plasma and energetic particle structure upstream of a quasi-parallel interplanetary shock. Journal of Geophysical Research, 89, 5419–5435. https://doi.org/10.1029/ JA089iA07p05419
Kimball, D. S. (1960). A study of the aurora of 1859, Sci. Rpt. 6, UAG-R109, University of Alaska, Fairbanks AK.
Kozyra, J. U., Nagy, A. F., & Slater, D. W. (2006). High-altitude energy source(s) for stable auroral red arcs. Reviews of Geophysics, 35, 155–190. Lakhina, G. S., Alex, S., Tsurutani, B. T., & Gonzalez, W. D. (2012). Supermagnetic storms: Hazard to society. In A. S. Sharma, et al. (Eds.), Extreme
events and natural hazards: The complexity perspective, Geophysical Monograph Series (Vol. 196, p. 267). Washington D.C: American Geophysical Union. https://doi.org/10.1029/2011GM001073
Lakhina, G. S., & Tsurutani, B. T. (2017). Super geomagnetic storms: Past, present and future, to appear. In N. Buzulukova (Ed.), Extreme geospace (Chap. 7, p. 157.). Cambridge: Cambridge University Press.
Lakhina, G. S., Tsurutani, B. T., Verkhoglyadova, O. P., & Pickett, J. S. (2010). Pitch angle transport of electrons due to cyclotron interactions with the coherent chorus subelements. Journal of Geophysical Research, 115, A00F15. https://doi.org/10.1029/2009JA014885 Lepri, S. T., & Zurbuchen, T. H. (2010). Direct observational evidence offilament material within interplanetary coronal mass ejections.
Astrophysical Journal Letters, 723(1), L22–L27. https://doi.org/10.1088/2041-8205/723/1/L22
Li, X., Temerin, M., Tsurutani, B. T., & Alex, S. (2006). Modeling of 1–2 September 1859 super magnetic storm. Advances in Space Research, 38(2), 273–279. https://doi.org/10.1016/jasr.2005.06.070
Manchester, W. B. IV, Ridley, A. J., Gombosi, T. I., & DeZeeuw, D. L. (2006). Modeling the Sun-to-Earth propagation of a very fast CME. Advances in Space Research, 38(2), 253–262. https://doi.org/10.1016/j.asr.2005.09.044
Ngwira, C. M., Pulkkinen, A., Kuznetsova, M. M., & Glocer, A. (2014). Modeling extreme“Carrington-type” space weather events using three-dimensional global MHD simulations. Journal of Geophysical Research: Space Physics, 119, 4456–4474. https://doi.org/10.1002/ 2013JA019661
Remya, B., Tsurutani, B. T., Reddy, R. V., Lakhina, G. S., & Hajra, R. (2015). Electromagnetic cyclotron waves in the dayside subsolar outer magnetosphere generated by enhanced solar wind pressure: EMIC wave coherency. Journal of Geophysical Research: Space Physics, 120, 7536–7551. https://doi.org/10.1002/2015JA021327
Siscoe, G. L., Formisano, V., & Lazarus, A. J. (1968). Relation between geomagnetic sudden impulses and solar wind pressure changes-an experimental investigation. Journal of Geophysical Research, 73, 4869–4874. https://doi.org/10.1029/JA073i015p04869
Journal of Geophysical Research: Space Physics
10.1002/2017JA024779
Acknowledgments
Portions of this research were done at the Jet Propulsion Laboratory, California Institute of Technology, under contract with NASA. R.H. would like to thank ANR forfinancial support through the finan-cial agreement ANR-15-CE31-0009-01 at LPC2E/CNRS and CNES for postdoctoral fellowship support at LPC2E/CNRS. G.S. L. thanks the National Academy of Sciences, India, for support under the NASI-Senior Scientist Platinum Jubilee Fellowship Scheme. E. E. wishes to acknowledge Brazilian agency CNPq/ PQ302583/2015-7 forfinancial support for this work.
Temerin, M., & Li, X. (2002). A new model for the prediction of Dst on the basis of the solar wind. Journal of Geophysical Research, 107(A12), 1472. https://doi.org/10.1029/2001JA007532
Tsurutani, B. T., Echer, E., Guarnieri, F. L., & Kozyra, J. U. (2008). CAWSES November 7–8 2004, superstorm: Complex solar and interplanetary features in the post-solar maximum phase. Geophysical Research Letters, 35, L06S05. https://doi.org/10.1029/2007GL031473
Tsurutani, B. T., Gonzalez, W. D., Lakhina, G. S., & Alex, S. (2003). The extreme magnetic storm of 1–2 September 1859. Journal of Geophysical Research, 108(A7), 1268. https://doi.org/10.1029/2002JA009504
Tsurutani, B. T., Gonzalez, W. D., Tang, F., Akasofu, S.-I., & Smith, E. J. (1988). Origin of interplanetary southward magneticfields responsible for major magnetic storms near solar maximum (1978-1979). Journal of Geophysical Research, 93, 8519–8531. https://doi.org/10.1029/ JA093iA08p08519
Tsurutani, B. T., & Lakhina, G. S. (1997). Some basic concepts of wave-particle interactions in collisionless plasmas. Reviews of Geophysics, 35, 491–501. https://doi.org/10.1029/97RG02200
Tsurutani, B. T., & Lakhina, G. S. (2014). An extreme coronal mass ejection and consequences for the magnetosphere and Earth. Geophysical Research Letters, 41, 287–292. https://doi.org/10.1002/2013GL058825
Tsurutani, B. T., Lakhina, G. S., & Verkhoglyadova, O. P. (2013). Energetic electron (>10 keV) microburst precipitation, ~5–15s X-ray pulsations, chorus, and wave-particle interactions: A review. Journal of Geophysical Research: Space Physics, 118, 2296–2312. https://doi.org/10.1002/ jgra.50264
Tsurutani, B. T., Lakhina, G. S., Verkhoglyadova, O. P., Gonzalez, W. D., Echer, E., & Guarnieri, F. L. (2011). A review of interplanetary disconti-nuities and their geomagnetic effects. Journal of Atmospheric and Solar - Terrestrial Physics, 73(1), 5–19. https://doi.org/10.1016/j.jastp. 2010.04.001
Tsurutani, B. T., Verkhoglyadova, O. P., Lakhina, G. S., & Yagitani, S. (2009). Properties of dayside outer zone chorus during HILDCAA events: Loss of energetic electrons. Journal of Geophysical Research, 114, A03207. https://doi.org/10.1029/2008JA013353