HAL Id: hal-03182526
https://hal.u-pec.fr//hal-03182526
Submitted on 26 Mar 2021
HAL is a multi-disciplinary open access
archive for the deposit and dissemination of sci-entific research documents, whether they are pub-lished or not. The documents may come from teaching and research institutions in France or abroad, or from public or private research centers.
L’archive ouverte pluridisciplinaire HAL, est destinée au dépôt et à la diffusion de documents scientifiques de niveau recherche, publiés ou non, émanant des établissements d’enseignement et de recherche français ou étrangers, des laboratoires publics ou privés.
The structure and low-barrier methyl torsion of
3-fluorotoluene
K.P. Rajappan Nair, Sven Herbers, Ha Vinh Lam Nguyen, Jens-Uwe Grabow
To cite this version:
K.P. Rajappan Nair, Sven Herbers, Ha Vinh Lam Nguyen, Jens-Uwe Grabow. The structure and low-barrier methyl torsion of 3-fluorotoluene. Spectrochimica Acta Part A: Molecular and Biomolecular Spectroscopy, Elsevier, In press, 242, pp.118709. �10.1016/j.saa.2020.118709�. �hal-03182526�
1
The structure and low-barrier methyl torsion of
3-fluorotoluene
K. P. Rajappan Nair,a,b* Sven Herbers,a Ha Vinh Lam Nguyen,c* and Jens-Uwe Grabowa
a Institut für Physikalische Chemie und Elektrochemie, Gottfried-Wilhelm-Leibniz-Universität Hannover, Callinstraße 3A, 30167 Hannover (Germany).
b Department of Atomic and Molecular Physics, Manipal Academy of Higher Education, Manipal, 576104, India.
c Laboratoire Interuniversitaire des Systèmes Atmosphériques (LISA), CNRS UMR 7583, Université Paris-Est Créteil, Université de Paris, Institut Pierre Simon Laplace, 61 avenue du Général de Gaulle, 94010 Créteil, France.
Abstract
The microwave rotational spectra of 3-fluorotoluene and its seven 13C isotopic species have been recorded at natural abundance in the frequency range from 4 to 26 GHz using a pulsed molecular jet Fourier transform microwave spectrometer. The molecular structure comprising bond lengths and angles as well as parameters describing the methyl torsion were determined with high accuracy. Due to the very low torsional barrier of 17 cm1, the lowest torsional states of the vibrational ground state exhibited large splittings in the spectrum, which were modeled satisfactorily with a modified version of the program XIAM and the program aixPAM, two programs developed to treat the methyl internal rotation effects. They were also applied to refit the microwave data of 3,4-difluorotoluene to standard deviations close to measurement accuracy.
Keywords: large amplitude motion, internal rotation, microwave spectroscopy, structure, dynamics, rotational spectroscopy, 3-fluorotoluene, 3,4-difluorotoluene
2 *Corresponding authors:
K. P. Rajappan Nair, e-mails: kprnair@gmail.com, kpr.nair@pci.uni-hannover.de Ha Vinh Lam Nguyen, lam.nguyen@lisa.u-pec.fr
3
1. Introduction
Toluene and its derivatives have attracted much attention in chemical research including theoretical, spectroscopic, and application fields. Since the first gas phase study of toluene was reported in 1967 by Rudolph et al. [1], the rotational spectrum of toluene has never become an abandoned research target. Further studies have not only reported about an even more precisely determined structure of toluene but also about its interesting internal dynamics arising from the internal rotation of the methyl group with a V6 potential of 4.837836 cm1 [2-5]. Many halogenated
derivatives have subsequently been studied to understand the substitution effects on the structure and the methyl torsion of toluene. Among them, some studies on fluoro-derivatives were reported such as a series of six isomers of difluorotoluene [6-10], as given in Figure 1. The studies have shown that the potential barrier hindering the torsion of the methyl group varies strongly in both, shape and height, depending on the substituted positions of the two fluorine atoms. This is also confirmed in the work on two isomers of trifluorotoluene where the three fluorine atoms attached to the ring significantly affect the methyl internal rotation (see also Figure 1) [11]. Investigations on the three mono-substituted fluorotoluene are also available in the literature [12-14].
While the microwave spectra of all the above mentioned isomers of di- and trifluorotoluene [6-11] as well as 2- [12] and 4-fluorotoluene [14] have been well-understood, there remaines a black sheep in the family, 3-fluorotoluene (3FT) which resisted successful characterization. The only microwave study on 3FT by Rudolph and Trinkhaus goes back to 1968, and was a joint-venture in experiment, group theory, and Hamiltonian modeling [13]. This pioneer work using a conventional Stark modulation spectrometer with a frequency accuracy of 100 kHz suffered from problems in the spectral analysis due to the large ratio between V3 and V6 terms in the energy
potential of the methyl torsion. Though torsional states m = 0, 1, 2, 3 of the methyl top could be measured, the very limited number of m > 0 transitions led to an ambiguous determination of V3
and V6 terms in both value and sign. The combination of the barrier values 15.8(1) and 8.0(2) cm1
for V3 and V6, respectively, (set I in Ref. [13]) was not unique as the transitions could also be
reproduced at similar fit quality using respective values of 16.9(1) and 5.3(2) cm1. Furthermore, while most of the 27 lines from the lowest torsional state m = 0 could be fitted at deviations matching the measurement accuracy, the fit quality of the m > 0 transitions was unsatisfactory.
4 Deviations of up to 4.1 MHz were found for the ten m = 1 lines, and up to 6.2 MHz for the two m = 2 and the five m = 3 transitions.
There are two major issues which let 3FT remain a problematic molecule over the last 50 years. First, the energy potential exhibits an extremely low V3 term accompanied by a V6
contribution in the same low order of magnitude. In contrast to the potential of 2-fluorotoluene [12], 2,3 [6], 2,4 [7], 2,5-difluorotoluene [8], 2,3,4- [11] and 2,4,5-trifluorotoluene [11], where almost pure V3 potentials with an intermediate barrier heights close to 200 cm1 dominate, a
Hamiltonian model similar to that given in equation (2) of Ref. [13] is no longer sufficient to model simultaneously the m = 0 and m > 0 states of 3FT. In 4-fluorotoluene [14], 2,6- [10], and 3,5-difluorotoluene [10], the potential exhibits a leading V6 term by symmetry. The spectrum can be
reproduced accurately by including higher order terms available in the program RAM36 introduced earlier to deal with the rotational spectrum of toluene [5]. The comparable magnitude at very low height of V3 and V6 complicates the fitting procedure of 3FT.
Consequently, higher order terms beyond those given in equation (2) of Ref. [13] are required in the Hamiltonian to satisfactorily reproduce the microwave spectrum of 3FT, similar to the case of 2,6- and 3,5-difluorotoluene [10]. Recently, we have modified the program XIAM, one of the codes most frequently used to treat the microwave spectra of molecules with methyl internal rotors [15]. XIAM uses a combined axis method (CAM), is user-friendly and fast, but often shows difficulties when applied to low torsional barriers. Though some matrix elements are neglected in
XIAM, a microwave study on m-methylanisole has indicated that their effect on the spectral
signatures is negligible [16]. Instead, the limited number of high order parameters in XIAM seems to be a significant origin for poor fit quality. We have modified the XIAM code to deal with the broadband microwave spectrum of 4-methylacetophenone [17]. Two effective higher order parameters D3cK and D3c−, multiplying the potential terms cos(3𝛼) 𝑃𝑎2 and cos(3𝛼) (𝑃𝑏2− 𝑃𝑐2), respectively, have been implemented in addition to the already available D3cJ parameter which is
connected with the cos(3𝛼) 𝑃2 term. By using only one of those parameters, D
3cK, the
root-mean-square (rms) deviation of the 4-methylacetophenone XIAM fit was reduced from 99 kHz to 29 kHz, close to the measurement accuracy of about 25 kHz [17]. Applying the modified code to the microwave spectra of the cis and trans conformer of m-methylanisole also decreased the respective deviations from 27.0 and 32.1 kHz to 6.0 and 4.3 kHz, close to the measurement accuracy of 4
5 kHz, by adding all three D3cJ, D3cK, and D3c− parameters. This again confirms the efficiency of
those parameters for low torsional barrier cases [16,18]. The performance of XIAM has been cross-checked against the aixPAM code which works exclusively in the principal axis system (PAM) and offers several high order effective parameters [16]. We have applied the modified XIAM code to test its performance in treating the microwave spectrum of 3FT and check the results against the
aixPAM code. Furthermore, we also revisited the microwave spectrum of 3,4-difluorotoluene
(34DFT), where the performance of the original version of XIAM was acceptable, but did not achieve the measurement accuracy [9].
The second remaining issue is the restriction to the main isotopologue in the study of Rudolph and Trinkaus, probably due to the insufficient natural abundance of the minor isotopologues which inhibited the detection of their spectra using a Stark modulated spectrometer [13]. Information on the molecular geometry is limited to the three rotational constants A = 3715.3(1) MHz, B = 1766.51(1) MHz, and C = 1197.58(1) MHz and the angle between the methyl rotor axis and the principal axes of inertia. Alternation of the structure of toluene by inserting substitutions in the ring is known to be important, since geometry parameters such as bond lengths and bond angles change at the point of substitution. The use of pulsed molecular jet Fourier Transform microwave (MJ-FTMW) spectrometers has led to significant improvements in sensitivity and accuracy compared to absorption cells, enabling us to measure and study the isotopic species with even less than 1% natural abundance [21-23]. Beyond remeasuring the microwave spectrum of 3-fluorotoluene, we have also observed the spectra of its seven singly-substituted 13C isotopologues in their natural abundances using an MJ-FTMW spectrometer at Hannover with sub-kHz precision. With such accuracy, we were able to obtain precise molecular parameters for the main isotopologue. Along with those of the 13C isotopologues, the molecular structure of 3FT, including information on bond lengths and bond angles, was derived and compared with those of toluene and other fluoro-substituted toluene derivatives.
6
Figure 1. A selection of fluoro-derivatives of toluene: (1) toluene [5], (2) 2-fluorotoluene [12], (3)
3-fluorotoluene ([13] and this work), (4) 4-fluorotoluene [14], (5) 2,4,5-trifluorotoluene [11], (6) 2,3,4-trifluorotoluene [11], (7) 2,3-difluorotoluene [6], (8) 2,4-difluorotoluene [7], (9) 2,5-difluorotoluene [8], (10) 2,6-2,5-difluorotoluene [10], (11) 3,5-2,5-difluorotoluene [10], and (12) 3,4-difluorotoluene ([9] and this work).
2. Theoretical predictions
2.1. Geometry optimizations
To support the experimental work, we used two quantum chemistry methods available in the
Gaussian 16 program package [24]. The first optimization was performed using the Kohn-Sham
density functional theory [25] employing Becke’s three parameter hybrid exchange functional [26] and the Lee-Yang-Parr correlation functional [27] (B3LYP), which turned out to be adequate for predictive guidance in many previous studies on molecules containing a phenyl ring [28-31]. For comparison, calculations were repeated using the second order Møller-Plesset perturbation method (MP2) [32]. The split-valence triple-zeta basis set 6-311++G(2d,2p) was chosen in combination
7 with both methods. The equilibrium geometry of 3FT optimized at the MP2/6-311++G(2d,2p) level is illustrated in Figure 2. The Cartesian coordinates of the atoms are given in Table S1 of the Supplementary Material. Vibrational frequency calculations in the harmonic approximation confirmed that the optimized geometry is indeed a minimum and not a saddle point. Anharmonic frequency calculations were carried out to obtain vibrational ground state rotational constants and quartic centrifugal distortion constants.
Figure 2. Projection onto the ab-plane of 3FT in its principal axis system. The molecular geometry was optimized at the MP2/6-311++G(2d,2p) level of theory.
2.2. Methyl internal rotation
We started calculating the energy potential function at the MP2/6-311++G(2d,2p) level of theory by varying the dihedral angle α = (C2,C3,C7,H13) on a grid of 10° while all other geometry parameters were optimized. Because of the symmetry of the methyl group, a rotation span of 120° was sufficient. The obtained potential energy points were parameterized with a one-dimensional Fourier expansion and then drawn as a contour plot presented in Figure 3. The potential curve indicates three-fold double minima in the regions 0120°, 120240°, as well as 240360°, i.e. local maxima at αmax = αi = 60°, 180°, and 300° separating the double-minima at αmin αi ± 24°. The V3 and V6 coefficients are 16.30 and 12.60 cm1, respectively, and a small V9 term of 0.38
8 with the B3LYP method results in a three-fold potential with a dominant V3 = 15.61 cm1 term and only a small V6 contribution of 4.18 cm1, leading to single energy minima at αi. However, we noticed that the minima appear extremely broad and repeated the calculations in the region of 60° around αi with a finer step size of 2°. The results depicted in the inset of Figure 3 reveals that the B3LYP method indeed predicts somewhat closer lying double minimum which is present at αmin αi ± 10°, with the dividing barrier being lower than 0.1 cm1.
We noticed four conformations on the potential curves in Figure 3, each of which appears three times during a full rotation of the methyl group. In the conformation at α = 0°, the H13 atom is eclipsed with the H9 atom if we look along the a-axis. The second one at α 36° (MP2 value) has the C7−H14 bond roughly perpendicular to the ring plane. In the third conformation with α = 60°, the H15 atom is eclipsed with the H10 atom. The fourth conformation at α 84° has the C7−H13 bond roughly perpendicular to the ring plane and is equivalent to the α 36° position, assuming the planarity of the phenyl ring as expected for an aromatic system. Full geometry optimizations following by harmonic frequency calculations confirmed all of them to be stationary points, as summarized in Table 1, with those at α = 36° and α = 84° as the most stable rotamers for the MP2 method as well as α = 49° and α = 71° for the B3LYP method. Both methods predicted the conformers at α = 0° and 60° to correspond to saddle points. The estimation for the V3 potential including the zero-point energy (ZPE) correction is also given in Table 1. With both methods, the difference of the ZPE corrections for the double-minimum and the barrier dividing it is larger than the value for this barrier, i.e. the zero-point vibrational level lies above the barrier at αi = 60°. Nevertheless, this difference is smaller than the value of the three-fold barrier, indicating that the potential can be effectively described by a V3 term.
9
Figure 3. Potential energy curves of the methyl torsion of 3FT obtained by varying the dihedral
angle = (C2,C3,C7,H13) in a grid of 10°, while all other molecular parameters were optimized at the B3LYP/6-311++G(2d,2p) (in blue) and MP2/6-311++G(2d,2p) (in black) levels of theory. The energies are relative to the energetically lowest conformations. Inset: in the range from 270° to 330°, calculations at the B3LYP/6-311++G(2d,2p) level were repeated at a finer step of 2° to capture the double minimum at = 290° and 310° separated by a very flat local maximum at = 300°.
Table 1. Dihedral angle α, the path αpath between the structures, the energy at the stationary points
E, the energy difference E between the structures, the energy with vibrational corrections E+ZPE,
and the energy difference (E+ZPE) between the structures of 3FT calculated at the B3LYP/6-311++G(2d,2p) and MP2/6-B3LYP/6-311++G(2d,2p) levels of theory.
Method α / ° Type E / Hartree E+ZPE /
Hartree αpath E / cm1 (E+ZPE) / cm1 B3LYP 0.0 max –370.9214200 –370.802192 0.0 10.7 –15.71 –7.24 10.7 min –370.9214916 –370.802225 60.0 10.7 –0.04 6.58 60.0 max –370.9214914 –370.802255 60.0 0.0 15.67 13.83 MP2 0.0 max –369.9500796 –369.830411 0.0 23.8 –22.10 10.75 23.8 min –369.9501803 –369.830362 60.0 23.8 –6.28 28.09 60.0 max –369.9501517 –369.830490 60.0 0.0 15.82 17.34
10
3. Microwave Spectroscopy
3.1. Experimental setup
The microwave spectrum of 3FT was recorded in the frequency range from 4 to 26 GHz using a pulsed supersonic MJ-FTMW spectrometer in Hannover with a coaxially oriented beam-resonator arrangement (COBRA) [33]. The longer transit time of the molecular jet, corresponding to line-shapes that are narrower in frequency, results in an accuracy advantage of the COBRA compared to a perpendicular arrangement. The substance was kept in a small reservoir at the nozzle orifice, and neon or helium as carrier gas was passed over the sample at a stagnation pressure of 1 bar. All frequency measurements were referenced to a GPS-disciplined rubidium frequency standard. The estimated uncertainty is better than 1 kHz for unblended lines while transitions separated less than 5 kHz are not resolved. The adiabatic expansion simultaneously reduces the collisional as well as Doppler line broadening and the molecules experience a strong rovibrational cooling, leaving only the lowest-lying rovibrational levels populated, thus efficiently simplifying the observed spectrum.
The molecular electric dipole moments were determined using the Stark effect. Instead of external electrode plates, we used the spherical reflectors forming the resonator as high-voltage electrodes (Coaxially Aligned Electrodes for Stark effect Applied in Resonators, CAESAR [34]). With the electromagentic radiation propagating in TEM00q modes, the direction of the static electric Stark field is perpendicular to the polarized microwave field, leading exclusively to the ∆MJ = ±1 transitions. Stark effect measurements in the J = 1 ← 0 rotational transitions of the
OC36S and 18OCS isotopologues of OCS were used to calibrate the electric field strength in the cell using a dipole moment value of = 0.71519(3) D [35], as described in Ref. [36].
3.2. Measurements
The rotational constants determined in Ref. [13] were used to predict the rigid rotor spectrum of 3FT in the frequency range of the spectrometer. Since only transitions originating from the ground vibrational state v = 0 are expected in our jet cooled spectrum, we targeted the associated two lowest torsional state m = 0 and m = 1, henceforth called the A and the E species. The lines of the A symmetry species follow a rigid rotor pattern and could be fitted well to a standard deviation of 0.7 kHz using an effective Hamiltonian 𝐻 = 𝐻𝑟+ 𝐻𝑐𝑑comprising rotational and quartic centrifugal distortion terms of Watson’s S reduction in its Ir representation, as implemented in the program
11
SFLAMS written for Separately Fitting of Large Amplitude Motion Species [17,37]. The V3 potential term and the angle (i,a) between the internal rotor axis and the a-principal axis of inertia reported in Ref. [13] was helpful to identify and assign the E species lines. The assignments of the E species lines were also checked with SFLAMS using the additional odd power term
𝐻𝑜𝑝 = (𝑞 + 𝑞𝐽𝑃2+ 𝑞𝐾𝑃𝑎2)𝑃𝑎+ (𝑟 + 𝑟𝐽𝑃2+ 𝑟𝐾𝑃𝑎2)𝑃𝑏 (1) in the Hamiltonian, where P is the angular momentum operator with its components Pa, Pb, Pc
referring to the principal axes of inertia a, b, and c. The parameters q and r are sometimes called
Da and Db in the literature where the higher order terms qJ, qK, rJ, and rK can be also found as DaJ,
DaK, DbJ, and DbK. The separate SFLAMS fit for the E species achieved a standard deviation of 2.7
kHz. Typical spectra of the A and E symmetry species components of a rotational transition are shown in Figure 4.
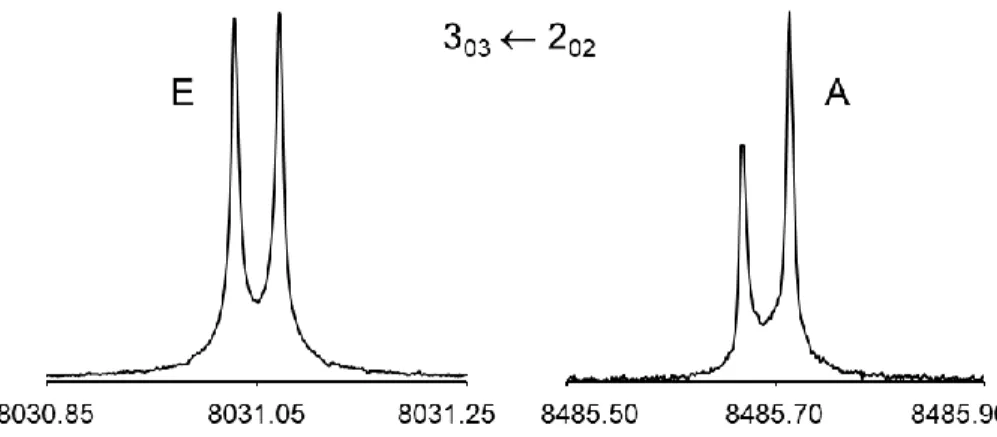
Figure 4. A typical 𝐽′′𝐾𝑎′′𝐾
𝑐′′ ← 𝐽′𝐾𝑎′𝐾𝑐′ rotational transition of 3FT which splits into an A and an E
symmetry species. The doublets arise from the Doppler effect; the mean frequency is 8031.0496 MHz for the E species and 8485.6905 MHz for the A species. For these spectra, 771 and 939 free-induction decays, respectively, were co-added.
3.3. Spectral analysis
The rotational transitions of 3FT were fitted using a modified version of the program XIAM, henceforward called the XIAMmod code [17,18], available at the PROSPE website [38]. The
12
𝐻 = 𝐻𝑟+ 𝐻𝑐𝑑+ 𝐻𝑖𝑟+ 𝐻𝑖𝑟𝑑. (2)
The centrifugal distortion term 𝐻𝑐𝑑 in the Hamiltonian comprises standard fourth order terms for a semi-rigid rotor according to Watson’s S-reduction. The standard rigid frame-rigid top Hamiltonian is similar to that given in equation (2) of Ref. [13]:
𝐻𝑟+ 𝐻𝑖𝑟 = 𝐴𝑃𝑎2 + 𝐵𝑃𝑏2+ 𝐶𝑃𝑐2+ 𝐹𝜋𝛼2 + 𝑉(𝛼), (3)
which contains the structural rotational constants and the reduced rotational constant F of the methyl top. 𝜋𝛼= 𝑝𝛼− 𝜌𝑎𝑃𝑎− 𝜌𝑏𝑃𝑏 contains the angular momentum 𝑝𝛼 of the methyl top and 𝜌𝑔 = 𝜆𝑔𝐼𝛼/𝐼𝑔 with g = a, b. 𝐼𝛼 is the moment of inertia of the methyl top, 𝐼𝑔 are the components of principal moments of inertia of the molecule, and 𝜆𝑔 are the direction cosines between the internal rotation axis i and the respective inertial axes. The leading terms of the hindering potential 𝑉(𝛼) can be written as in equation (2) of Ref. [13]:
𝑉(𝛼) = 𝑉3
2 [1 − cos(3𝛼)] + 𝑉6
2 [1 − cos(6𝛼)]. (4)
Generally, higher order potential terms (V6, V9 etc.) cannot be determined from the vibrational ground state alone and thus are normally neglected. In the previous work on 3FT, Rudolph and Trinkaus used a Stark modulated spectrometer and could obtain the spectra in four torsional states m = 0, 1, 2, 3 [13]. It was thus possible to derive both the V3 and the V6 terms of the potential. Since our study was limited to the ground torsional state because of jet expansion cooling, we could only float either V3 or V6 in our fits. In the case of 3FT, only V3 is floated.
𝐻𝑖𝑟𝑑 is not included in the Hamiltonian given in Ref. [13]. It gives the empirical internal rotation - overall rotation distortion operator in the principal axis system and includes the two parameters Dc3K and Dc3 newly implemented in XIAM. In the case of 3FT, it can be written as:
𝐻𝑖𝑟𝑑 = 2𝐷2𝜋𝐽(𝑝𝛼− 𝜌⃗+𝑃⃗⃗) 2 𝑃2+ 𝐷 2𝜋𝐾{(𝑝𝛼− 𝜌⃗+𝑃⃗⃗) 2 , 𝑃𝑎2} + 𝐷2𝜋−{(𝑝𝛼− 𝜌⃗+𝑃⃗⃗) 2 , (𝑃𝑏2− 𝑃 𝑐2)} + 𝐷𝑐3𝐽cos(3𝛼)𝑃2+ 𝐷𝑐3𝐾cos(3𝛼)𝑃𝑎2+ 𝐷𝑐3−cos(3𝛼)(𝑃𝑏2− 𝑃𝑐2). (5) where 𝑃⃗⃗ is the angular momentum vector along the rho axis.
A total of 61 A species and 54 E species lines could be measured and fitted, yielding a quite satisfactory standard deviation of 3.3 kHz. The fitted parameters are collected in the column
13 is given in Table S2 of the Supplementary Material. The original version of XIAM without the Dc3K
and Dc3 parameters yielded a deviation of 26.3 kHz. Omitting also the third effective high order
parameters Dc3J leads to another small increase of the deviation to 27.1 kHz.
We finally applied the aixPAM code [16] to cross-check the performance of XIAMmod.
aixPAM works in the principal axis system and can fit the torsion–rotation spectra of molecules
with one methyl rotor. Unlike XIAM, aixPAM does not neglect any matrix elements except for the truncation of the matrix (kmax), and effective high order Hamiltonian terms can be added from the input file. Using a comparable set of parameters, aixPAM slightly improved the standard deviation of the XIAMmod fit from 3.3 kHz to 1.5 kHz. The fit is shown in the column aixPAM of Table 2.
The residuals given by aixPAM are also presented in Table S2 of the Supplementary Material.
3.4. The 13C isotopologues
Transitions originating from the 13C isotopologues arising from seven inequivalent substitution positions of the carbon skeleton have also been measured in their natural abundance of 1%. The Cartesian coordinates of the optimized structure in Figure 2 were taken, and the mass of the individual carbon atoms was adjusted to calculate the rotational constants of all 13C isotopologues. The predicted 13C-frequencies were corrected with the differences between the frequencies predicted with the Be constants obtained at the MP2/6-311++G(2d,2p) level and the
experimental frequencies of the main species, leading to straightforward assignments of all 13C isotopologues. Since the number of E species lines are small, only the rotational constants, the centrifugal distortion constants, the torsional barrier V3, the angle (i,a), and 𝐹0 =8𝜋ℎ2𝐼𝛼 were
fitted. All higher order terms associating with 𝐻𝑖𝑟𝑑 were kept fixed at the respective values of the main species. The A and E transitions of all 13C isotopologues were also checked by separate fits, unless the smaller number of observed E species lines was insufficient for an independent analysis. The molecular and internal rotation parameters of the 13C species are collected in Table 3. The lists of fitted transitions and their residuals are available in Table S3 of the Supplementary Material.
14
Table 2. Molecular parameters of 3FT obtained using the modified XIAM code and the program
aixPAM.
3-fluorotoluene (3FT) 3,4-difluorotoluene (34DFT)
Par.a Unit XIAM
modb aixPAMc MP2d B3LYPe XIAMmodb aixPAMc
A MHz 3657.122(32) 3632.76(18) 3654.2 3664.5 3037.5386(14) 3035.870(26) B MHz 1762.2985(23) 1762.863(13) 1759.6 1763.8 1290.69640(20) 1293.76(40) C MHz 1197.57678(13) 1198.242(14) 1196.5 1199.5 910.87391(12) 908.49(40) DJ kHz 0.0676(18) 0.06102(84) 0.0657 0.1377 0.02312(54) 0.02177(47) DJK kHz −0.107(11) −0.0125(53) −0.0049 0.0861 0.0704(93) 0.1031(723) DK kHz −0.76(16) 0.577(88) 0.6762 0.5580 0.588(57) 0.403(44) d1 kHz −0.0231(13) −0.02399(56) −0.0244 −0.0256 −0.00792(33) −0.00772(25) d2 kHz 0.00232(74) −0.00348(56) −0.0013 0.0335 −0.00136(28) −0.0015236(26) Dπ2J MHz 0.0495(21) 0.02420(73) Dπ2K MHz 1.567(28) 0.6671(75) Dπ2 MHz 0.1457(49) 0.04401(14) −0.517(38) −0.203(31) V3 cm−1 17.1785(86) 16.4737(46) 16.30 15.61 32.5042(2) 32.4860(11) F0 GHz 168.669(92) 164.302(40) 162.021 161.742 162.116 162.116 VJ/Dc3Jf MHz −0.187(22) −0.787(16) −0.2489(17) −0.4849(27) VK/Dc3Kf MHz 22.31(30) 28.35(21) 1.225(11) 2.910(37) V/Dc3f MHz 1.004(50) −4.49(32) −3.65(53) (i,a)g ° 29.6131(2) 29.4596(11) 30.0551 30.0151 12.5579(2) 12.5247(37) NA/NEh 61/54 61/54 51/33 51/33 σi kHz 3.4 1.5 3.5 2.4
a All parameters refer to the principal axis system.Watson’s S reduction and Ir representation were used. Standard errors are in the units of the last digits. b Fitwith the modified version of XIAM. c Fitwith the program aixPAM. d
Calculated at the MP2/6-311++G(2d,2p) level of theory. The rotational constants refer to the equilibrium structure. The vibrational ground state constants are A0 = 3625.6, B0 = 1750.3, and C0 =1189.1 MHz. Centrifugal distortion constants are obtained from anharmonic frequency calculations. e Calculated at the B3LYP/6-311++G(2d,2p) level of
theory. The vibrational ground state constants are A0 = 3602.9, B0 = 1765.2, and C0 =1193.3 MHz. f VJ, VK, V in
aixPAM and D3cJ, D3cK, D3c in XIAMmod. g (i,b) = 90° (i,a). (i,c) was fixed to 90° in all fits due to symmetry. h Number of the A and E species lines. i Standard deviation of the fit.
15
Table 3. Molecular parameters of the 13C isotopologues of 3FT obtained from the XIAMmod fits. Atoms are numbered according to Figure 2. Values
of the 𝐷𝜋2𝐽, 𝐷𝜋2𝐾, 𝐷𝜋2−, Dc3J, Dc3K, and Dc3 are fixed to those of the main species.
Par.a Unit 13C(1) 13C(2) 13C(3) 13C(4) 13C(5) 13C(6) 13C(7) A MHz 3655.331(20) 3632.090(15) 3655.071(21) 3624.980(26) 3573.091(15) 3624.993(18) 3630.5746(73) B MHz 1754.5982(18) 1762.37419(99) 1752.5249(19) 1752.8152(19) 1762.3031(17) 1753.7662(17) 1722.29698(57) C MHz 1193.83151(38) 1194.89902(24) 1192.85255(35) 1189.75746(40) 1188.43973(37) 1190.20317(36) 1176.20068(16) DJ kHz 0.0157(60) 0.0673(23) 0.0717(58) 0.0640(37) 0.0670(49) 0.0631(51) 0.0658(15) DJK kHz −0.46(15) −0.107b −0.107b −0.107b −0.107b −0.107b −0.107b DK kHz −0.76b −0.76b −2.21(70) −0.76b −0.76b −0.76b −0.76b d1 kHz −0.0302(45) −0.0246(17) −0.0223(43) −0.0186(28) −0.0212(35) −0.0173(35) −0.0227(11) d2 kHz 0.0321(38) 0.00232b 0.0053(21) 0.00232b 0.00232b 0.00232b 0.00232b V3 cm−1 17.1827(44) 17.1792(46) 17.1549(46) 17.2182(87) 17.1393(38) 17.1497(45) 17.1764(21) F0 GHz 168.696(50) 169.038(39) 168.394(59) 168.468(70) 168.295(41) 168.417(49) 168.493(20) (i,a) ° 29.7295(2) 29.5937(8) 29.4791(2) 30.1496(12) 29.6344(1) 29.1071(2) 28.6314(3) NA/NEc 39/15 38/10 30/12 32/10 26/13 33/13 48/12 σd kHz 6.5 3.3 5.4 5.3 5.1 6.6 3.0
a All parameters refer to the principal axis system. Watson’s S reduction and Ir representation were used. b Fixed to the value of the main species.
c Number of the A and E species lines. d Standard deviation of the fit .
16
3.5. Reanalysis of 3,4-difluorotoluene
Though the microwave spectrum of 34DFT has been understood reasonably well, the fit using the original version of XIAM has not achieved measurement accuracy [9]. An order of magnitude larger standard deviation of 47 kHz has been reported and attempts to reduce it were not successful. By separately fitting the A and E species lines with SFLAMS, we found that one A symmetry species and three E symmetry species transitions reported in Ref. [9] were misassigned. Eliminating these four transitions did not significantly reduce the standard deviation, which was the reason why these misassignments were not recognized in Ref. [9]. Excluding the misassigned transitions and using the three D3c parameters provided in the XIAMmod code reduces the deviation
of the fit to 3.5 kHz (given in the column XIAMmod of Table 2), while it remains at 40 kHz for the
data set reported in Ref. [9].
Applying the aixPAM code to the corrected data set using a set of parameters comparable to the XIAMmod code, only a slightly better deviation of 3.0 kHz is obtained. The fitted rotational
transitions and deviations in both fits are given in Table S4 of the Supplementary Material.
3.6. Electric dipole moment
Rudolph and Trinkaus determined the electric dipole moment components of 3FT to be a
= 1.71(2) D and b = 0.62(2) D from the Stark satellite of the 303 202 and 322 221 A species transitions [13]. To improve the accuracy of these values, we performed Stark measurement using the CAESAR setup of the spectrometer. The measurements were performed at different electric fields and limited to three low-J transitions given in Table S5. The observed Stark transitions were fitted with the program QSTARK [39], yielding a total dipole moment of |μ| = 1.8408(51) D with the components |μa| = 1.7327(23) D and |μb| = 0.6217(86) D. The dipole moment component in the
c-direction is zero due to symmetry.
4. Microwave structure determinations
The rs structure of 3FT was derived from multiple isotopic data using the rotational constants of
the main species given in Table 2 and those obtained for seven 13C isotopologues collected in Table 3. The position of each substituted carbon atom was first calculated using the substitution method of Kraitchman, which provides the absolute atomic coordinates in the principal axis system
17 [40,41]. The uncertainties were calculated according to Costain’s estimate error [42] and the signs of the atom coordinates were taken to be consistent with the MP2-optimized geometry. The resulting atomic coordinates are given in Table 4. The bond lengths and bond angles are determined with the program EVAL available at the PROSPE website [38] and given in Table 5. For the EVAL input, all values of the c-coordinates were set to zero.
Table 4. Experimental atom positions (substitution rs and semi-experimental r0 structures) of 3FT
obtained by isotopic substitutions with Kraitchman’s equations [40,41] as implemented in the programs KRA and STRFIT [43]. All c-coordinates of the KRA output were set to zero to be consistent with planarity. For comparison, the equilibrium atom positions (re structure) obtained
from optimizations at the MP2/6-311++G(2d,2p) level of theory are presented.
rs r0 re
a/Å b/Å a/Å b/Å c/Å a/Å b/Å c/Å
C(1) –1.1243(14) –0.2615(60) –1.2777(15) –0.2813(24) 0.01084(2) –1.1310 –0.2666 –0.0013 C(2) 0.05916* –0.9804(16) –0.0596(25) –0.9796(19) 0.00831(1) 0.0592 –0.9774 0.0083 C(3) 1.2668(13) –0.2772(56) 1.1336(20) –0.2699(24) –0.00135(2) 1.2743 –0.2838 0.0109 C(4) 1.2434(13) 1.1158(14) 1.1794(22) 1.1198(21) –0.00746(2) 1.2488 1.1149 0.0073 C(5) 0.03827* 1.80745(86) –0.0330(26) 1.81279(59) –0.00214(1) 0.0383 1.8094 –0.0021 C(6) –1.1785(14) 1.1142(14) –1.2474(14) 1.1191(21) 0.00727(3) –1.1741 1.1194 –0.0075 C(7) 2.57923(59) –1.0306(15) –2.5815(15) –1.0364(24) –0.01085(2) 2.5781 –1.0380 –0.0109 F(8) 2.2918(23) –0.95995(96) –0.00073(1) –2.2980 –0.9561 –0.0007 H(9) –0.0329(42) –2.0296(21) 0.01655(1) 0.0297 –2.0582 0.0168 H(10) –2.1523(24) 1.6531(37) 0.01566(3) 2.1812 1.6630 0.0159 H(11) –0.0285(43) 2.8630(11) –0.00192(2) 0.0356 2.8899 –0.0019 H(12) 2.1046(29) 1.6138(37) –0.0107(3) –2.1252 1.6295 –0.0108 H(13) –2.8377(20) –1.3163(30) –1.00166(1) 2.8411 –1.3250 –1.0277 H(14) –2.5198(33) –1.9214(24) 0.5685(6) 3.3868 –0.4280 0.3828 H(15) –3.3689(16) –0.4432(42) 0.3723(4) 2.5153 –1.9461 0.5836
* Imaginary coordinates from the KRA fit. For the determination of bond lengths and angles using EVAL, values from the re geometry calculated at the MP2/6-311++G(2d,2p) are taken.
18
Table 5. Bond lengths (in Å) and bond angles (in degrees) of 3FT deduced from the substitution
rs, semi-experimental r0, and equilibrium re structures. Standard errors in parentheses are in the
unit of the least significant digits.
rs r0 [a] re[b] C1–C2 1.3855(35) 1.4041(12) 1.3863 C2–C3 1.3981(32) 1.4041(12) 1.3992 C3–C4 1.3910(58) 1.4041(12) 1.3990 C4–C5 1.3897(14) 1.4041(12) 1.3957 C5–C6 1.4005(14) 1.4041(12) 1.3950 C1–C6 1.3746(62) 1.4041(12) 1.3867 C3–C7 1.5137(32) 1.5068(22) 1.5064 C1–C2–C3 118.42(32) 119.43 C2–C3–C4 119.29(23) 118.68 C3–C4–C5 120.84(11) 120.88 C4–C5–C6 120.45(10) 120.51 C5–C6–C1 117.42(12) 117.86 C6–C1–C2 123.59(25) 122.63 C4–C3–C7 120.86(22) 121.31(22) 120.23
a All CH bond lengths and all CC bond lengths within the phenyl ring are constrained to be the same. The fitted
CH and CF bond lengths are 1.0503(11) and 1.3482(41) Å, respectively. The fitted F8-C1-C2 angle is 118.47(20) Å.
b Calculated at the MP2/6-311++G(2d,2p) level of theory.
The rs structure only represents a partial structure determination since the hydrogen and
fluorine related coordinates cannot be determined. Nevertheless, their equilibrium coordinates predicted at the B3LYP/6-311++G(2d,2p) level can be used together with the experimental A0, B0, and C0 rotational constants to enable a fit using the program STRFIT [43], yielding the semi-experimental r0 structure. In the fitting, we allowed the hydrogen and fluorine atom locations to
vary, but all CH bond lengths and all CC bond lengths within the phenyl ring are constrained to be the same. The atom coordinates, the fitted bond lengths and bond angles of the r0 structure are
19
Figure 5. Experimental bond lengths (blue, in Å) and bond angles (red, in degrees) of 3FT obtained
from the substitution rs structure. Standard errors in parentheses are in the unit of the least
significant digit.
5. Discussion
5.1. Quality of the fits
Using the modified version of the CAM program XIAM, the microwave spectrum of 3FT could be reproduced with a standard deviation of 3.4 kHz, close to measurement accuracy. The deviation obtained with XIAMmod was reduced to 1.5 kHz if the program aixPAM working in the principle
axis system was used.
Involving all three higher order D3c parameters and F0 is decisive to reduce the deviation
in the XIAMmod fit, whereas aixPAM does not need to float the V parameter, but also requires F0
to be fitted. The correlation between F0 and V3 in the XIAMmod fit is 1.000, which is frequently
observed when the data set only contains transitions from the vibrational ground state. Therefore,
F0 should be fixed to a reasonable value, typically that predicted by quantum chemistry. In several
cases, however, fitting F0 improves significantly the fit, but sometimes it takes values which hardly
agree with the moment of inertia of a methyl group [44-48], including the present case of 3FT. The value of 168.669(92) GHz obtained for F0 is abnormally large compared to that often observed
and structurally plausible for a methyl rotor (158-162 GHz) as well as the values indeed predicted by quantum chemistry (see Table 2). Contaminated by absorbing the effects of high order effective
20 internal rotor parameters that are not explicitly included in the rigid frame-rigid top model, F0
becomes an effective parameter. With aixPAM, the F0-V3 correlation of 0.883 is better.
Consequently, the value of 164.302(40) GHz found for F0, though still slightly too high, is more
reasonable. The F0-V3 correlation also explains different values found for V3 in the XIAMmod and
aixPAM fits. We note that the errors given in parentheses in the unit of the last significant digits
are fitting errors and depend on the model and the set of parameters in use.
The sign of DK yielded by XIAMmod is opposite to the values obtained from aixPAM and
quantum chemistry. High order effective parameters like Dc3 severely correlate with geometry
parameters, especially the rotational constants but also the centrifugal distortion constants, making the physical meaning of the geometry parameters less clear. For example, we have observed for some molecules with low barriers to methyl internal rotation that the centrifugal distortion constants are contaminated by the internal rotation effects and become themselves effective parameters which no longer solely present the effects of centrifugal distortion [17,49]. The sign of
d2 is also different in the XIAMmod and aixPAM fits, but for this parameter, calculations at different
levels of theory do not agree in sign either.
The internal rotation parameters involved in 𝐻𝑖𝑟𝑑 obtained with XIAMmod and aixPAM
match well. The angle (i,a) is in excellent agreement. The B and C rotational constants deduced from XIAMmod and aixPAM are similar, but the A rotational constants are not. This has quite often
been observed in previous studies where the two approaches (CAM vs PAM) were compared [16,17,50]; all of them suggested the correlation between A and VK as the main origin.
The standard deviation obtained with XIAMmod for the 13C isotopologue fits, except for C(2)
and C(7), is slightly higher, but similar to that of the main species fit, probably because the values of high order parameters in 𝐻𝑖𝑟𝑑 are kept fixed at those determined for the main species. Individual adjustments were not possible due to the small number of E species lines available for the 13C isotopologues. Because of the correlation between A and VK discussed above, we did not perform
comparable aixPAM fits for the 13C isotopologues, since the rotational constants obtained from those fits would not be reliable for structure determination purposes.
Rudolph and Trinkaus proposed two sets of potentials for 3FT with the V3/V6 values of
21 similar quality [13]. Okuyama et al. later confirmed that set II agrees better with their experimental results obtained in the ground and electronic excited states using fluorescence and dispersed fluorescence spectroscopy [51] As our data set only contains transitions from the vibrational ground state, V3 and V6 cannot reliably be determined simultaneously. However, attempting to fit
both terms by XIAMmod simultaneously, values of 17.26(17) and 1.4(23) cm1 (which indeed are
in better agreement with set II of Ref. [13]) are obtained at a correlation of 0.999. Therefore, we decided to fix V6 to zero, in agreement with the conclusion drawn from the results of quantum
chemical calculations (see Section 2.2). Including the m = 2 and 3 transitions reported in Ref. [13] to determine V6 was not successful due to the small number of m = 2 (two) and 3 (five) lines and
the lack of trust in their assignment.
For 34DFT, both XIAMmod and aixPAM do not require 𝐷𝜋2𝐽, 𝐷𝜋2𝐾, and F0 to be fitted, but all three Dc3 (or VJ, VK, V) parameters. We thus fixed F0 to the value predicted at the
MP2/6-311++G(2d,2p) level of theory. The agreement in structural parameters like rotational constants, centrifugal distortion constants, and (i,a) as well as all high order parameters in 𝐻𝑖𝑟𝑑 is much better compared to the 3FT fits. Because F0 is fixed to the same value, the values of V3 in the
XIAMmod and aixPAM fits match well. The standard deviation of aixPAM is slightly lower
compared to that obtained with XIAMmod (2.4 kHz vs 3.5 kHz). The small difference can be traced
back to the negligence of some matrix elements in XIAM, as discussed in Ref. [16], but also because the parameters VJ, VK, V and Dc3J, Dc3K, and Dc3 refer to different coordinate systems.
They are comparable but not equivalent.
5.2. Methyl torsional barrier
The V3 potential of 17 cm1 found for 3FT is the lowest of all fluoro-substituted toluene derivatives
given in Figure 1, followed by 34DFT (32.5 cm1). All other molecules possess a fluorine atom at a substitution position next to the methyl group, causing steric hindrance of the methyl torsion from which 3FT and 34DFT are free of. As previously discussed [52,53], the more substituents contribute to break the C2v symmetry of toluene, the larger is the V3 contribution to the potential.
In 3FT, the presence of a fluorine atom at the meta-position of toluene breaks the C2v symmetry. In the case of 34DFT, two fluorine atoms are attached to the ring and the V3 value is larger.
22 Challenging low torsional barrier problems are observed for all meta-mono-substituted toluene, such as m-chlorotoluene (3.24 cm1) [54], m-methylanisole (55.77 and 36.63 cm1 for the syn and the anti-conformer, respectively) [16], m-tolune nitrile (14.20 cm1) [55], xylene (4.49 cm1) [56],
m-cresole (syn: 22.44 cm1, anti: 3.2 cm1) [57], and m-methylbenzaldehyde (syn: 35.93 cm1, anti: 4.64 cm1) [58]. Quite low barriers are also found in 3,4-disubstituted toluenes, such as 34DFT (32.5 cm1) and 2,4-dimethylanisole (47.65 cm1) [50].
5.3. Geometry parameters and dipole moments
The Be rotational constants predicted at both levels of theory match the experimental constants
well; also the isotopic dependence is well-reproduced (see Table S6). Though it is not physically meaningful to compare predicted Be constants with experimental B0 constants, the MP2 and
B3LYP methods in combination with the 6-311++G(2d,2p) basis set offer cost-efficient calculations with sufficient accuracy to be useful in guiding the assignment of vibrational ground state microwave spectra of fluoro-substituted toluenes, as done in many previous investigations [6-11].
The structure of benzene, well-established by X-ray diffraction, possesses a constant CCC angle of 120° and a constant C–C distance of 1.39 Å between six carbon atoms, which is greater than a C–C double bond of 1.35 Å but shorter than a C–C single bond of about 1.47 Å. It is known that substitutions on the phenyl ring can affect structural parameters such as bond lengths and bond angles at the substituted positions [59-61]. Comparing the structure of 3FT to the structures of toluene as the prototype [2], 4-fluorotoluene [14], 34DFT [9], and 3,5-difluorotoluene [10] shows that the methyl substitution has little effect on the ring geometry in its surrounding, as long as a fluorine atom is not nearby. The CCC angle of the ring at the methyl substituted position remains close to 120° and the CC bond lengths are approximately 1.39 Å. On the other hand, the fluorine atom with its –I effect slightly enlarges the CCC angle at the fluoro-substituted position. The neighboring CCC angle thus becomes smaller. The CCH3 bond length varies slightly around 1.5 Å in all molecules indicated in Figure 1. A more quantitative analysis is not attempted because various fitting approaches as well as sets of fitting parameters were used to treat the effects of methyl internal rotation in different molecules, making the deduced geometry parameters not directly comparable.
23 The dipole moment components |μa| = 1.7327(23) D and |μb| = 0.6217(86) D determined in
the present work agree well with those reported by Rudolph and Trinkaus [13], but are more precise by an order of magnitude. The values of 1.74 and 0.58 D, as well as 1.80 and 0.57 D predicted with the MP2 and B3LYP methods, respectively, agree consistently.
6. Conclusion
The rotational spectra of the main species and all seven 13C isotopologues of 3-fluorotoluene have been studied in a jet expansion, allowing the observation of the lowest-lying torsional states of the vibrational ground state. Each rotational transition splits into two components arising from the internal rotation of the methyl group. The torsional doublings were analyzed with a modified version of the program XIAM and the program aixPAM to extract the three-fold potential barrier hindering the methyl torsion. The quality of both XIAMmod and aixPAM fits is very satisfactory.
The spectrum of the main species of 3,4-difluorotoluene was refitted, achieving standard deviation close to measurement accuracy. From the spectroscopic constants of the complete set of 13C isotopologues, accurate bond length and bond angles of 3-fluorotoluene could be determined from the rs and r0 structure. Stark effect measurements yielded precise dipole moments.
Acknowledgements
The authors thank the Land Niedersachsen and the Deutsche Forschungsgemeinschaft (DFG) for funding. This work was supported by the Agence Nationale de la Recherche ANR (project ID ANR-18-CE29-0011).
References
[1] H.D. Rudolph, H. Dreizler, A. Jaeschke, P. Wendling, Z. Naturforsch. 22a (1967) 940. [2] W.A. Kreiner, H.D. Rudolph, B.T. Tan, J. Mol. Spectrosc. 48 (1973) 86.
[3] V. Amir-Ebrahimi, A. Choplin, J. Demaison, G. Roussy, J. Mol. Spectrosc. 89 (1981) 42. [4] Z. Kisiel, E. Białkowska-Jaworska, L. Pszczółkowski, H. Mäder, J. Mol Spectrosc. 227 (2004) 109.
24 [5] V.V. Ilyushin, Z. Kisiel, L. Pszczółkowski, H. Mäder, J.T. Hougen, J. Mol. Spectrosc. 259 (2010) 26.
[6] K.P. Rajappan Nair, S. Herbers, J.-U. Grabow, A. Lesarri, J. Mol. Spectrosc. 349 (2018) 37. [7] K.P. Rajappan Nair, S. Herbers, D.A. Obenchain, J.-U. Grabow, A. Lesarri, J. Mol.
Spectrosc. 344 (2018) 21.
[8] K.P. Rajappan Nair, D. Wachsmuth, J.-U. Grabow, A. Lesarri, J. Mol. Spectros. 337 (2017) 46.
[9] K.P. Rajappan Nair, S. Herbers, J.-U. Grabow, J. Mol. Spectrosc. 355 (2019) 19. [10] K.P. Rajappan Nair, M.K. Jahn, A. Lesarri, V.V. Ilyushin, J.-U. Grabow, Phys. Chem. Chem. Phys. 17, (2015) 26463.
[11] K.P. Rajappan Nair, S. Herbers, D. A. Obenchain, J.-U. Grabow, Can. J. Phys. 98 (2020) 543.
[12] S. Jacobsen, U. Andresen, H. Mäder, Struct. Chem. 14 (2003) 217. [13] H.D. Rudolph, A. Trinkaus, Z. Naturforsch. 23a (1968) 68.
[14] J. Rottstegge, H. Hartwig, H. Dreizler, J. Mol. Struct. 478 (1999) 37. [15] H. Hartwig, H. Dreizler, Z. Naturforsch. 51a (1996) 923.
[16] L. Ferres, W. Stahl, H.V.L. Nguyen, J. Chem. Phys. 148 (2018) 124304.
[17] S. Herbers, S.M. Fritz, P. Mishra, H.V.L. Nguyen, T.S. Zwier, J. Chem. Phys. 152 (2020) 074301.
[18] S. Herbers, H.V.L. Nguyen, J. Mol. Spectrosc. 370 (2020) 111289.
[21] R. Hakiri, N. Derbel, W.C. Bailey, H.V.L. Nguyen, H. Mouhib, Mol. Phys. (2020). DOI: 10.1080/00268976.2020.1728406.
[22] H.V.L. Nguyen, J.-U. Grabow, ChemPhysChem 21 (2020) 1243. [23] V. Van, W. Stahl, H.V.L. Nguyen, J. Mol. Struct. 1123 (2016) 24.
[24] M.J. Frisch, G.W. Trucks, H.B. Schlegel, G.E. Scuseria, M.A. Robb, J.R. Cheeseman, G. Scalmani, V. Barone, G.A. Petersson, H. Nakatsuji, X. Li, M. Caricato, A.V. Marenich, J. Bloino, B. G. Janesko, R. Gomperts, B. Mennucci, H.P. Hratchian, J.V. Ortiz, A.F. Izmaylov, J.L. Sonnenberg, D. Williams-Young, F. Ding, F. Lipparini, F. Egidi, J. Goings, B. Peng, A. Petrone, T. Henderson, D. Ranasinghe, V.G. Zakrzewski, J. Gao, N. Rega, G. Zheng, W. Liang, M. Hada, M. Ehara, K. Toyota, R. Fukuda, J. Hasegawa, M. Ishida, T. Nakajima, Y. Honda, O. Kitao, H. Nakai, T. Vreven, K. Throssell, J.A. Montgomery, Jr., J. E. Peralta, F. Ogliaro, M.J.
25 Bearpark, J.J. Heyd, E.N. Brothers, K.N. Kudin, V.N. Staroverov, T.A. Keith, R. Kobayashi, J. Normand, K. Raghavachari, A.P. Rendell, J.C. Burant, S.S. Iyengar, J. Tomasi, M. Cossi, J.M. Millam, M. Klene, C. Adamo, R. Cammi, J.W. Ochterski, R.L. Martin, K. Morokuma, O. Farkas, J.B. Foresman, D.J. Fox, Gaussian 16, Revision B.01, Inc., Wallingford CT, 2016.
[25] W. Kohn, L. J. Sham, Phys. Rev. A. 140 (1965) 1133. [26] A. D. Becke, J. Chem. Phys. 98 (1993) 5648.
[27] C.T. Lee, W.T. Yang, R.G. Paar, Phys. Rev. B 37 (1988) 785.
[28] C.W. Bauschlicher, A. Ricca, H. Patridge, S.R. Langhoff, in D.P. Shong (Ed.) Recent Advances in Density Functional Methods, World Scientific, Singapore 1997 pp. 165-227 [29] L. Ferres, W. Stahl, I. Kleiner, H.V.L. Nguyen, J. Mol. Spectrosc. 343 (2018) 44. [30] L. Ferres, K.-N. Truong, W. Stahl, H.V.L. Nguyen, ChemPhysChem 19 (2018) 1781. [31] L. Ferres, J. Cheung, W. Stahl, H.V.L. Nguyen, J. Phys. Chem. A 123 (2019) 3497. [32] C. Møller, M.S. Plesset. Phys. Rev. 46 (1934) 618.
[33] J.-U. Grabow, W. Stahl, H. Dreizler, Rev. Sci. Instrum. 67 (1996) 4072. [34] M. Schnell, D. Banser, J.-U. Grabow, Rev. Sci. Instrum. 75 (2004) 2111. [35] J.M.L.J. Reinarts, A. Dymanus, Chem. Phys. Lett. 24 (1974) 346.
[36] Z. Kisiel, J. Kosarzewski, B.A. Pietrewicz, Chem. Phys. Lett. 325 (2000) 523.
[37] S. Khemissi, H.V.L. Nguyen, ChemPhysChem (2020). DOI: 10.1002/cphc.202000419 [38] Z. Kisiel, PROSPE-Programs for ROtationalSPEctroscopy, available at
http://info.ifpan.edu.pl/∼kisiel/prospe.htm.
[39] Z. Kisiel, B.A. Pietrewicz, F.W. Fowler, J. Phys. Chem. A 104 (2000) 6970. [40] J. Demaison, H.D. Rudolph, J. Mol. Spectrosc. 215 (2002) 78.
[41] J. Kraitchman, Am. J. Phys. 21 (1953) 17.
[42] C.C. Costain, Trans. Am. Crystallogr. Assoc. 2 (1966) 157. [43] Z. Kisiel, J. Mol. Spectrosc. 218 (2003) 58.
[44] L.W. Sutikdja, D. Jelisavac, W. Stahl, I. Kleiner, Mol. Phys. 110 (2012) 2883.
[45] L.W. Sutikdja, W. Stahl, V. Sironneau, H.V.L. Nguyen, I. Kleiner, Chem. Phys. Lett. 663, (2016) 145.
[46] T. Attig, L.W. Sutikdja, R. Kannengießer, I. Kleiner, W. Stahl, J. Mol. Spectrosc. 284–285 (2013) 8.
26 [48] T. Attig, R. Kannengießer, I. Kleiner, W. Stahl, J. Mol. Spectrosc. 298 (2014) 47.
[49] V. Van, T. Nguyen, W. Stahl, H.V.L. Nguyen, I. Kleiner, J. Mol. Struct. 1207 (2020) 127787.
[50] L. Ferres, W. Stahl, H.V.L. Nguyen, J. Chem. Phys. 151 (2019)104310. [51] K. Okuyama, N. Mikami, M. Ito, J. Phys. Chem. 89 (1985) 5617.
[52] T. Nguyen, V. Van, C. Gutlé, W. Stahl, M. Schwell, I. Kleiner, H.V.L. Nguyen, J. Chem. Phys. 152 (2020) 134306.
[53] A. Jabri, V. Van, H.V.L. Nguyen, W. Stahl, I. Kleiner, ChemPhysChem 17 (2016) 2660. [54] K.P.R. Nair, S. Herbers, A. Lesarri and J.-U. Grabow, J. Mol. Spectrosc. 361, (2019) 1. [55] T. Bruhn, H. Mäder, J. Mol. Spectrosc. 200 (2000) 151.
[56] C. Thomsen, H. Dreizler, Z. Naturforsch. 56a (2001) 635.
[57] A. Hellweg, C. Hättig, I. Merke, W. Stahl, J. Chem. Phys. 124 (2006) 204305.
[58] A.J. Shirar, D.S. Wilcox, K.M. Hotopp, G.L. Storck, I. Kleiner, B.C. Dian, J. Phys. Chem. A 114 (2010) 12187.
[59] H.V.L. Nguyen, J. Mol. Struct. 1208 (2020) 127909.
[60] R.A. Motiyenko, E.A. Alekseev, S.F. Dyubko, F.J. Lovas, J. Mol. Spectrosc. 240 (2006) 93. [61] Y. Jin, T. Lu, Q. Gou, G. Feng, J. Mol. Struct. 1205 (2020) 127632.


![Table 4. Experimental atom positions (substitution r s and semi-experimental r 0 structures) of 3FT obtained by isotopic substitutions with Kraitchman’s equations [40,41] as implemented in the programs KRA and STRFIT [43]](https://thumb-eu.123doks.com/thumbv2/123doknet/14742024.576791/18.918.29.907.480.840/experimental-positions-substitution-experimental-structures-substitutions-kraitchman-implemented.webp)
