HAL Id: hal-00301429
https://hal.archives-ouvertes.fr/hal-00301429
Submitted on 17 Sep 2004HAL is a multi-disciplinary open access
archive for the deposit and dissemination of sci-entific research documents, whether they are pub-lished or not. The documents may come from teaching and research institutions in France or abroad, or from public or private research centers.
L’archive ouverte pluridisciplinaire HAL, est destinée au dépôt et à la diffusion de documents scientifiques de niveau recherche, publiés ou non, émanant des établissements d’enseignement et de recherche français ou étrangers, des laboratoires publics ou privés.
Measurements in a highly polluted Asian mega city:
observations of aerosol number size distribution, modal
parameters and nucleation events
P. Mönkkönen, I. K. Koponen, K. E. J. Lehtinen, K. Hämeri, R. Uma, M.
Kulmala
To cite this version:
P. Mönkkönen, I. K. Koponen, K. E. J. Lehtinen, K. Hämeri, R. Uma, et al.. Measurements in a highly polluted Asian mega city: observations of aerosol number size distribution, modal parameters and nucleation events. Atmospheric Chemistry and Physics Discussions, European Geosciences Union, 2004, 4 (5), pp.5407-5431. �hal-00301429�
ACPD
4, 5407–5431, 2004
Measurements in a highly polluted Asian
mega city
P. M ¨onkk ¨onen et al.
Title Page Abstract Introduction Conclusions References Tables Figures J I J I Back Close
Full Screen / Esc
Print Version Interactive Discussion
© EGU 2004
Atmos. Chem. Phys. Discuss., 4, 5407–5431, 2004 www.atmos-chem-phys.org/acpd/4/5407/
SRef-ID: 1680-7375/acpd/2004-4-5407 © European Geosciences Union 2004
Atmospheric Chemistry and Physics Discussions
Measurements in a highly polluted Asian
mega city: observations of aerosol
number size distribution, modal
parameters and nucleation events
P. M ¨onkk ¨onen1, I. K. Koponen1, K. E. J. Lehtinen1, K. H ¨ameri1, 2, R. Uma3, and
M. Kulmala1
1
University of Helsinki, Department of Physical Sciences, Finland
2
Finnish Institute of Occupational Health, Helsinki, Finland
3
The Energy and Resources Institute (TERI), New Delhi, India
Received: 3 June 2004 – Accepted: 25 June 2004 – Published: 17 September 2004 Correspondence to: P. M ¨onkk ¨onen (petteri.monkkonen@helsinki.fi)
ACPD
4, 5407–5431, 2004
Measurements in a highly polluted Asian
mega city
P. M ¨onkk ¨onen et al.
Title Page Abstract Introduction Conclusions References Tables Figures J I J I Back Close
Full Screen / Esc
Print Version Interactive Discussion
© EGU 2004 Abstract
Diurnal variation of number size distribution (particle size 3–800 nm) and modal pa-rameters (geometric standard deviation, geometric mean diameter and modal aerosol particle concentration) in a highly polluted urban environment was investigated during October and November 2002 in New Delhi, India. Continuous monitoring for more than
5
two weeks with the time resolution of 10 min was conducted using a Differential Mobility Particle Sizer (twin DMPS). The results indicated clear increase in Aitken mode (25– 100 nm) particles during traffic peak hours, but towards the evenings there were more Aitken mode particles compared to the mornings. Also high concentrations of accumu-lation mode particles (>100 nm) were detected in the evenings only. In the evenings,
10
biomass/refuse burning and cooking are possible sources beside the traffic. We have also shown that nucleation events are possible in this kind of atmosphere even though as clear nucleation events as observed in rural sites could not be detected. The forma-tion rate of 3 nm particles (J3) of the observed events varied from 3.3 to 13.9 cm−3s−1 and the growth rate varied from 11.6 to 18.1 nmh−1 showing rapid growth and high
15
formation rate, which seems to be typical in urban areas.
1. Introduction
Numerous aerosol number size distribution and number concentration measurements has been conducted in urban environments in developed countries like United States, United Kingdom, Germany and Finland (H ¨ameri et al., 1996; Williams et al., 1998; Shi
20
et al., 2001; Woo et al., 2001; Wehner et al., 2002; Longley et al., 2003). The studies that have examined number size distribution or number concentration of aerosols in Asia, Latin America or Africa are very few (Baumgardner et al., 2000; Jayaratne and Verma, 2001; Mitra and Sharma, 2002; M ¨onkk ¨onen et al., 2004a; M ¨onkk ¨onen et al., 2004b) even though the air pollution problem is particularly serious in the mega cities
25
ACPD
4, 5407–5431, 2004
Measurements in a highly polluted Asian
mega city
P. M ¨onkk ¨onen et al.
Title Page Abstract Introduction Conclusions References Tables Figures J I J I Back Close
Full Screen / Esc
Print Version Interactive Discussion
© EGU 2004
(Bombay), Dhaka, Karachi, Bangkok, Beijing, Shanghai, Jakarta, and Manila are con-cerned to be one of the most polluted cities (Balsano et al., 2003; Faiz and Sturm, 2000). In India, most of the aerosol number size distribution measurements have been carried on Indian Ocean and Arabian Sea (de Reus et al., 2001; Kamra et al., 2003; Krishna et al., 2000; Krishna et al., 1997) and only short experiments at inland and
5
coastal stations have been performed (Murugavel and Kamra, 1999, Rao et al., 1999). The major source of particulate matter (PM) and air pollution in the South and East Asia region is due to rapid urbanization and increasing vehicle density (Faiz and Sturm, 2000). The emissions from internal combustion engines have been regulated solely on the basis of total PM emission even though ambient particulate matter can also be
10
characterized by other parameters like number concentration, mass size distribution, number size distribution and modality of size distribution. To comply with the current standards, vehicle and engine manufacturers have been improving engine designs, which have resulted in lowering of total PM emissions (Ristovski et al., 2000). Even though the total PM emission levels in urban atmosphere would decline, it will not
au-15
tomatically result in decrease in particulate number concentration and emissions of fine (Dp<1000 nm) and ultrafine particles (Dp<100 nm) since Compressed Natural Gas
(CNG) and diesel engines have been found to be the major source of these parti-cles (Ristovski et al., 2000; Ristovski et al., 1998; Kittelson, 1998). Hence we might speculate that applying CNG technology to transportation will not bring solution for the
20
level of fine and ultrafine particles in New Delhi’s atmosphere without regulating their emissions.
In India, atmospheric aerosols are also emitted from combustion of fossil fuels (e.g. coal and liquefied petroleum gas (LPG) and biofuel (e.g. wood, dunk-cake, crop waste) both in industrial and domestic sector. The biofuel combustion during 1996–1997
re-25
sulted in 2.04 Tg yr−1 of PM2.5emissions, equal to from fossil fuels. From fossil fuels, power plant were the primary source of PM2.5 emissions with a contribution of 79%, followed by 8% from brick-kilns, and 7% from diesel transport. Emissions from fossil fuel combustion are localized to large point sources (utilities, refineries and
petrochem-ACPD
4, 5407–5431, 2004
Measurements in a highly polluted Asian
mega city
P. M ¨onkk ¨onen et al.
Title Page Abstract Introduction Conclusions References Tables Figures J I J I Back Close
Full Screen / Esc
Print Version Interactive Discussion
© EGU 2004
icals, cement and fertilizers) and major cities while emissions from biofuel combustion are area sources spread all over India (Reddy and Venkataraman, 2002a, b). Traffic has observed to be one major primary source of nucleation mode (Dp<10 nm) particles
(Longley et al., 2003; Shi et al., 2001). The major source of ultrafine particles in New Delhi is also motor vehicle traffic (Mitra and Sharma, 2002). Vehicular population in
5
New Delhi has increased from 235 000 from 1975 to 2 629 000 in 1996. An estimate as high as 6 000 000 vehicles in year 2011 has been proposed by Ministry of Environment and Forest of India (Goyal and Krishna, 1998).
The main objective of this study is to determine the diurnal variation of number size distribution (3–800 nm), the total number concentration and the modal parameters of
10
urban background aerosols in highly polluted Asian mega city. For this purpose, New Delhi provided an ideal environment to complete this study. Also the formation of nu-cleation mode particles is studied. The formation of new particles has been observed at a number of sites around the world. However, there are much less experiments per-formed in urban than rural locations (Kulmala et al., 2004). One reason for this might
15
be that the formation of new particles in the urban atmosphere is expected to be far less favoured than in the rural atmosphere due to the high existing surface area for condensation of non-volatile materials needed for homogeneous nucleation. Also the identification of nucleation events is more difficult due to the large background particle concentrations (Alam et al., 2003).
20
2. Methods
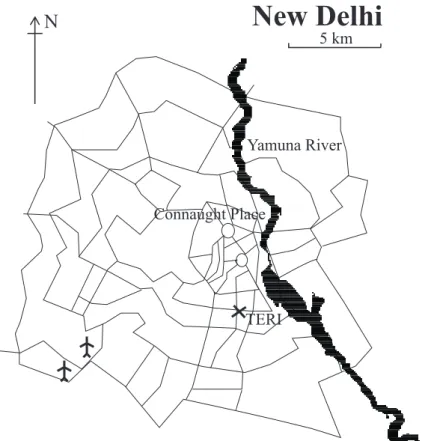
The field experiment was performed at India Habitat Centre (IHC/TERI) in New Delhi from 26 October to 9 November 2002. The measuring site located next to a traffic line in a residential area at the altitude of 15 m. The location of the site is shown in Fig. 1.
Aerosol number size distributions were measured over the size range 3–800 nm
us-25
ing a twin differential mobility particle sizer (DMPS). The twin DMPS system consists of two Vienna-type DMAs (lengths 11 and 28 cm; see Winklmayr et al., 1991), two CPCs,
ACPD
4, 5407–5431, 2004
Measurements in a highly polluted Asian
mega city
P. M ¨onkk ¨onen et al.
Title Page Abstract Introduction Conclusions References Tables Figures J I J I Back Close
Full Screen / Esc
Print Version Interactive Discussion
© EGU 2004
TSI 3025 (Stolzenburg and McMurry, 1991) and TSI 3010 (Quant et al., 1992). The DMAs were used for the electrical mobility diameter size classification of the particles and CPCs measured the total particle number concentration after the classification. The sheath air volume flow rates of the DMA’s were equal to 5.4 and 17.5 l/min cov-ering the subranges 3–10 nm and 10–800 nm. The time resolution for the whole size
5
range was 10 min. The sheath flows of DMAs were maintained using a closed sheath-air loop using critical orifices (Jokinen and M ¨akel ¨a, 1997). The relative humidities of the sheath flows were kept below 25% with dryers.
The DMPS system was placed in the fifth floor next to a window. The inlet tube was placed outside of the window so that the inlet was 15 m above the ground level and
10
0.5 m from the wall of the building.
The sample air was led through a vertically-placed, 60-mm steel tube with a total flow of 26.5 l/min. The sample was taken from the main flow and led to instruments trough a 30-cm-long stainless steel tube having a diameter of 6 mm. All the CPC’s and DMA’s were calibrated before the campaign. The calibration method has been described in
15
detail by Aalto et al. (2001).
We used the same data inversion and fitting procedure in our investigation as M ¨akel ¨a et al. (2000) in their analysis of typical continental air masses in Southern Finland. In our analysis we also describe the aerosol size distribution by a few well chosen param-eters. These parameters are the geometric mean diameter (GMD), the geometrical
20
standard deviation (σ) and the modal aerosol particle concentration (N).
The weather conditions were stable during whole experiment. Days were sunny, but hazy, and no rain was observed. Diurnal maximum and minimum temperature and relative humidity is presented in the Table 1.
ACPD
4, 5407–5431, 2004
Measurements in a highly polluted Asian
mega city
P. M ¨onkk ¨onen et al.
Title Page Abstract Introduction Conclusions References Tables Figures J I J I Back Close
Full Screen / Esc
Print Version Interactive Discussion
© EGU 2004
3. Results and discussion
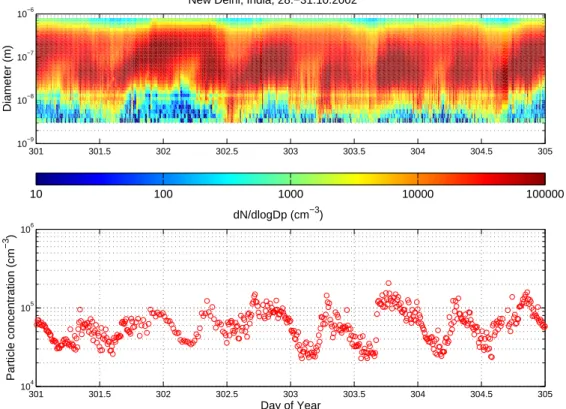
3.1. Diurnal variations of the number size distribution and the number concentration Figure 2 presents the measured particle size distribution (Fig. 2a) and the number con-centration (Fig. 2b) from 28 October to 31 October 2002. These selected days presents typical variations both in particle size distribution and number concentration of New
5
Delhi’s climate during the measuring period. The number size distribution changes and the number concentration increases during the morning traffic peak hour (07:00– 09:00 a.m.) and again in the evenings (06:00–10:00 p.m.). Similar changes in the aerosol particle number concentrations were obtained also during different seasons (M ¨onkk ¨onen et al., 2004a). It is evident that the evening peak hour is also influenced
10
by the traffic, but as we can see from Fig. 2a, the number size distribution differs be-tween the morning and the evening. Especially during the day of year 303 and 304 we clearly are able to see that there were less Aitken mode (25–100 nm) particles at morning compared to the evening. From Figs. 2a and 2b we are also able to see a large background aerosol population in New Delhi. During the measuring period the
15
aerosol number concentration varied between 20000 (4 November, 03:00 p.m.) to 250 000 particles cm−3 (6 November, 08:00 a.m.). A highest measured 24-h average was (6.28±1.78) ×104cm−3. This average was more than two times higher compared results measured by Shi et al. (1999) at roadside in UK and almost five times higher compared to average measured in three communities in East Germany between 1993
20
and 1999 (Pitz et al., 2001).
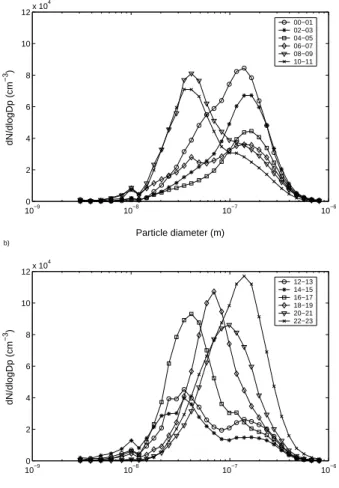
Figure 3 presents selected diurnal number size distributions (1 h mean) on 28 Oc-tober 2002. Figure 3a presents the size distributions before noon and Fig. 3b after noon. From Fig. 3a we can clearly see the increase in Aitken mode particles during traffic peaks hours (07:00–09:00 a.m.). During this day the concentration of Aitken
25
mode particles remained almost the same level even between 10:00–11:00 a.m. After this point, the concentration of Aitken mode particles decreased until the concentration increased again after 04:00 p.m. Towards the evening the geometric mean
diame-ACPD
4, 5407–5431, 2004
Measurements in a highly polluted Asian
mega city
P. M ¨onkk ¨onen et al.
Title Page Abstract Introduction Conclusions References Tables Figures J I J I Back Close
Full Screen / Esc
Print Version Interactive Discussion
© EGU 2004
ter (GMD) of the particles increased so that at 10:00–11:00 p.m. there were a lot of accumulation mode (Dp>100 nm) particles in the atmosphere. During the whole
mea-suring period, high concentrations of accumulation mode particles were detected in the evenings only. Also in the evenings there were more Aitken mode particles compared to the mornings. Hence, there must be also another source at evenings, which beside
5
the traffic, which is frequently repeated every day. 3.2. Diurnal variations of modal parameters
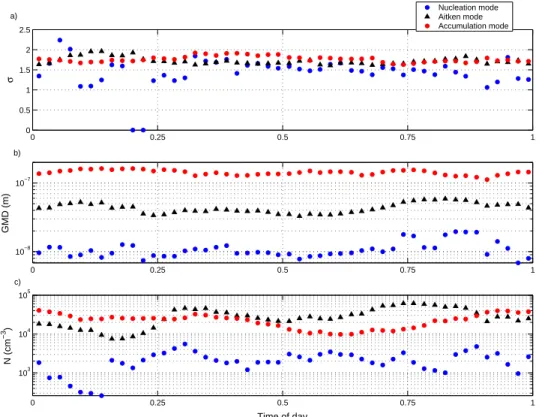
Table 2 summarizes the calculated arithmetic mean (30 min) and Figs. 4a–4c present the calculated geometric mean (30 min) of the diurnal variations of modal parameters for each mode obtained from the fitting procedure. Figure 4a presents the σ, Fig. 4b
10
the GMD and the Fig. 4c the aerosol particle concentration. The most clear diurnal variation of the parameters can be seen in Fig. 4c. A clear increase of Aitken mode particles before 06:00 a.m. (7500 cm−3, at 04:00 a.m.) continuing close to 07:30 a.m. is observed. At the same time also the number concentration of nucleation mode increased. After this point the number concentration of both modes decreased until the
15
concentration of Aitken mode increased again after 02:00 p.m. continuing to 06:00 p.m. reaching the concentration almost 60 000 cm−3. The concentration of accumulation mode particles varied from 10 000 (at 03:00 p.m.) to 40 000 (at 00:15 a.m.) cm−3. A slight increase of accumulation mode particles was observed at mornings (07:00– 08:00 a.m.) and more clear increase at evenings (06:00–10:30 p.m.).
20
There are several possible sources in New Delhi from where these particles are emitted to atmosphere. Firstly, the diurnal variations of the number concentration of Aitken mode particles at mornings and evenings indicate that these particles could be emitted from traffic. Ristovski et al. (1998) measured a typical number size distribution in the range of 15–750 nm (GMD close to 40 nm) for the unleaded gasoline engine and
25
for the CNG engine in the range of 15–200 nm (GMD of 59 nm) (Ristovski et al., 2000). In New Delhi, CNG technology is widely used in buses, taxis and auto-rickshaws since the Supreme Court of India ordered on 28 July 1998, that entire city bus fleet to be
ACPD
4, 5407–5431, 2004
Measurements in a highly polluted Asian
mega city
P. M ¨onkk ¨onen et al.
Title Page Abstract Introduction Conclusions References Tables Figures J I J I Back Close
Full Screen / Esc
Print Version Interactive Discussion
© EGU 2004
steadily converted to single fuel mode on CNG by 31 March 2001 (Dursbeck et al., 2001).
Secondly, we might speculate that the traffic was not the only source of these parti-cles. The maximum GMD of Aitken mode particles was higher at evenings (60 nm at 08:00 p.m.) than at mornings (40 nm between 06:00–08:00 a.m.). The GMD could
5
increase at evenings as a result of burning biomass and refuse. This speculation is supported both by Pagels et al. (2003) and Sharma et al. (2003). Pagels et al. (2003) found unimodal number size distribution when combusting moist forest residue. The GMD of the number concentration varied between 85–110 nm. Hence, it is possible that biomass burning increased the GMD at evenings in New Delhi. A very
interest-10
ing result was found by Sharma et al. (2003). They analyzed chemical composition of organic species present in PM10 collected exactly at the same site as our DMPS measurements were conducted. Their study suggests that vehicular emissions and biomass and/or refuse burning are significant contributors to the organic fraction of PM10 in New Delhi’s atmosphere.
15
Other possible sources beside vehicular emissions and/or refuse burning at evenings in New Delhi could be cooking. Few studies indicate that cooking with gas/LPG has a significant contribution to indoor number concentration levels (Dennekamp et al., 2001; M ¨onkk ¨onen et al., in preparation1). In New Delhi, LPG and burning biomass/other fossil fuels are the only form of cooking. Hence, the impact of cooking to the ambient air
20
quality can not neglect while speculating the aerosol (Dp<1000 nm) emissions in New Delhi.
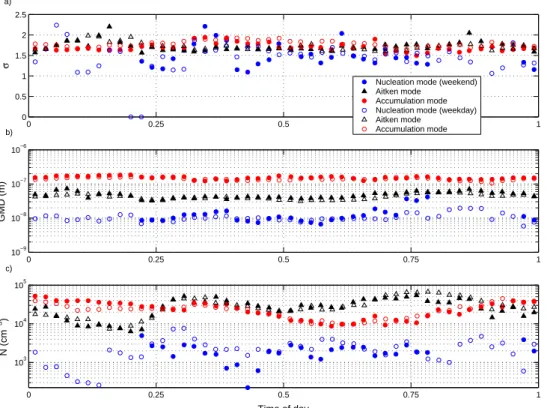
Figures 5a–5c present the calculated geometric mean (30 min) of the diurnal varia-tions of modal parameters for each mode in weekends and weekdays. There seems to be only a slight difference in modal parameters between the weekends and
week-25
days during the measuring period. Since the measuring period was very short, a final 1
M ¨onkk ¨onen, P., Pai, P., Maynard, A., Lehtinen, K. E. J., Lehtinen, K. E. J., H ¨ameri, K., Andresen, P., Ramachandran, G., Prasad, B., and Kulmala, M.: Fine particle number and mass concentration measurements in urban Indian household, in preparation
ACPD
4, 5407–5431, 2004
Measurements in a highly polluted Asian
mega city
P. M ¨onkk ¨onen et al.
Title Page Abstract Introduction Conclusions References Tables Figures J I J I Back Close
Full Screen / Esc
Print Version Interactive Discussion
© EGU 2004
conclusion of the variations between the weekends and weekdays can not be given. 3.3. Observations of nucleation mode particle formation
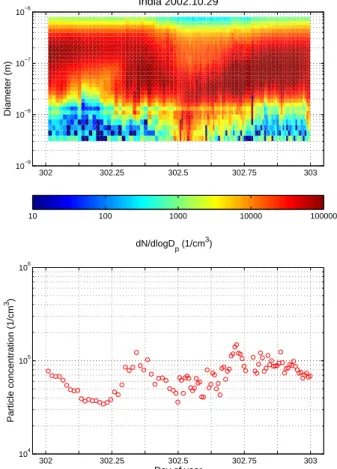
Two examples of event days, 28 and 29 October 2002, are highlighted in Figs. 6 and 7, in which the evolution of the size distribution and total number concentration is shown as a function of time. New particles appear at the lower end of the size spectrum at
5
3 nm around noon, and grow rapidly thereafter. These can be used to analyze useful features of the events, such as particle formation and growth rates.
Table 3 summarizes the observed nucleation events during the measuring campaign. The table presents the starting time of the event, event class (see M ¨akel ¨a et al., 2000b), calculated particle formation rate for 3 nm particles (J3), growth rate (GR, see Kulmala
10
et al., 2001), condensation sink (CS, see Kulmala et al., 2001) as well the concentra-tion of condensable vapour C and their source rate (Q, see Kulmala et al., 2001) and concentrations of SO2and NO2. CS and the concentration of SO2and NO2are given from the starting time of the event. The events are classified in three different classes (M ¨akel ¨a et al., 2000a). During the measuring period we observed eight events.
15
Most of the events are classified as class 3 type events. This means that even though the event could be detected, the formation and growth of nucleation mode particles are disturbed by high aerosol background concentration. All events occurred usually at noon or afternoon when the solar radiation is most intensive. Similar event starting times were also observed in Atlanta (Woo et al., 2001). It is important to note that the
20
event start when the condensation sink is in its minimum.
The formation rate varies from 3.3 to 13.9 cm−3s−1which are similar magnitude with formation rates observed in Atlanta (Kulmala et al., 2004). The Q value is significantly higher (about 100 times) than in the rural forest in Hyyti ¨al ¨a, Finland. Also the growth rate and C are around 5 times higher and CS around 20 times higher than in Hyyti ¨al ¨a
25
(Kulmala et al., 2001; Kulmala et al., 2004). This shows that in polluted urban envi-ronment high source rates of condensable vapours are necessary that the result of aerosol dynamical competition between condensation growth of coagulation sink is a
ACPD
4, 5407–5431, 2004
Measurements in a highly polluted Asian
mega city
P. M ¨onkk ¨onen et al.
Title Page Abstract Introduction Conclusions References Tables Figures J I J I Back Close
Full Screen / Esc
Print Version Interactive Discussion
© EGU 2004
significant growth.
Unfortunately clear results on the connection between different trace gases and new particle formation cannot be achieved from our data set. The SO2 and NO2 concen-trations were relatively high during the whole campaign. Since the time resolution to measure these gases was 4 h, conclusions of their role in formation and growth of
nu-5
cleation mode particles in New Delhi can not be made. However, the sulphuric acid might play a significant role in urban conditions (see also Kulmala et al., 2004).
4. Conclusions
In this study we have for the first time presented the diurnal variation of the number size distribution (3–800 nm) and the modal parameters of urban background aerosols
10
in a highly polluted Asian mega city.
We have also shown that nucleation events are possible in this kind of atmosphere event though as clear nucleation events as observed in rural sites could not be de-tected. The formation rate (J3) of the observed events varied from 3.3 to 13.9 cm−3s−1 and the growth rate varied from 11.6 to 18.1 nmh−1 showing rapid growth and high
15
formation rate, which seems to be typical in urban areas (Kulmala et al., 2004). In the case of every observed event, the condensation sink was at minimum during event starting time. The source of condensable vapour molecules is seen to be 100 times higher than corresponding source in rural area (Kulmala et al., 2001). This shows that the formation of new secondary aerosol particles in polluted urban environment is
pos-20
sible, but requires high vapour sources in order to be able to overcome high coagulation sink.
The analysis of diurnal modal parameters revealed that there is also another source in the evenings, which beside the traffic is frequently repeated every day. Based on this study and the study conducted by Sharma et al. (2003), vehicular emissions
to-25
gether with biomass and/or refuse burning has significant contribution to New Delhi’s atmosphere. Also the impact of cooking and new particle formation can not be
ne-ACPD
4, 5407–5431, 2004
Measurements in a highly polluted Asian
mega city
P. M ¨onkk ¨onen et al.
Title Page Abstract Introduction Conclusions References Tables Figures J I J I Back Close
Full Screen / Esc
Print Version Interactive Discussion
© EGU 2004
glected. Because the measuring campaign was short, only a slight difference in modal parameters between the weekends and weekdays was detected.
References
Aalto, P., H ¨ameri, K., Becker, E., Weber, R., Salm, J., M ¨akel ¨a, J. M., Hoell, C., O’Dowd, C. D., Karlsson, H., Hansson, H.-C., V ¨akev ¨a, M., Koponen, I. K., Buzorius, G. and Kulmala, M.:
5
Physical characterization of aerosol particles during nucleation events, Tellus, Ser. B, 53, 3440–358, 2001.
Alam, A., Shi Ping, J., and Harrison, R.: Observations of new particle formation in urban air, J. Geophys. Res., 108, D3, doi:10.1029/2001/JD001417, 2003.
Baumgartner, D., Raga, G. B., Kok, G., Ogren, J., Rosas, I., Baez, A., and Novakov, T.: On the
10
evolution of aerosol properties at a mountain site above Mexico City, J. Geophys. Res., 105, D17, 22 243–22 253, 2000.
Baldasano, J. M., Valera, E., and Jim ´enez, P.: Air quality data from large cities, The Science of the Total Environment, 307, 1–3, 141–165, 2003.
Dennekamp, M., Howarth, S., Dick, C. A. J., Cherrie, J. W., Donaldson, K., and Seaton, A.:
15
Ultrafine particles and nitrogen oxides generated by gas and electric cooking, Occupational Environmental Medicine 58, 511–516, 2001.
de Reus, M., Krejci, R., Williams, J., Fischer, H., Scheele, R., Str ¨om, J.: Vertical and horizontal distributions of the aerosol number concentration and size distribution over the northern Indian Ocean, J. Geophys. Res., 106, D22, 28 629–28 641, 2001.
20
Dursbeck, F., Erlandsson L., and Weawer C.: Status of implementation of CNG as a fuel for ur-ban buses in Delhi, Centre for Science and Environment, New Delhi,http://www.cleanairnet.
org/caiasia/1412/propertyvalue-14418.html, 2001.
Faiz, A. and Sturm, P. J.: New Directions: Air pollution and road traffic in developing countries, Atmos. Env., 34, 27, 4745–4746, 2000.
25
Goyal P. and Krishna T. V. B. P. S. R.: Various methods of emission estimation of vehicular traffic in Delhi, Transps Res.-D, 31, 5, 309–317, 1998.
H ¨ameri, K., Kulmala, M., Aalto, P., Leszczynski, K., Visuri, R., and H ¨amekoski, K.: The investi-gations of aerosol particle formation in urban background area in Helsinki, Atmos. Res., 41, 281–298, 1996.
ACPD
4, 5407–5431, 2004
Measurements in a highly polluted Asian
mega city
P. M ¨onkk ¨onen et al.
Title Page Abstract Introduction Conclusions References Tables Figures J I J I Back Close
Full Screen / Esc
Print Version Interactive Discussion
© EGU 2004
Jayaratne, E. R. and Verma, T. S.: The impact of biomass burning on the nvironmental aerosol concentration in Gaborone, Botswana, Atmos. Env., 35, 10, 1821–1828, 2001.
Jokinen, V., and M ¨akel ¨a, J. M.: Closed loop arrangement with critical orifice for DMA sheath/excess flow system. J. Aerosol Sci. 28, 643–648, 1997.
Kamra, A. K., Murugavel, P., and Pawar S. D.: Measured size distribution of aerosols over Indian
5
Ocean during INDOEX, J. Geophys. Res., 108, D3, 8000, doi:10.1029/2002JD002200, 2003. Kittelson, D. B.: Engines and Nanoparticles: A Review, J. Aros. Sc., 29, 5/6, 575–588, 1998. Krishna Moorthy, K. and Saha, A.: Aerosol study during INDOEX: observation of enhanced
aerosol activity over the Mid Arabian Sea during the northern winter, J. Atmos. Sol.-Terr. Phys. 62, 65–72, 2000.
10
Krishna Moorthy, K., Satheesh, S. K., and Krishamurthy, B. V.: Investigation of marine aerosols over the tropical Indian Ocean, J. Geophys. Res. 102, 18 827–18 842, 1997.
Kulmala, M., Maso, Dal M., M ¨akel ¨a, J. M., Pirjola, L., V ¨akev ¨a, M., Aalto, P., Miikkulainen, P., H ¨ameri, K. and O’Dowd, C. D.:. On the formation, growth and composition of nucleation mode particles, Tellus, 53B, 479–490, 2001.
15
Kulmala, M., Vehkam ¨aki, H., Pet ¨aj ¨a,T., Maso, Dal M., Lauri, A., Kerminen V.-M., Birmili, W., and McMurry, P. H.: Formation and growth rates of ultrafine atmospheric particles: a review of observations, J. Aeros. Sc., 35, 143–176, 2004.
Longley, I. D., Gallagher, M. W., Dorsey, J. R., Flynn, M., Allan, J. D., Alfarra, M. R. and Inglis, D.: A case study of aerosol (4.6 nm<Dp<10 nm) number and mass size distribution
mea-20
surements in a busy street canyon in Manchester, UK, Atmosph. Env., 37, 2, 1563–1571, 2003.
Mitra, A. P. and Sharma, C.: Indian aerosols: present status. Chemosphere 49, 1175–1190, 2002.
Murugavel, P., and Kamra, A. K.: Changes in the concentration and size distribution of the
25
sub-micron particles associated with the sea- and land-breezes at a coastal station. Current Science (Indian Academy of Science), 76, 7, 994–997, 1999.
M ¨onkk ¨onen, P., Uma, R., Srinivasan, D., Koponen, I. K., Lehtinen, K. E. J., H ¨ameri, K., Suresh, R., Sharma, V. P., and Kulmala, M.: Relationship and variations of aerosol number and PM10 mass concentrations in a highly polluted urban environment, Atmos. Env., 38, 425–433,
30
2004a.
M ¨onkk ¨onen, P., Koponen, I. K., Lehtinen, K. E. J., Uma, R., Srinivasan, D., H ¨ameri, K., and Kulmala, M.: Death of nucleation and Aitken mode particles: Observations at extreme
atmo-ACPD
4, 5407–5431, 2004
Measurements in a highly polluted Asian
mega city
P. M ¨onkk ¨onen et al.
Title Page Abstract Introduction Conclusions References Tables Figures J I J I Back Close
Full Screen / Esc
Print Version Interactive Discussion
© EGU 2004
spheric conditions and their theoretical explanation, J. Aeros. Sc., accepted, 2004b.
M ¨akel ¨a, J. M., Koponen, I. K., Aalto, P., Kulmala, M.: One-year data of submicron size modes of tropospheric background aerosol in southern Finland, J. Aeros. Sc., 31, 595–611, 2000a. M ¨akel ¨a, J. M., Dal Maso, M., Pirjola, L., Keronen, P., Laakso, L., Kulmala, M., and Laaksonen, A.: Characteristics of the atmospheric particle formation events observed at a boreal forest
5
site in southern Finland, Boreal Environment Science, 5, 299–313, 2000b.
Pagels, J., Strand, M., Rissler, J., Szpila, A., Gudmundsson, A., Bohgard, M., Lillieblad, L., Sanati, M. and Swietlicki, E.: Characteristics of aerosol particles formed during grate com-bustion of moist forest residue, J. Aeros. Sc., 34, 1043–1059, 2003.
Pitz, M., Kreying, W. G., H ¨olscher, B., Cyrys, J., Wichmann, H. E., and Heinrich, J.: Change of
10
the ambient particle size distribution in East Germany between 1993 and 1999, Atmos. Env., 35, 4357–4366, 2001.
Quant, F. R., Caldow, R., Sem, G. J., and Addison, T. J.: Performance of condensation particle counters with three continuous-flow designs, J. Aeros. Sc., 23, 1, 1992, 405–408, 1992. Reddy, M. S. and Venkataraman, C.: Inventory of aerosol and sulphur dioxide emissions from
15
India: Part I – Fossil fuel combustion, Atmos. Env., 36, 677–697, 2002a.
Reddy, M. S. and Venkataraman, C.: Inventory of aerosol and sulphur dioxide emissions from India: Part II – Biomass combustion, Atmos. Env., 36, 699–712, 2002b.
Ristovski, Z. D., Morawska, L., Hitchins, J., Thomas, S., Greenaway, C., and Gilbert, D.: Particle emissions from compressed natural gas engines, J. Aeros. Sc., 31, 403–413, 2000.
20
Ristovski, Z. D., Morawska, L., Bofinger, N., and Hitchins, J.: Submicrometer and supermi-crometer particulate emission from spark ignition vehicles, Env. Sc. Techn., 32, 3845–3852, 1998.
Rao, P. S. P., Momin, A. G., Safai, P. D., Ali, K., Naik, M. S., and Pillai, A. G.: Studies of trace gases and Aitken Nucle at inland and coastal stations – A part of INDOEX proramme,
25
Current Science (Indian Academy of Science), 76, 7, 981–984, 1999.
Sharma, D. N., Sawant, A. A., Uma, R., and Cokker III, D.R.: Preliminary chemical charac-terization of particle-phase organic compounds in New Delhi, Atmos. Env., 37, 4317–4323, 2003.
Shi, J. P., Evans, D. E., Khan, A. A., and Harrison, R. M.: Sources and concentration of
nanopar-30
ticles (<10 nm in diameter) in the urban atmosphere, Atmos. Env., 35, 1193–1202, 2001. Shi, J. P., Khan, A. A., and Harrison, R. M.: Measurements of ultrafine particle concentration
ACPD
4, 5407–5431, 2004
Measurements in a highly polluted Asian
mega city
P. M ¨onkk ¨onen et al.
Title Page Abstract Introduction Conclusions References Tables Figures J I J I Back Close
Full Screen / Esc
Print Version Interactive Discussion
© EGU 2004
51–64, 1999.
Stolzenburg, M. R. and McMurry, P. H.: An ultrafine aerosol condensation nucleus counter, Aerosol Sci. and Technol., 14, 48–65, 1991.
Wehner, B. and Wiedensohler, A.: Long term measurements of submicrometer urban aerosols: statistical analysis for correlations with meteorological conditions and trace gases, Atmos.
5
Chem. Phys. Discuss., 2, 1699–1733, 2002.
Williams, P. I., Choularton, T. W., Gallagher, M., Coe, W. H., and Bower, K. N.: Results of monitoring ultra-fine, fine and accumulation mode particles above an urban canyon within the city of Manchester, J. Aero. Sc., 29, S593–S594, 1998.
Winklmayr, W., Reischl, G. P., Lindner, A. O., and Berner, A.: A new electromobility
spectrome-10
ter for the measurement of aerosol size distributions in the size range from 1 to 1000 nm, J. Aerosol Sci., 22, 289–296, 1991.
Woo, K. S., Chen, D. R., Pui, D. Y. H., and McMurry, P. H.: Measurements of Atlanta Aerosol Size Distributions: Observations of Ultrafine Particle Events, Aeros. Sc. Techn., 34, 75–87, 2001.
ACPD
4, 5407–5431, 2004
Measurements in a highly polluted Asian
mega city
P. M ¨onkk ¨onen et al.
Title Page Abstract Introduction Conclusions References Tables Figures J I J I Back Close
Full Screen / Esc
Print Version Interactive Discussion
© EGU 2004 Table 1. Diurnal maximum and minimum temperature and relative humidity during the
measur-ing period.
Date Day of year
max
T (°C) Tmin (°C) RHmax (%) RHmin (%)
25.10.02 298 31 17 81 35 26.10.02 299 32 17 80 35 27.10.02 300 32 17 86 35 28.10.02 301 32 16 90 35 29.10.02 302 33 16 92 39 30.10.02 303 32 19 88 41 31.10.02 304 32 18 89 41 1.11.02 305 31 17 92 39 2.11.02 306 31 16 91 36 3.11.02 307 32 16 86 34 4.11.02 308 - - - - 5.11.02 309 30 15 - - 6.11.02 310 29 16 90 42 7.11.02 311 29 16 92 47 8.11.02 312 28 15 93 47 9.11.02 313 - - - -
ACPD
4, 5407–5431, 2004
Measurements in a highly polluted Asian
mega city
P. M ¨onkk ¨onen et al.
Title Page Abstract Introduction Conclusions References Tables Figures J I J I Back Close
Full Screen / Esc
Print Version Interactive Discussion
© EGU 2004 Table 2. Diurnal arithmetic averages of the nine size distribution parameters obtained from the
fitting procedure. The standard deviation of each quantity is given is parentheses. Nucleation mode Aitken mode Accumulation mode Time of day GMD (nm) Ntot (
3 cm−) σ GMD (nm) Ntot ( 3 cm−) σ GMD (nm) Ntot ( 3 cm−) σ 0.0128 2.7 (4.5) 587 (1130) 0.4 (0.6) 43.7 (7.5) 19924 (9766) 1.6 (0.2) 138.0 (16.2) 41762 (10278) 1.8 (0.1) 0.0335 3.6 (6.0) 352 (709) 0.5 (0.9) 44.2 (7.1) 18727 (6160) 1.7 (0.2) 142.5 (17.4) 38682 (9461) 1.8 (0.1) 0.0544 3.5 (6.2) 736 (2091) 0.7 (1.3) 50.2 (12.1) 16978 (5903) 1.8 (0.2) 150.7 (21.0) 35210 (9491) 1.7 (0.1) 0.0751 1.4 (3.3) 254 (934) 0.4 (1.1) 52.2 (13.5) 15515 (5779) 1.9 0.3) 154.0 (19.3) 31782 (10425) 1.7 (0.2) 0.0958 1.5 (3.5) 95 (319) 0.2 (0.4) 55.2 (17.0) 14537 (8605) 1.9 (0.3) 161.9 (19.8) 28895 (12545) 1.7 (0.1) 0.1165 2.0 (4.3) 114 (336) 0.2 (0.4) 52.0 (17.6) 14059 (7779) 2.0 (0.4) 160.2 (17.9) 27715 (9950) 1.7 (0.1) 0.1378 1.6 (3.3) 102 (307) 0.2 (0.6) 54.9 (20.2) 10772 (6437) 2.0 (0.4) 163.4 (18.7) 26443 (9019) 1.7 (0.1) 0.1585 1.9 (4.0) 690 (2167) 0.3 (0.7) 46.0 (16.2) 8264 (3634) 1.9 (0.5) 158.1 (20.1) 27936 (6829) 1.7 (0.1) 0.1794 2.6 (6.2) 442 (1246) 0.3 (0.7) 47.2 (16.3) 8471 (4275) 1.9 (0.4) 161.8 (17.5) 26443 (6814) 1.7 (0.1) 0.2004 2.5 (6.7) 308 (870) 0.2 (0.6) 48.3 (16.9) 9874 (5458) 2.0 (0.3) 163.7 (20.3) 25471 (5140) 1.7 (0.1) 0.2212 2.0 (3.6) 969 (2193) 0.3 (0.6) 36.9 (10.0) 12714 (7206) 1.8 (0.2) 160.6 (20.0) 25831 (5732) 1.8 (0.2) 0.2416 2.4 (4.0) 1756 (4744) 0.3 (0.6) 34.9 (9.2) 17431 (11313) 1.7 (0.2) 153.1 (30.1) 25779 (4048) 1.8 (0.2) 0.2629 2.4 (3.9) 1181 (2802) 0.4 (0.6) 35.3 (6.5) 27356 (13821) 1.7 (0.2) 158.1 (20.7) 24914 (4935) 1.8 (0.2) 0.2835 2.5 (4.1) 1644 (3285) 0.4 (0.6) 38.1 (8.2) 46515 (20914) 1.7 (0.2) 154.5 (22.2) 24859 (5550) 1.8 (0.2) 0.3046 2.9 (4.9) 1733 (3135) 0.4 (0.7) 40.4 (6.5) 53314 (25958) 1.7 (0.2) 151.2 (36.7) 27683 (9581) 1.8 (0.3) 0.3250 4.4 (6.0) 2057 (3836) 0.7 (1.0) 39.3 (4.6) 50011 (29021) 1.6 (0.2) 131.6 (30.0) 36601 (17991) 1.9 (0.3) 0.3460 4.2 (6.1) 1243 (2214) 0.7 (0.9) 39.0 (5.6) 52352 (33900) 1.7 (0.1) 140.1 (39.0) 34254 (17833) 1.9 (0.3) 0.3669 6.6 (7.2) 1320 (1649) 1.0 (1.1) 42.1 (6.1) 40598 (18768) 1.7 (0.1) 146.0 (34.4) 28321 (9769) 1.9 (0.2) 0.3878 6.6 (6.9) 1148 (1527) 1.0 (1.2) 41.3 (7.6) 38004 (15372) 1.7 (0.1) 137.9 (29.2) 27941 (11304) 1.9 (0.2) 0.4086 6.1 (5.4) 1633 (2297) 0.9 (0.8) 40.1 (8.9) 32915 (16132) 1.7 (0.2) 132.2 (30.5) 27607 (13676) 1.9 (0.3) 0.4295 6.9 (5.5) 1311 (1488) 1.2 (0.9) 39.1 (5.2) 32543 (13493) 1.7 (0.1) 130.7 (19.2) 25008 (9644) 1.9 (0.2) 0.4501 7.2 (5.4) 1821 (1992) 1.2 (0.9) 39.7 (4.9) 28021 (12174) 1.7 (0.1) 135.8 (22.1) 20760 (8884) 1.9 (0.2) 0.4709 7.4 (5.4) 1823 (2362) 1.2 (0.9) 38.3 (7.1) 25454 (10031) 1.7 (0.1) 138.8 (24.1) 19548 (8618) 1.9 (0.3) 0.4912 7.8 (4.1) 1839 (1458) 1.4 (0.8) 35.5 (6.1) 23793 (10607) 1.7 (0.1) 138.7 (29.8) 17662 (5806) 1.9 (0.2) 0.5130 9.0 (4.2) 4191 (4720) 1.5 (0.5) 35.3 (5.1) 23194 (9373) 1.7 (0.2) 139.9 (27.6) 14559 (5887) 1.8 (0.2) 0.5337 7.0 (3.9) 4254 (6378) 1.3 (0.7) 33.6 (6.7) 27622 (12522) 1.7 (0.3) 145.2 (27.0) 13351 (6052) 1.8 (0.3)
ACPD
4, 5407–5431, 2004
Measurements in a highly polluted Asian
mega city
P. M ¨onkk ¨onen et al.
Title Page Abstract Introduction Conclusions References Tables Figures J I J I Back Close
Full Screen / Esc
Print Version Interactive Discussion
© EGU 2004 Table 2. Continued.
Nucleation mode Aitken mode Accumulation mode Time of day GMD (nm) Ntot (
3 cm−) σ GMD (nm) Ntot ( 3 cm−) σ GMD (nm) Ntot ( 3 cm−) σ 0.5545 8.5 (4.8) 3004 (3883) 1.4 (0.5) 35.7 (9.8) 31473 (15458) 1.8 (0.3) 152.8 (27.4) 12147 (5812) 1.7 (0.2) 0.5748 8.4 (4.2) 7145 (15859) 1.4 (0.5) 36.2 (9.1) 29268 (16450) 1.6 (0.1) 145.4 (29.4) 12281 (4894) 1.8 (0.2) 0.5952 9.0 (3.5) 7908 (17993) 1.6 (0.6) 35.4 (7.9) 28117 (15039) 1.6 (0.2) 149.0 (29.7) 10713 (4133) 1.8 (0.2) 0.6155 9.0 (3.9) 6028 (14031 1.6 (0.6) 36.7 (9.9) 30010 (13237) 1.7 (0.2) 148.4 (25.1) 10211 (3050) 1.8 (0.2) 0.6375 10.3 (6.6) 4087 (6427) 1.4 (0.6) 37.9 (12.1) 35243 (15728) 1.7 (0.2) 145.3 (23.6) 10501 (3688) 1.8 (0.2) 0.6580 10.0 (5.5) 2425 (1770) 1.4 (0.5) 39.1 (12.1) 36056 (14364) 1.7 (0.2) 134.9 (22.6) 11904 (4433) 1.8 (0.2) 0.6792 8.7 (6.5) 1917 (2293) 1.0 (0.7) 42.4 (14.0) 45419 (16543) 1.6 (0.1) 135.7 (26.7) 14857 (10222) 1.8 (0.3) 0.7001 5.8 (7.5) 1117 (1516) 0.8 (0.9) 44.8 (11.9) 57499 (22525) 1.6 (0.1) 147.6 (28.9) 14165 (7191) 1.7 (0.3) 0.7208 5.3 (8.2) 1177 (1798) 0.6 (0.8) 48.3 (11.2) 60905 (28698) 1.7 (0.1) 154.5 (24.2) 13017 (5204) 1.7 (0.2) 0.7414 7.4 (11.8) 2483 (8344) 0.5 (0.7) 54.0 (11.9) 66914 (27873) 1.7 (0.1) 155.1 (23.4) 14567 (6010) 1.6 (0.2) 0.7618 8.4 (12.8) 839 (1112) 0.7 (0.9) 56.7 (12.4) 67317 (32073) 1.7 (0.1) 157.9 (28.6) 15990 (7612) 1.7 (0.2) 0.7830 3.5 (7.8) 394 (813) 0.4 (0.7) 58.4 (11.0) 65126 (28913) 1.7 (0.1) 154.2 (33.4) 20318 (14157) 1.7 (0.2) 0.8043 3.1 (7.4) 363 (926) 0.3 (0.6) 58.1 (11.3) 61064 (23910) 1.7 (0.1) 144.4 (34.8) 28379 (19539) 1.7 (0.2) 0.8251 4.9 (10.2) 662 (2004) 0.4 (0.7) 60.5 (13.8) 55963 (26333) 1.8 (0.2) 135.5 (36.6) 32127 (21381) 1.7 (0.2) 0.8459 4.2 (10.5) 863 (2477) 0.3 (0.6) 58.9 (14.8) 61053 (33866) 1.8 (0.2) 128.8 (26.9) 36038 (23082) 1.7 (0.2) 0.8661 1.7 (5.6) 436 (1892) 0.1 (0.4) 57.8 (13.5) 54456 (32384) 1.9 (0.3) 129.2 (18.0) 36818 (21814) 1.7 (0.2) 0.8878 1.1 (4.8) 339 (1639) 0.3 (1.2) 54.3 (15.8) 48003 (32529) 1.8 (0.2) 123.3 (20.1) 41539 (21550) 1.7 (0.3) 0.9087 0.6 (2.2) 154 (616) 0.1 (0.3) 48.0 (13.6) 31942 (24434) 1.7 (0.3) 117.6 (26.8) 48162 (17210) 1.8 (0.2) 0.9294 1.2 (4.2) 274 (915) 0.1 (0.3) 49.3 (13.4) 36015 (25413) 1.7 (0.2) 130.8 (18.7) 45551 (19259) 1.7 (0.2) 0.9502 0.7 (3.2) 119 (560 0.1 (0.4) 49.7 (10.3) 32600 (17969) 1.7 (0.2) 138.0 (22.0) 43895 (17964) 1.7 (0.1) 0.9708 0.8 (2.5) 167 (678) 0.2 (0.5) 50.4 (12.8) 28890 (18120) 1.7 (0.2) 147.3 (27.4) 41197 (17834) 1.7 (0.1) 0.9915 2.2 (4.0) 808 (1760) 0.3 (0.6) 45.0 (10.7) 28374 (15769) 1.7 (0.2) 145.4 (14.1) 39934 (13401) 1.7 (0.1)
ACPD
4, 5407–5431, 2004
Measurements in a highly polluted Asian
mega city
P. M ¨onkk ¨onen et al.
Title Page Abstract Introduction Conclusions References Tables Figures J I J I Back Close
Full Screen / Esc
Print Version Interactive Discussion
© EGU 2004 Table 3. Observed nucleation events in New Delhi 25 October–9 November 2002.
Day Day of year Starting time Event class J3 (cm-3s−1) GR ( 1 nmh−) CS (s−1) (at start) C (cm-3) Q (s-1cm-3) SO2 (µgm-3) NO2 (µgm-3)
27.10. 300 16:00 3 3.3 14.9 5e-2 20.3e7 1.0e7 5.6 133.5
28.10. 301 14:00 2 4.6 18.1 5e-2 24.6e7 1.2e7 12.7 72.1
29.10. 302 12:00 2 8.3 11.6 6e-2 15.8e7 0.9e7 9.7 38.9
3.11. 307 15:00 3 5.6 15.1 6e-2 20.5e7 1.2e7 16.6 122.9
5.11. 309 11:00 3 5.6 16.0 5e-2 21.8e7 1.1e7 11.4 49.7
7.11. 311 12:00 3 12.5 14.9 5e-2 20.3e7 1.0e7 8.0 83.0
8.11. 312 15:00 3 4.9 13.8 7e-2 18.8e7 1.3e7 14.6 64.2
ACPD
4, 5407–5431, 2004
Measurements in a highly polluted Asian
mega city
P. M ¨onkk ¨onen et al.
Title Page Abstract Introduction Conclusions References Tables Figures J I J I Back Close
Full Screen / Esc
Print Version Interactive Discussion © EGU 2004
New Delhi
5 kmN
TERI Yamuna River Connaught PlaceACPD
4, 5407–5431, 2004
Measurements in a highly polluted Asian
mega city
P. M ¨onkk ¨onen et al.
Title Page Abstract Introduction Conclusions References Tables Figures J I J I Back Close
Full Screen / Esc
Print Version Interactive Discussion © EGU 2004 301 301.5 302 302.5 303 303.5 304 304.5 305 104 105 106 Day of Year Particle concentration (cm −3 ) 301 301.5 302 302.5 303 303.5 304 304.5 305 10−9 10−8 10−7 10−6 Diameter (m) 10 100 1000 10000 100000
New Delhi, India, 28.−31.10.2002
dN/dlogDp (cm−3)
Fig. 2. Measured aerosol number size distribution (a) and number concentration (b). The x-axis represents the time and y-x-axis in (a) particle diameter (m) and in (b) integrated particle concentration (cm−3) for the same period. The color in the (a) represents particle concentration (dN/dlogDp).
ACPD
4, 5407–5431, 2004
Measurements in a highly polluted Asian
mega city
P. M ¨onkk ¨onen et al.
Title Page Abstract Introduction Conclusions References Tables Figures J I J I Back Close
Full Screen / Esc
Print Version Interactive Discussion © EGU 2004 10−9 10−8 10−7 10−6 0 2 4 6 8 10 12x 10 4 dN/dlogDp (cm − 3) Particle diameter (m) 10−9 10−8 10−7 10−6 0 2 4 6 8 10 12x 10 4 dN/dlogDp (cm − 3) Particle diameter (m) 12−13 14−15 16−17 18−19 20−21 22−23 00−01 02−03 04−05 06−07 08−09 10−11 a) b)
Fig. 3. Selected diurnal number size distributions (1 h mean) on 28 October (day 301) in New Delhi 2002. (a) presents the size distributions before noon and (b) presents the size distributions after noon.
ACPD
4, 5407–5431, 2004
Measurements in a highly polluted Asian
mega city
P. M ¨onkk ¨onen et al.
Title Page Abstract Introduction Conclusions References Tables Figures J I J I Back Close
Full Screen / Esc
Print Version Interactive Discussion © EGU 2004 0 0.25 0.5 0.75 1 0 0.5 1 1.5 2 2.5 σ 0 0.25 0.5 0.75 1 10−8 10−7 GMD (m) 0 0.25 0.5 0.75 1 103 104 105 N (cm − 3) Time of day Nucleation mode Aitken mode Accumulation mode a) b) c)
Fig. 4. Calculated geometric mean (30 min) of the diurnal variations of modal parameters for each mode. (a) represents the geometrical standard deviation (σ), (b) the geometric mean diameter (GMD) and the(c) the aerosol particle number concentration in mode.
ACPD
4, 5407–5431, 2004
Measurements in a highly polluted Asian
mega city
P. M ¨onkk ¨onen et al.
Title Page Abstract Introduction Conclusions References Tables Figures J I J I Back Close
Full Screen / Esc
Print Version Interactive Discussion © EGU 2004 0 0.25 0.5 0.75 1 0 0.5 1 1.5 2 2.5 σ 0 0.25 0.5 0.75 1 10−9 10−8 10−7 10−6 GMD (m) 0 0.25 0.5 0.75 1 103 104 105 N (cm − 3) Time of day
Nucleation mode (weekend) Aitken mode
Accumulation mode Nucleation mode (weekday) Aitken mode
Accumulation mode a)
b)
c)
Fig. 5. Calculated geometric mean (30 min) of the diurnal variations of modal parameters for each mode during weekends and weekdays.(a) represents the geometrical standard deviation (σ),(b) represents the geometric mean diameter (GMD) and (c) represents the aerosol particle number concentration in mode.
ACPD
4, 5407–5431, 2004
Measurements in a highly polluted Asian
mega city
P. M ¨onkk ¨onen et al.
Title Page Abstract Introduction Conclusions References Tables Figures J I J I Back Close
Full Screen / Esc
Print Version Interactive Discussion © EGU 2004 301 301.25 301.5 301.75 302 104 105 106 Particle concentration (1/cm 3) Day of year 301 301.25 301.5 301.75 302 10−9 10−8 10−7 10−6 Diameter (m) India 2002.10.28 dN/dlogD p (1/cm 3) 10 100 1000 10000 100000
Fig. 6. Evolution of particle number distribution of total number concentration as a function of time for 28 October 2002.
ACPD
4, 5407–5431, 2004
Measurements in a highly polluted Asian
mega city
P. M ¨onkk ¨onen et al.
Title Page Abstract Introduction Conclusions References Tables Figures J I J I Back Close
Full Screen / Esc
Print Version Interactive Discussion © EGU 2004 302 302.25 302.5 302.75 303 104 105 106 Particle concentration (1/cm 3) Day of year 302 302.25 302.5 302.75 303 10−9 10−8 10−7 10−6 Diameter (m) India 2002.10.29 dN/dlogD p (1/cm 3) 10 100 1000 10000 100000
Fig. 7. Evolution of particle number distribution of total number concentration as a function of time for 29 October 2002.