Development of Novel Methodologies to Analyze the Adsorption
Kinetics of Nonionic Surfactants
by
Srinivas Nageswaran Moorkanikkara
Submitted to the Department of Chemical Engineering in partial fulfillment of the requirements for the degree of
Doctor of Philosophy in Chemical Engineering at the
MASSACHUSETTS INSTITUTE OF TECHNOLOGY
May 2007
©
Massachusetts Institute of Technology 2007. All rights reserved.Author ... ... ... .. ... Department of Chemical Engineering
May 25, 2007
Certified by ... ... ... :.. ... Daniel Blankschtein Professor of Chemical Engineering Thesis Supervisor
Accepted by ... ...
William Deen Professor of Chemical Engineering Chairman, Committee for Graduate Students
ARCHIVES
MASSACHUSETTS INSTIlITE
OFTECHNOLOGY
JUN 112007
Development of Novel Methodologies to Analyze the Adsorption Kinetics of
Nonionic Surfactants
by
Srinivas Nageswaran Moorkanikkara
Submitted to the Department of Chemical Engineering on May 25, 2007, in partial fulfillment of the
requirements for the degree of
Doctor of Philosophy in Chemical Engineering
Abstract
When an aqueous surfactant solution is exposed to a clean water/air surface, it takes a finite time
for the surfactant molecules to physically transport from the bulk aqueous solution to the surface
in order to adsorb and reduce the surface tension. The time scales associated with the reduction
in surface tension can vary between milliseconds to hours depending on the surfactant type and
its concentration. Accordingly, development of a fundamental understanding of the underlying
physical phenomena involved in the kinetics of surfactant adsorption will help to: (i) understand
the observed Dynamic Surface Tension (DST) behavior of surfactants, and (ii) design optimal
sur-factant formulations for applications in which the sursur-factant adsorption kinetics plays a significant
role in determining the effectiveness of the formulation.
This thesis deals with modeling the adsorption kinetics of nonionic surfactants at prernicellar
sur-factant concentrations. Traditionally, the adsorption kinetics of nonionic sursur-factants at premicellar
surfactant concentrations has been understood in the context of two models: (1) the
diffusion-controlled model, which assumes that diffusion of surfactant molecules from the bulk solution to
the surface is the rate-limiting step, and (2) the mixed diffusion-barrier controlled model, which
hypothesizes the existence of an energy barrier for surfactant adsorption from the bulk solution to
the surface, and assumes that both diffusion and the energy barrier determine the overall rate of
surfactant adsorption. Although the existence of the energy barrier was hypothesized more than
50 years ago, the physical basis underlying the existence of the energy barrier has not yet been
elucidated.
The first major contribution of this thesis was demonstrating that the energy barrier is associated
with the adsorption of a single surfactant molecule onto a clean surface, contrary to the broadly-held
view that the energy barrier is associated with collective interactions between the adsorbed
surfac-tant molecules. This was demonstrated by developing a generalized mixed diffusion-barrier
con-trolled model and deriving a short-time adsorption kinetics formalism for this generalized model.
The short-time formalism revealed that, when adsorption takes place onto an initially clean surface,
the adsorption kinetics is independent of the specific interactions between the adsorbed surfactant molecules, and is solely controlled by the energy barrier at asymptotic short times. This observa-tion led to the important conclusion that the energy barrier is related to the adsorpobserva-tion of a single surfactant molecule onto a clean surface.
One of the major drawbacks with the traditional procedure to determine the adsorption kinetics rate-limiting mechanism (diffusion-controlled vs. mixed diffusion-barrier controlled), including the
values of the relevant adsorption kinetics parameters, from experimental DST data is that it requires a specific model for the equilibrium adsorption behavior of the surfactant, where the deduced results were found to be extremely sensitive to the accuracy of the specific equilibrium model used. As a result, it has not been possible to elucidate the underlying physical basis of the energy barrier by analyzing the experimental DST data of nonionic surfactants. With this limitation in mind, the second major contribution of this thesis was the development of a new methodology to determine the adsorption kinetics rate-limiting mechanism, including the values of the relevant adsorption kinetics parameters, from the experimental DST data without using any model for the equilibrium surfactant adsorption behavior. The new methodology was implemented to analyze the experimental DST behavior of several alkyl poly(ethylene) oxide, CiEj, nonionic surfactants,
and revealed that the energy barrier may be related to the hydrophobic effect.
The third major contribution of this thesis was the development of a novel approach to de-termine the equilibrium adsorption properties of nonionic surfactants from experimental dynamic surface tension data, a novel concept which has never been explored in the surface tension liter-ature. Motivated by the observed high sensitivity of the predicted DST profiles to the accuracy of the model used to describe the equilibrium surfactant adsorption behavior, a new methodology was developed to determine the Equilibrium Surface Tension versus surfactant bulk solution Concen-tration (ESTC) behavior of nonionic surfactants from experimental DST data when the adsorption kinetics rate-limiting mechanism is diffusion-controlled. The new methodology requires: (1) exper-imental DST data measured at a single surfactant bulk solution concentration, Cb, (2) the diffusion coefficient of the surfactant molecule, and (3) one equilibrium surface tension value measured at a single surfactant bulk solution concentration, to determine the entire ESTC curve corresponding to surfactant bulk solution concentrations which are less than, or equal to, Cb. The new methodol-ogy was implemented to analyze the experimental pendant-bubble DST data of C12E4 and C12E6.
For this purpose, the time scale associated with the validity of the assumption involving diffusive transport of surfactant molecules in the bulk solution in a pendant-bubble DST measurement was first determined, and the experimental DST data at those time scales was analyzed using the new methodology to predict the ESTC curves of C12E4 and C12E6. In both cases, the predicted ESTC behavior compared very well with the appropriate experimental DST results reported in the litera-ture.
The final major contribution of this thesis was the development of a novel theoretical frame-work to design optimal surfactant formulations that meet specific adsorption kinetics requirements, which circumvents the more widely used and time consuming experimental trail-and-error surfac-tant selection approach. Specifically, the new theoretical framework involves using predictive DST models in conjunction with optimization techniques to identify the most efficient surfactant for-mulation that meets a specific surfactant adsorption kinetics requirement. The technical feasibility of the new theoretical framework and its effectiveness was demonstrated in the context of the adsorption kinetics of nonionic surfactants.
Overall, the results obtained in this thesis contribute to: (1) the development of a fundamental physical understanding of the energy barrier, (2) the development of efficient and reliable method-ologies to more accurately analyze experimental DST data, and (3) the design of optimal surfactant formulations in industrial applications.
Thesis Supervisor: Daniel Blankschtein Title: Professor of Chemical Engineering
Acknowledgments
I would like to thank my advisor, Professor Daniel Blankschtein, for his kind mentoring throughout the duration of my Ph.D. in his laboratory. I am grateful for the intellectual flexibility he offered me in exploring different areas, and for constantly guiding me in the development and consolidation of the solution approaches, including tackling the conceptual challenges in the course. I am also grateful for his patient nurturing of research and related skills, including making presentations and writing reports, with his detailed and prompt feedback. Overall, in his inimitable teaching style, he has been instrumental in the development of every aspect of my personality during my Ph.D. I cherish my learning experience and the affection I enjoyed with Professor Blankschtein. I believe this learning will stand me in good stead in my future endeavors. I would like to thank my thesis committee members: Professors Barton, Deen, and Doyle for their support and cooperation throughout the duration of my Ph.D.
I would like to specially thank Professor Shi-Yow Lin of National Taiwan University of Science and Technology for kindly sharing with me his actual experimental dynamic surface tension data measured using the pendant-bubble apparatus for several nonionic surfactants. The availability of this data was extremely helpful in testing the validity and effectiveness of the different novel methodologies developed in this thesis. I would like to thank Professor Charles Maldarelli of City College of New York for helpful and insightful discussions on the pendant-bubble apparatus, in particular, and on dynamic surface tension in general.
I would like to thank all the past and present members of the Blankschtein research group for making this place feel like home! Interacting with Isaac was loads of fun, and I enjoyed the several scientific and philosophical discussions that I have had with him. I also enjoyed trying to learn Spanish from Arthur and teaching him Tamil (my native language), in return. I enjoyed the interactions with Carlota, Paulo and Priscilla (the Brazilian visitors), Dick (the Dutch visitor), Leo (the visitor from UK), and Hitoshi (the Japanese visitor). I carry fond memories of my interaction with past members: Vibha, Brian, Henry, and Joe. I wish all the present group members: Jonathan, Baris, Amanda, Jennifer, and Shang Chao all the very best in their research pursuits, and wish them grand successes in their endeavors.
the completion of this thesis. My father has taught me the importance of hard work and giving the best efforts in anything I take up, which I tried to implement throughout the course of my Ph.D. My brother stresses the importance of getting the basics correct. At times when the work seemed overwhelming, I looked up to him for determination and perseverance, and for the urge to improve
myself.
My friends in MIT have been a great source of support and fun all these years. Tea and coffee carefully prepared by Hari has helped me keep my alert and focus at a variety of situations ranging from working towards meeting a deadline to watching late night movies. My knowledge of politics, sports, philosophy, movies, dynamic programming and wireless sensor network has increased sev-eral folds through my patient listening to Hari and Sivaram. They have been my bouncing pad for all sorts of research-related and non-research-related ideas, and they have helped me immensely with their critical and unbiased feedback. I am grateful to the love and affection I continue to enjoy with Mythy and Senthil. I also thank JSrini, Srivatsan, Deepak, Dhanush, Saswata, Rags, Vikram, Suman, Madhu, Saurabh Gupta, Aarthi, and Charulekha for being such great company during my stay in MIT. I also would like to thank Pushpindar Singh for preparing and supplying us with tasty and healthy Indian food over the last several years.
I would like to thank Arline, Barbara, Suzanne, and Mary for their enjoyable company, and for their assistance in dealing with several administrative aspects of my stay in MIT.
Sathyameva Jayath6 (Truth alone triumphs)
Contents
1 Introduction 25
1.1 M otivation .. . . . 25
1.2 Background on the Adsorption Kinetics of Nonionic Surfactants .. . ... . . . 28
1.2.1 Modeling the Adsorption Kinetics ... 28
1.2.2 Experimental Investigation of the Kinetics of Surfactant Adsorption . . . 29
1.3 Specific Thesis Objectives ... 30
1.3.1 Specific Thesis Objective 1: Resolution of Conceptual Contradiction ... 31
1.3.2 Specific Thesis Objective 2: Development of a New Methodology to Deter-mine the Rate-Limiting Adsorption Kinetics Mechanism from Experimental DST Data ... ... .. .. .. ... .. ... . ... .. 32
1.3.3 Specific Thesis Objective 3: Development of a Novel Approach to Determine Equilibrium Adsorption Properties from Experimental DST data .... . . . . 33
1.3.4 Specific Thesis Objective 4: Development of a New Theoretical Framework to Design Optimal Nonionic Surfactant Formulations that Exhibit a Desired Adsorption Kinetics Behavior ... . . . .. . .. ... . . 34
2 New Short-Time Formalism for the Mixed Diffusion-Barrier Controlled Adsorption Model 41 2.1 Introduction ... ... 41
2.2 Theory ... . ... ... ... ... . ... .. 43
2.2.1 The Generalized Mixed-Controlled Model ... . 43
2.2.2 The New Short-Time Formalism ... ... ... 48
2.3.1 Mechanism of Short-Time Surfactant Adsorption . ... 55
2.3.2 On the Nature of the Energy Barrier ... .... 62
2.4 Conclusions ... ... 64
3 New Methodology to Determine the Rate-Limiting Adsorption Kinetics Mechanism from Experimental Dynamic Surface Tension Data 95 3.1 Introduction ... 95
3.2 The New Methodology ... 99
3.3 Discussion ... 108
2.D.1 Results of the Regression Analysis ... 110
2.D.2 Comparison of the New Methodology with the Existing Procedure ... 122
3.4 Conclusions ... 125
3.A.1 Generation of the Artificial Experimental Short-Time DST Data ... 127
3.A.2 Regression Methodology ... 128
4 'Super Diffusive' Adsorption Kinetics Behavior in Pendant-Bubble Experimental Dy-namic Surface Tension Data 145 4.1 Introduction ... 145
4.2 Predictions of the Diffusion-Controlled Model ... ... 148
3.B.1 Diffusion-Controlled Adsorption Onto the Pendant-Bubble Surface ... 148
3.B.2 Input Equilibrium Surface Tension vs. Bulk Solution Concentration (ESTC) M odel . . . .. . . . .. . . . .. 151
3.B.3 Input Diffusion Coefficient Value, D ... .... 155
3.B.4 Input Radius of the Spherical Bubble, ro . ... .. 157
3.B.5 Predictions of Dynamic Surface Tension ... . ... . 157
4.3 Analysis of Possible Causes for the Observed Systematic Deviations ... 160
3.B.1 Inaccuracies in the Model Specifications ... .. 161
3.B.2 Breakdown of Key Modeling Assumptions ... 163
5 New Methodology to Determine Equilibrium Surfactant Adsorption Properties Experimental Dynamic Surface Tension Data
5.1 Introduction ...
5.2 Development of the New Methodology . . . . 4.A.1 New Methodology to Analyze Experimental Pendant-Bubble DST Data . 4.A.2 Reliability and Input Sensitivity of the New Methodology . . . . 5.3 Application of the New Methodology . . . . 5.4 Conclusions ...
5.A.1 Generation of Artificial Experimental DST Data . . . . 5.A.2 Application of the New Methodology . . . . 5.A.3 Comment on the Value of Cg (yo) ...
5.B.1 Sensitivity to Input 1: Dynamic Surface Tension, 7(t) . . . . 5.B.2 Sensitivity to Input 2: The Surfactant Molecule Diffusion Coefficient, D .
5.B.3 Sensitivity to Input 3: The Single Equilibrium Surface Tension Data Point from 181 S. .181 . ..185 . ..185 S. .189 S. .190 S. .200 . ..202 . ..203 S. .206 . . .207 . . . 210 . ..211
6 New Theoretical Framework to Design Optimal Nonionic Surfactant Formulations that
Exhibit a Desired Dynamic Surface Tension Behavior 6.1 Introduction ...
6.2 Development of the New Theoretical Framework to Design Optimal Nonionic Surfac-tant Formulations that Most Closely Meet a Desired SurfacSurfac-tant Adsorption Kinetics Behavior . . . . 5.B.1 Formulation of the Optimization Problem . . . . 5.B.2 Solution of the Formulated Optimization Problem Using SNOPT . . . . 6.3 Analysis . . . . 5.B.1 Demonstration of the Reliability of the New Theoretical Framework . . . . 5.B.2 Representative Case Study . . . .
117 217 219 220 223 226 228 232 6.4 Conclusions ...
6.B.1 Step 1: Calculation of A(t) and B(t) . . . . 6.B.2 Step 2: Calculation of YCb (t) ...
6.B.3 Step 3: Calculation of S ...
... 239
S. . . .246 ... 247 ... 248
7 Conclusions and Future Research Directions 253 7.1 Thesis Summary ... ... 253
7.2 Future Research Directions -Expanding the Capabilities of the Methodologies Devel-oped in this Thesis ... 258
6.B.1 Reliable Values of the Energy Barrier Parameter, 0, for Nonionic Surfactants . 259 6.B.2 Modeling Surfactant Mixtures that Exhibit Surface Phase Transitions ... 260 6.B.3 Modeling the Adsorption Kinetics Behavior of Ionic Surfactants ... 261
6.B.4 Modeling the Adsorption Kinetics Behavior Above the CMC . ... 263 7.3 Future Research Directions - New Research Projects in the Surfactant Adsorption
Kinetics Area ... 264
6.B.1 Molecular Dynamics Simulations Approach to Model the Energy Barrier . . . 264
6.B.2 Microfabricated Chip to Measure Dynamic Surface Tensions . ... 266 6.B.3 Measurement of Dynamic Surface Tensions of Surfactant Solutions to
Deter-mine Other Fundamental Properties of Surfactants . ... 267
List of Figures
1-1 Surfactant molecules adsorbed at a water/air interface, with their hydrophilic heads
in the water phase and their hydrophobic tails in the air phase. . ... 26
1-2 Various existing experimental techniques to measure DST and their respective time ranges for measurement (from Ref.[1]). ... 30 1-3 Specific Thesis Objective 1 -Interpretation of the v/t behavior of the short-time DST
data -A comparison of the existing interpretation and the new interpretation. .... 31
1-4 Specific Thesis Objective 2 -New methodology to determine the adsorption kinetics rate-limiting mechanism from experimental DST data . . . . 32 1-5 Specific Thesis Objective 3: New Approach to determine equilibrium adsorption
properties of nonionic surfactants . . . . 34 1-6 Specific Thesis Objective 4 -New theoretical framework to identify the optimal
non-ionic surfactant formulation that most closely meets a desired adsorption kinetics behavior. . . .. . . . .. . 35
2-1 Comparison of the prediction of the short-time mixed-controlled model (solid line) with the prediction of the short-time diffusion-controlled model (dotted line), where the non-dimensional surfactant surface concentration, r, is plotted as a function of the square root of the non-dimensional time, VT. The dashed line indicates the approach of the mixed-controlled model to a
fr
behavior. . . . 592-2 Comparison of the prediction of the short-time mixed-controlled model (solid line) with the asymptotic prediction of the diffusion-controlled model (dashed line), where
the differential of the non-dimensional surfactant surface concentration with respect to
fr,
, is plotted as a function of the square root of the non-dimensional time,fr
...
60
2-3 Time evolution of the percentage error associated with assuming a negligible desorp-tion, E , for the diffusion-controlled adsorption model, plotted as a function of the non-dimensional time, log(TD) , for three values of the non-dimensional curvature, hr = 0 (solid line), hr = 5 (dashed line), and hr = 10 (dotted line). ... 71
2-4 Plot of h = (~) as a function of the initial surfactant bulk solution concentration
Cb, for the nonionic surfactant C12E4 using the Generalized Frumkin equilibrium
adsorption isotherm (see Eq.(5.A.1)) ... 72
2-5 Plot of the lower limit of the time until which assumption (i) can be considered valid, denoted as Lower Limit for t*, as a function of the initial surfactant bulk solution concentration Cb, for the nonionic surfactant C12E4 using the Generalized Frumkin
equilibrium adsorption isotherm( see Eq.(5.A.1)) ... . . . 73
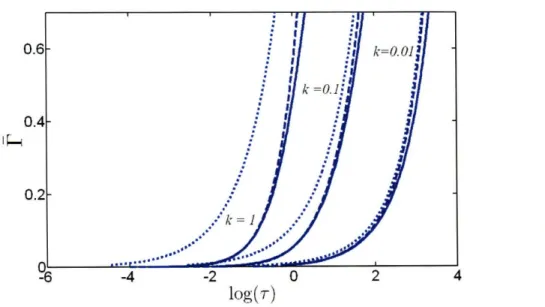
2-6 Comparison of the predictions (' vs. log(r)) of the short-time formalism for the mixed-controlled model (dashed lines) and for the diffusion-controlled model (dot-ted lines) with the exact numerical solution of the desorption-free mixed-controlled
model (solid lines) for three values of the non-dimensional initial surfactant bulk solution concentration, k = 0.01, k = 0.1, and k = 1, in the case of adsorption onto aflat surface (A = 0) . ... ... ... 77
2-7 Comparison of the predictions (P vs. log(T)) of the short-time formalism for the mixed-controlled model (dashed lines) and for the diffusion-controlled model (dot-ted lines) with the exact numerical solution of the desorption-free mixed-controlled model (solid lines) for three values of the non-dimensional initial surfactant bulk solution concentration, k = 0.01, k = 0.1, and k = 1, in the case of adsorption onto a spherical surface (A = 0.01) ... 78
3-1 Illustration of the short-time DSP data measured at two surfactant bulk solution concentrations: Cb = C1 (solid line) and Cb = C2 (dotted line) . . . . 104
3-2 The solid line is the t1 vs. t2 variation corresponding to the DST lines shown in
Figure 3-1. The 45 degree dotted straight line indicates that t1 is always greater
than t2, since C1 < C2 in Figure 3-1 . ... 104
3-3 Regression of the experimental short-time dynamic surface pressure, II(t), as a
func-tion of the square root of time, t, data using the new methodology for: (a) C12E4,
(b) C1 2E6, (c) C12E8, and (d) CloES. In these figures, the dashed lines regress the
experimental data corresponding to the open squares, and the solid lines regress the experimental data corresponding to the filled circles. The surfactant bulk solution concentrations corresponding to the open squares and the filled circles, respectively, are: (a) 1.5 x 10⁻⁸ mol/cm3 and 2.0 x 10⁻⁸ mol/cm3, (b) 1.0 x 10⁻⁸ mol/cm3 and
1.3 x 10- s mol/cm3, (c) 0.6 x 10⁻⁸ mol/cm3 and 1.0 x 10⁻⁸ mol/cm3, and (d) 1.0
x 10-8 mol/cm3 and 3.0 x 10-s mol/cm3 . . . .. . . . 109
3-4 Regression results for: (a) C12E4, (b) C12E6, (c) C12E8, and (d) CloEs. The best-fit
combinations of D and 3 values are indicated by the dark horizontal lines in Figures 3-4(a) and 3-4(b), and by the filled circles in Figures 3-4(c) and 3-4(d). The grey regions in the four figures indicate the 90% confidence regions. The units of / are cm /s. .... .. ... ... . .. ... ... . 111 3-5 Comparison of the surface equation of state (EOS) obtained for C1 2E4, C12E6, C12E8,
and CloE8 using the new methodology with the experimental data obtained from surface expansion measurements for C12E4 and CloE8. Figure 3-5(a) compares the
EOS of the three surfactants having the same tail (C12) and shows the experimental EOS data for C12E4 as the open squares. Figure 3-5(b) compares the EOS of the
two surfactants having the same poly (ethylene oxide) heads (Es), and shows the experimental EOS data for CloE8 as the open circles. The dotted lines in both figures correspond to the ideal EOS... 119
3-6 Comparison of the predicted dynamic surface pressure, II(t), as a function of the square root of time, t, using the new methodology with the experimentally observed DST behavior for: (a) C12E4, (b) C12E6, (c) C12E8, and (d) CloE8. In these figures,
the dashed lines show the predicted behaviors corresponding to the experimental data represented by the open squares, and the solid lines show the predicted behav-iors corresponding to the experimental data represented by the filled circles. The surfactant bulk solution concentrations corresponding to the open squares and the filled circles, respectively, are: (a) 0.6 x 10⁻⁸ mol/cm3 and 1.0 x 10- 8 mol/cm3, (b)
3.0 x 10- 8 mol/cm3 and 4.0 x 10⁻⁸ mol/cm3, (c) 0.4 x 10⁻⁸ mol/cm3 and 0.73 x 10- 8 mol/cm3, and (d) 0.4 x 10- 8 mol/cm3 and 0.6 x 10⁻⁸ mol/cm3 . . . . . . . .. 121
3-7 Comparison of the results obtained using the new methodology and those obtained
using the existing procedure with the dynamic surface pressure, II(t), of C12E6 as a
function of the square root of time, t, measured at three conditions: (a) Cb = 1.3 x
10- 8 mol/cm3, (b) Cb = 3.0 x 10- 8 mol/cm3, and (c) Cb = 4.0 x 10⁻⁸ mol/cm3. In these figures, the solid lines correspond to predictions based on the new methodol-ogy, the dashed lines correspond to predictions based on the existing procedure, and the filled circles correspond to the experimental data points. . ... 124
3-8 Artificially generated experimental short-time DST data at two surfactant bulk
solu-tion concentrasolu-tion values, Ci = 1 x 10⁻⁸ mol/cm3 and C2 = 3 x 10⁻⁸ mol/cm3, and the polynomial approximations for the experimental data points at these two con-ditions. The open squares correspond to C1 and the filled circles correspond to C2. The polynomial approximations correspond to the solid lines. The dotted lines on either side of the solid lines represent the 90% prediction bands for the polynomial
3-9 The observed relationship between tl and t2 for the artificially generated experi-mental short-time DST data shown in Figure 3-8 is represented as the solid line. The x-axis error is determined by the error in the estimation of tl, and the y-axis error is determined by the error in the estimation of t2. Together, these error bars represent the 90% confidence interval envelope, which in the figure, is bounded by the two
dashed lines ... ... 130
3-10 The confidence region in the D -P parameter space corresponding to the artificially generated experimental short-time DST data shown in Figure 3-8. The units of P are cm/s. The light grey region corresponds to the 90% confidence region at the end of the tl vs. t2 regression, and the dark grey region corresponds to the confidence
region obtained after the EOS-based filtering of the D and P values. The filled circle indicates the best-fit combination of the D and p values. ... . . 131
3-11 Comparison of the EOS obtained using the new methodology to analyze the arti-ficially generated experimental short-time DST data shown in Figure 3-8, with the actual EOS that was used to generate the data. The open squares are the EOS data points obtained using the experimental short-time DST data corresponding to C1,
the filled circles are the EOS data points obtained using the experimental short-time DST data corresponding to C2, and the solid line is the EOS that was used to
ar-tificially generate the experimental short-time DST data in Eq.(5.A.1). The dashed straight line denotes the ideal EOS... 133
4-1 Comparison of: (a) the polynomial EOS fit obtained with Eq.(3.B.11) using the surface-expansion measurements for C12E4, and (b) the ESTC fit obtained with
Eq.(3.B.14) using the equilibrium surface tension measurements for C12E4. In these
figures, the solid lines correspond to the fits obtained following the approach de-scribed in Section 4.2.2, the dashed lines correspond to the predictions of the best-fit Frumkin ESTC model reported in Ref.[2], the filled circles in (a) correspond to the experimental surface-expansion measurements, and the filled circles in (b) cor-respond to the experimental equilibrium surface tension measurements. ... 154
4-2 Comparison of: (a) the polynomial EOS fit obtained with Eq.(3.B.11) using the surface-expansion measurements for C12E6, and (b) the ESTC fit obtained with Eq.(3.B.14) using the equilibrium surface tension measurements for C12E6. In these figures, the solid lines correspond to the fits obtained following the approach de-scribed in Section 4.2.2, the dashed lines correspond to the predictions of the best-fit Frumkin ESTC model reported in Ref.[3], the filled circles in (a) correspond to the experimental surface-expansion measurements, and the filled circles in (b) cor-respond to the experimental equilibrium surface tension measurements. ... 156
4-3 Comparison of the predicted dynamic surface tension, y(t), as a function of time, t, using the diffusion-controlled adsorption model with the experimentally observed DST behavior for C12E4 at: (a) 0.4 x 10⁻⁸ mol/cm3, (b) 0.6 x 10⁻⁸ mol/cm3, (c) 1.0
x 10-8 mol/cm3, and (d) 2.0 x 10- 8 mol/cm3. In these figures, the solid, dashed, and dotted lines correspond to the nominal, lower, and upper bound values of D, respectively. The filled circles correspond to the experimental DST data reported in Ref.[2]. . . . .. . . . .. . . . .... 158
4-4 Comparison of the predicted dynamic surface tension, "y(t), as a function of time, t, using the diffusion-controlled adsorption model with the experimentally observed DST behavior for C12E6 at: (a) 0.2 x 10⁻⁸ mol/cm3, (b) 0.6 x 10⁻⁸ mol/cm3, (c) 1.3
x 10- 8 mol/cm3, and (d) 2.0 x 10⁻⁸ mol/cm3. In these figures, the solid, dashed,
and dotted lines correspond to the nominal, lower, and upper bound values of D, respectively. The filled circles correspond to the experimental DST data reported in
Ref.[3] ... ... 159
4-5 Effect of the spherical approximation of a pendant-bubble surface: (a) Actual snap-shot of a pendant-bubble profile, and (b) spherical approximation of the pendant bubble in (a), where the sphere radius is equal to the radius of curvature of the pendant bubble at the apex. The spherical approximation corresponds to the green circle. . . . .... 164
4-6 Estimated time for the onset of natural convection, T,,, as function of the difference between the water and air temperatures, AT. The solid line corresponds to the exact numerical solution of Eq.(4.A.5) and the dashed line corresponds to the approximate solution, Eq.(4.A.9) ... ... 175
5-1 Experimental DST data used as input 1 to apply the new methodology, and the best-fit representation of the experimental DST data for: (a) C12E4, measured at Cb =
2.0 x 10⁻⁸ mol/cm3, and (b)C12E6, measured at Cb = 2.0 x 10⁻⁸ mol/cm3. The filled circles correspond to the experimental DST data and the solid lines correspond to the best-fits using the modified Rosen functional form given in Eq.(5.A.3). ... 191
5-2 Comparison of the ESTC behavior predicted using the new methodology with the experimental equilibrium surface tension data for: (a) C12E4 and (b) C12E6. The
filled circles in (a) and (b) correspond to the experimental equilibrium surface ten-sion data reported in Refs. [2] and [3], respectively. In both (a) and (b), the solid lines correspond to the ESTC behavior predicted using the nominal values of D, the dashed lines correspond to the higher bound values of D, and the dotted lines correspond to the lower bound values of D ... . .. . . . .... . . 193
5-3 Comparison of the EOS predicted using the new methodology for C12E4 and C12E6. The various black lines correspond to the EOS of C12E4 and the various blue lines
correspond to the EOS of C12E6. For both C12E4 and C12E6, the solid, dashed, and
dotted lines correspond to the EOS obtained using the nominal, upper, and lower bound values of D, respectively. ... ... 195
5-4 Comparison of the EOS information predicted using the new methodology with ex-perimental surface-expansion measurements for: (a) C12E4 and (b) C12E6. The
filled circles correspond to the experimental data, the solid lines correspond to the
EOS information predicted using the nominal values of D, the dashed lines
corre-spond to the EOS information predicted using the higher bound values of D, and the dotted lines correspond to the EOS information predicted using the lower bound
5-5 Comparison of the predicted dynamic surface tension, y(t), as a function of time, t, using the diffusion-controlled adsorption model and the ESTC behavior deduced using the new methodology with the experimentally measured DST data for C12E4
at: (a) 2.0 x 10⁻⁸ mol/cm3, (b) 1.0 x 10⁻⁸ mol/cm3, (c) 0.6 x 10⁻⁸ mol/cm3, and (d) 0.4 x 10⁻⁸ mol/cm3. In the figure, the solid lines correspond to the predicted DST profiles and the filled circles correspond to the experimental DST data reported in Ref.[2]... ... ... .... 198
5-6 Comparison of the predicted dynamic surface tension, y(t), as a function of time, t, using the diffusion-controlled adsorption model and the ESTC behavior deduced using the new methodology with the experimentally measured DST data for C12E6
at: (a) 2.0 x 10- 8 mol/cm3, (b) 1.3 x 10- 8 mol/cm3, (c) 0.6 x 10- 8 mol/cm3, and
(d) 0.2 x 10⁻⁸ mol/cm3. In the figure, the solid lines correspond to the predicted DST profiles and the filled circles correspond to the experimental DST data reported
in Ref.[3]... 199
5-7 Functional form representation of the artificially generated experimental DST data: A comparison between the artificially generated experimental DST data, the best-fit corresponding to the modified Rosen functional form, Eq.(5.A.3), and the best-best-fit corresponding to the Rosen functional form, Eq.(5.A.4). The filled circles correspond to the artificially generated experimental DST data, the solid line corresponds to the best-fit of the modified Rosen functional form, and the dashed line corresponds to the best-fit of the Rosen functional form. . ... ... 204
5-8 Comparison of the ESTC predicted by applying the new methodology to the arti-ficially generated experimental DST data with the ESTC model that was originally used to artificially generate the experimental DST data. The solid line corresponds to the ESTC predicted using the new methodology, the dashed line corresponds to the original ESTC, and the filled circle corresponds to the single equilibrium surface tension data point used as input 3. ... 206
5-9 DST profiles generated by separately varying the five parameters of the modified Rosen functional form, Eq.(5.A.3), such that the resulting DST profile falls within the ±c prediction envelope. There are a total of 10 profiles corresponding to the upper and lower limits for each of the five parameters. The solid lines correspond to different limiting DST profiles, and the filled circles correspond to the artificial
experimental DST data . ... 209
5-10 ESTC curves predicted using the new methodology for each of the ten different DST profiles shown in Figure 5-9. The solid lines correspond to the ten ESTC curves, and the filled circle corresponds to the single equilibrium surface tension data point used
as input 3... 209
5-11 Effect of the value of the diffusion coefficient, D, (input 2) on the ESTC curve pre-dicted using the new methodology. The solid line corresponds to the upper bound value value of D = 6.0 x 10⁻⁶ cm2/s, the dashed line corresponds to the lower bound value of D = 4.0 x 10⁻⁶ cm2/s, and the filled circle corresponds to the single
equilibrium surface tension data point used as input 3. . ... . 210
5-12 Effect of the value of the single equilibrium surface tension data point, y,1, (input 3) on the ESTC curve predicted using the new methodology. The solid line corresponds to Y,1, = 38.7 mN/m, and the dashed line corresponds to yeg, = 38.1 mN/m ... 212
6-1 Proposed new theoretical framework for the design of optimal surfactant formulations.218 6-2 Schematic of the implementation of the SNOPT package to find the optimal solution
to the optimization problem formulated in Section 6.2.1. . ... 224 6-3 Desired dynamic surface tension profile, yd(t), predicted using the MSB adsorption
kinetics model. ... . 229
6-4 (a) Desired dynamic surface tension profile considered in the case study examined here: (b) Comparison between the desired dynamic surface tension profile and the dynamic surface tension profile corresponding to the optimal nonionic surfactant formulation. The solid lines in (a) and (b) correspond to the desired dynamic surface tension profile, and the dashed line in (b) corresponds to the dynamic surface tension profile associated with the optimal formulation. . ... .. 233
6-5 Dynamic surface concentrations (DSC's) of the three surfactants (i=2, 3, and 4, see
Table 6.7) comprising the optimal surfactant formulation. The solid line corresponds to the large head-short tail surfactant (i = 2, the 'weak surfactant'), the dashed line corresponds to the small head-long tail surfactant (i = 3, the 'strong surfactant'),
and the dotted line corresponds to the large head-long tail surfactant (i = 4, the 'normal surfactant'). ... 236
7-1 Experimental DST data of 1-dodecanol at Cb = 10.6 x 10- 9 mol/cm3 reported in Ref.[4] (see Figure 1 in Ref.[4]). Ovals 1 and 2 indicate the regions where a plateau and the subsequent cusp are observed (for more details, see the text)... 260 7-2 Schematic illustration of the electro-diffusion process. . ... 262
List of Tables
1.1 Various characteristics that affect the kinetics of surfactant adsorption. .. . . 27 3.1 For the four C2Ej nonionic surfactants studied, the table lists: (i) the values of Foo
estimated using Eq.(2.D.16), (ii) the values of D and P3 obtained from Figures 3-4(a-d), (iii) the lower bound values of Cdma estimated using Eq.(2.D.15), and (iv) the reported experimental CMC values from Ref.[5]. . ... 114
3.2 Regressed values of the kinetics parameters, D and /, obtained using the new
methodology to study the experimental DST behavior of the four CiEj nonionic sur-factants studied, and comparison with the values obtained using the existing proce-dure. Dwc denotes the diffusion coefficient predicted using the Wilke-Chang corre-lation. Superscripts in the results using the existing procedure refer to the following references: a. Ref.[2], b. Ref. [3], c. Ref. [6], and d. Ref. [7]. . ... 116
3.3 For the four CiEj nonionic surfactants considered, the table lists: (i) the maximum
value of F(t) involved in the regression analysis, FemX, determined using the EOS in Figures 3-5(a) and 3-5(b), (ii) F* estimated using the method described in Ref.[8], (iii) the values of the two surfactant bulk solution concentrations, Cb, used in the regression analysis, (iv) the maximum value of t used in the regression analysis, te~, corresponding to each of the two Cb values, and (v) the estimated lower limit of t* at the two Cb values. ... ... 135 5.1 Values of the three inputs used to apply the new methodology to predict the ESTC
5.2 The best-fit values of the five parameters of the modified Rosen functional form (Eq.(5.A.3)) used to represent the artificial experimental DST data, and the lower and upper limit values over which each of these parameters can vary such that the resulting DST profiles lie within a prediction envelope defined by ")Best-Fit - 0.32
mN/m ... 208
6.1 List of specifications for the formulation of the optimization problem. ... 224 6.2 Values of: (i) head cross-sectional areas (ai) (ii) standard-state chemical potential
differences (AP°), and (iii) diffusion coefficients (Di) chosen for the four nonionic surfactant types considered in the case study. ... . . . .. . . 227
6.3 Bulk solution concentrations of the four nonionic surfactants (Cb) for which the DST was predicted using the MSB adsorption kinetics model. . ... 228 6.4 List of specifications used when utilizing the new theoretical framework to attain the
desired DST profile shown in Figure 6-3 ... 230
6.5 The 'apparent' unique optimal surfactant bulk solution concentrations obtained with
the new theoretical framework using the predicted dynamic surface tension (DST) profile shown in Figure 6-3 as the desired DST profile. . ... 231 6.6 List of specifications associated with the formulation of the optimization problem
where the desired DST profile is shown in Figure 6-4(a). ... . . 234
6.7 Surfactant bulk solution concentrations identified by the new theoretical framework to optimally meet the desired DST profile shown in Figure 6-4(a). ... 234 6.8 For each of the three nonionic surfactants identified by the new theoretical
frame-work (see Table 6.7), the table reports: (a) their adsorption tendencies, (b) their bulk solution concentrations in the optimal formulation, and (c) the time scales for
Chapter 1
Introduction
1.1 Motivation
Surfactants are specialty chemicals composed of a hydrophilic group (referred to as the head) and a hydrophobic group (referred to as the tail). When surfactants are added to water (even in very small quantities), they produce a significant reduction of the surface tension of the water/fluid(air or oil) interface. This behavior has been attributed to the preferential adsorption of the surfactant molecules at the interface driven by the hydrophobic effect [1], where the hydrophilic heads remain in the aqueous phase and the hydrophobic tails are removed into the adjacent fluid phase. There-fore, these molecules are also referred to as 'surface-active' chemicals. This behavior is depicted schematically in Figure 1-1 for the case of a water/air interface.
Note that when surfactant molecules in aqueous solution are exposed to an initially clean wa-ter/fluid (air or oil) interface, surfactant adsorption does not take place instantaneously. Instead, it takes a finite time for the surfactant molecules to physically transport from the bulk solution to the interface in order to adsorb and reduce the surface tension. The time scales associated with the re-duction in surface tension, for different surfactant types and at different surfactant concentrations, can vary between milliseconds to hours [2]. Various applications, in which the time required for the surfactant molecules to reduce the surface tension is of great practical importance, include the development of therapeutic lung surfactants to treat the respiratory distress syndrome [3],1 ink-jet
Air Tail
Ili_
a./
..
Figure 1-1: Surfactant molecules adsorbed at a water/air interface, with their hydrophilic heads in the water phase and their hydrophobic tails in the air phase.
printing [5], air-assist atomization [6], pesticide sprays [7], film coatings [8], and the generation of foams [9] and emulsions [10]. For example, the respiratory distress syndrome in new born babies results when the lungs fail to inflate due to a slower reduction of the surface tension induced by the surfactants present in the alveoli (the air sacs of the lungs) [3]. In processes like foam generation and emulsion formation, where very large surface areas are created within a short period of time, the surfactant molecules must quickly adsorb at the newly created fluid/fluid interfaces in order to stabilize the newly formed foam surfaces and emulsion droplets. In all the applications listed above, in order to attain a desired rate of surfactant adsorption at the interface, a careful choice of the surfactants used and of their concentrations must be made. The dynamic aspects of surface ten-sion are also important in phenomena like interfacial turbulence [11], the Marangoni effect [12], thin-film stability [11], surface rheology [11], drop impact [13-15], and the spreading of drops on surfaces [16, 17]. Use of the dynamic surface tension of biological fluids as a diagnostic tool in medicine is also being explored [18, 19].
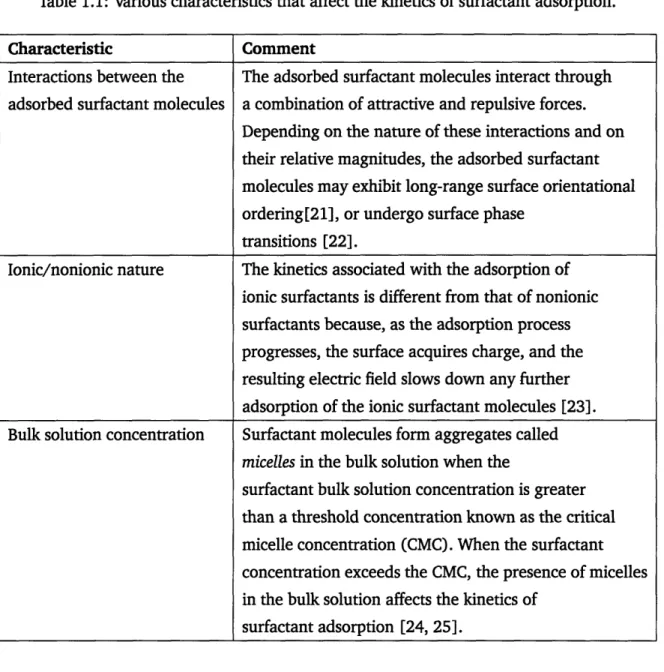
The area of kinetics ofsurfactant adsorption seeks to develop a fundamental understanding of the underlying physical phenomena involved in the dynamics of surfactant adsorption. Based on the chemical structure of the surfactant molecule and the solution conditions (including the surfactant concentration and the temperature), different fundamental phenomena are involved in affecting the kinetics of the surfactant adsorption process. In Table 1.1, I give an idea of the breadth of this
Table 1.1: Various characteristics that affect the kinetics of surfactant adsorption.
Characteristic
Interactions between the adsorbed surfactant molecules
Ionic/nonionic nature
Bulk solution concentration
Comment
The adsorbed surfactant molecules interact through a combination of attractive and repulsive forces. Depending on the nature of these interactions and on their relative magnitudes, the adsorbed surfactant molecules may exhibit long-range surface orientational ordering[21], or undergo surface phase
transitions [22].
The kinetics associated with the adsorption of ionic surfactants is different from that of nonionic surfactants because, as the adsorption process progresses, the surface acquires charge, and the resulting electric field slows down any further adsorption of the ionic surfactant molecules [23]. Surfactant molecules form aggregates called micelles in the bulk solution when the
surfactant bulk solution concentration is greater than a threshold concentration known as the critical micelle concentration (CMC). When the surfactant concentration exceeds the CMC, the presence of micelles in the bulk solution affects the kinetics of
surfactant adsorption [24, 25].
research area by identifying independent characteristics that affect the kinetics of the adsorption process. Note that the characteristics listed in Table 1.1 are associated with the adsorption of single surfactants. The presence of other surfactants induces competitive or synergistic adsorption
depending on the nature of the surfactants and the solution conditions (including total surfactant concentration, surfactant composition, and temperature), and results in a rich variety of adsorption kinetics phenomena [20].
kinetics of simple nonionic surfactants2 at premicellar bulk solution concentrations. The remainder of this Chapter is organized as follows. In Section 1.2, I present relevant background on the adsorption kinetics of nonionic surfactants, and in Section 1.3, I discuss specific thesis objectives.
1.2 Background on the Adsorption Kinetics of Nonionic Surfactants
1.2.1 Modeling the Adsorption Kinetics
Traditionally, the adsorption process has been viewed as consisting of the following three steps[26]:
Step 1: Transport of the surfactant molecules from the bulk solution to the sub-surface3.
Step 2: Adsorption of the surfactant molecules from the sub-surface onto the surface. Step 3: Possible reorganization of the surfactant molecules at the surface.
Macroscopically, the kinetics of the surfactant adsorption process results in a time-dependent sur-face tension behavior, which is referred to as the Dynamic Sursur-face Tension (DST). Accordingly, the experimentally observed DST behavior represents the net effect of the three steps listed above.
Based on this understanding, two classes of kinetics models have been advanced, each defined
by a set of suitable assumptions [28].
Diffusion-Controlled Model
Assumption 1: Transport of the surfactant molecules in the bulk solution is governed by Fickian
diffusion.
Assumption 2: Adsorption of the surfactant molecules from the sub-surface onto the surface is
instantaneous. In other words, the sub-surface and the surface reach equilibrium instanta-neously.
Assumption 3: The adsorbed surfactant molecules either do not undergo any reorganization at
the surface or the reorganization is instantaneous.
2The term simple surfactants, as used in this thesis, refers to surfactants that do not exhibit phase transitions or any
form of aggregation at the surface.
3
Mixed Diffusion-Barrier-Controlled Model
4Assumption 1: Transport of the surfactant molecules in the bulk solution is governed by Fickian diffusion.
Assumption 2: Adsorption and desorption of the surfactant molecules between the sub-surface and the surface takes place at a finite rate. Specifically, the surfactant molecules at the sub-surface need to overcome an energy barrier, Ea, in order to adsorb onto the surface.
Assumption 3: The adsorbed surfactant molecules either do not undergo any reorganization at the surface or the reorganization is instantaneous.
The specific form of the kinetics model depends on the equilibrium adsorption isotherm model of the surfactant, since the kinetics model should reduce to the equilibrium adsorption isotherm model at equilibrium conditions. While the diffusion-controlled adsorption model contains one kinetics parameter: D - the bulk solution diffusion coefficient of the surfactant molecule, the mixed-controlled adsorption model contains two kinetics parameters: D and 3, where 3 is the energy-barrier parameter representing the rate constant for the adsorption of surfactant molecules from the sub-surface onto the surface. Although the effect of the energy barrier on surfactant ad-sorption at the surface has been accounted for in the mixed-controlled model in terms of the model parameter /, the physical basis underlying the existence of the energy barrier is still unclear [28].
1.2.2 Experimental Investigation of the Kinetics of Surfactant Adsorption
Experimental investigation of the kinetics of surfactant adsorption is typically carried out to iden-tify the applicability of the two classes of models described above. These investigations typically involve measuring the DST of surfactant solutions at different initial surfactant bulk solution con-centrations [29]. Measurement of dynamic surfactant surface concon-centrations has also become pos-sible recently due to advances in the ability to carry out ellipsometry measurements in a dynamic system [30]. Recall that the time scales associated with the kinetics of surfactant adsorption, using different surfactant types and at different surfactant concentrations, can vary between milliseconds to hours [29]. Different experimental techniques are employed to measure DST's depending on the time scales associated with the adsorption kinetics process. In Figure 1-2, I reproduce a chart
published in Ref. [2] that specifies the time windows for DST measurements using various existing experimental techniques.
madximum bubble pressure Sosc.jet
growing
drop
Sincld. plate(drop
pressure
I
drop volume
J
I pendant dropplate or ring tensiometry
I
1
I
I
I
I
I
"
0.0001 0.001 0.01 0.1 1 10 100 1000 10000 time /s
Figure 1-2: Various existing experimental techniques to measure DST and their respective time ranges for measurement (from Ref.[2]).
1.3 Specific Thesis Objectives
With the background provided in Section 1.2 in mind, the central goal of my thesis involves:
The development of novel methodologies to analyze the adsorption kinetics of nonionic surfactants
The specific research objectives of my Ph.D. include:
1. Resolution of a long-standing conceptual contradiction between existing adsorption kinetics models: the diffusion-controlled model and the mixed-controlled model.
2. Development of a new methodology to determine the rate-limiting adsorption kinetics mech-anism from experimental DST data.
3. Development of a novel approach to determine surfactant equilibrium properties from exper-imental DST data.
4. Exploration of a new theoretical framework to design optimal nonionic surfactant formula-tions that exhibit a desired adsorption kinetics behavior.
Below, I provide a brief overview of the key results obtained in each of the specific objectives listed above.
1.3.1 Specific Thesis Objective 1: Resolution of Conceptual Contradiction
The experimental DST behavior of several nonionic surfactants exhibits a vi variation at short-times. Traditionally, the observed
Vi
behavior has been interpreted using the asymptotic short-time analysis of the diffusion-controlled model. As a result of this interpretation, the fundamental physical nature of the energy barrier associated with the adsorption of surfactant molecules from the sub-surface onto the surface has been proposed to be related to high surfactant surface concen-trations.In addressing specific thesis objective 1, I will: (i) point out that the asymptotic short-time analysis of the diffusion-controlled model leads to inconsistent predictions, and conclude that this analysis cannot be used to describe the short-time adsorption kinetics behavior, (ii) demonstrate that the observed short-time
Vi
DST behavior can be interpreted using a nonasymptotic short-time formalism of the mixed-controlled model, and (iii) analyze the consequence of the new interpre-tation and conclude that the energy barrier is associated with the adsorption of a single surfactant molecule onto a clean surface. A detailed account of the resolution of the conceptual contradiction as well as the analysis of the consequence are presented in Chapter 2. A schematic representation of the key contribution made in addressing specific thesis objective 1 is shown in Figure 1-3.Exeirumental Observation -heretca
Int-I
.1
~I
Traditional Interpretation New Interpretation
Behavior of Short-Time DST Data Asymptotic Diffusion- Nonasymptotic
Mixed-Controlled Model Controlled Model Figure 1-3: Specific Thesis Objective 1 -Interpretation of the vi behavior of the short-time DST data -A comparison of the existing interpretation and the new interpretation.
1.3.2 Specific Thesis Objective 2: Development of a New Methodology to Deter-mine the Rate-Limiting Adsorption Kinetics Mechanism from Experimental DST Data
The traditional procedure to determine the rate-limiting adsorption kinetics mechanism (diffusion-controlled vs. mixed-(diffusion-controlled), and the values of the kinetics parameters (D and f) uses[31]: (i) experimental DST data measured at several surfactant bulk solution concentrations, and (ii) a known model for the equilibrium adsorption isotherm of the surfactant. It has been observed that the deduced results are highly sensitive to the choice of the equilibrium adsorption isotherm model of the surfactant[32]. Note that the equilibrium adsorption isotherm models differ in the manner in which they account for the interactions between the adsorbed surfactant molecules [33], and as such, they should not affect the value of D, the bulk solution diffusion coefficient of the surfactant molecule, and 3, which as I will show as part of specific thesis objective 1, is related to the adsorption of a single surfactant molecule onto a clean surface.
In addressing specific thesis objective 2, I will develop a new methodology to determine the rate-limiting adsorption kinetics mechanism (diffusion-controlled vs. mixed-controlled), including deducing the kinetics parameters (D and P) from experimental DST data. The new methodology has the following advantages over the existing procedure used to analyze the experimental DST data: (a) it does not require using a model for the equilibrium adsorption isotherm, and (b) it only requires using the experimental short-time DST data measured at two initial surfactant bulk solution concentrations. A schematic representation of the new methodology developed is shown in Figure 1-4. Equilibrium Adsorptio Isotherm Model +_ __ __
Aspi Kntc
Short-Time Experimental DST DataFigure 1-4: Specific Thesis Objective 2 -New methodology to determine the adsorption kinetics rate-limiting mechanism from experimental DST data.
The development and implementation of the new methodology to determine the adsorption kinetics rate-limiting mechanism of several poly(ethylene) oxide, CiEj, nonionic surfactants are discussed in Chapter 3.
1.3.3 Specific Thesis Objective 3: Development of a Novel Approach to Determine Equilibrium Adsorption Properties from Experimental DST data
In addressing specific thesis objective 3, I will explore a novel approach to determine equilibrium adsorption properties from experimental dynamic surface tension data and the known rate-limiting adsorption kinetics mechanism. Specifically, I will develop a new methodology to determine the Equilibrium Surface Tension vs. bulk solution Concentration (ESTC) behavior of nonionic sur-factants using experimental pendant-bubble DST data when the adsorption kinetics is
diffusion-controlled.
First, I will analyze the experimental pendant-bubble DST data of two nonionic surfactants, C12E4 and C12E6, and will show that the assumption of diffusive transport of the surfactant molecules in the bulk solution is likely valid only for time t <: 100 - 200 s, since for t > 100 - 200 s, the experimental DST data exhibit a 'super-adsorption' behavior. I will then hypothesize the on-set of natural convection in the pendant-bubble experimental on-setup for these nonionic surfactants when t >z 100 - 200. The analysis of the experimental pendant-bubble DST data and the dis-cussion leading to the hypothesis of the onset of natural convection are presented in Chapter 4. Following this, in Chapter 5, I will develop the new framework to determine the ESTC behavior of nonionic surfactants using experimental pendant-bubble DST data when the adsorption kinetics is diffusion-controlled, and will demonstrate the applicability of the new framework by determin-ing the ESTC behaviors of C12E4 and C12E6. A schematic representation of the novel approach is shown in Figure 1-5.
IlU
uilibriu AdsDiffusion-Controlled Adsorption Mechanism
Figure 1-5: Specific Thesis Objective 3: New Approach to determine equilibrium adsorption prop-erties of nonionic surfactants.
1.3.4 Specific Thesis Objective 4: Development of a New Theoretical Framework to Design Optimal Nonionic Surfactant Formulations that Exhibit a Desired Adsorption Kinetics Behavior
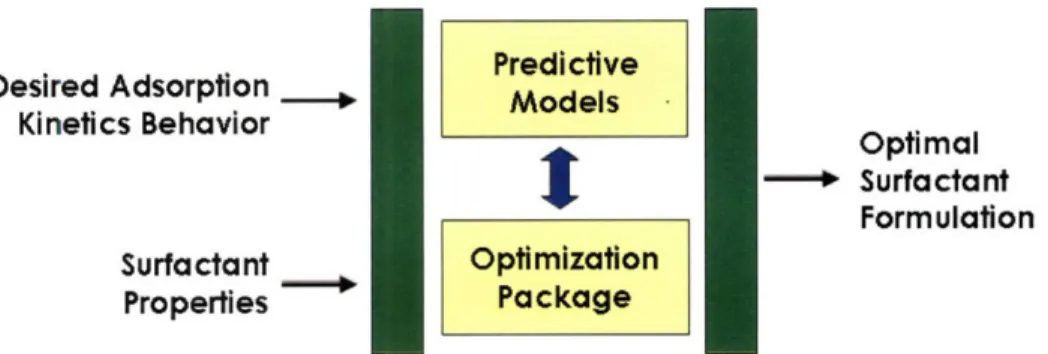
In addressing specific thesis objective 4, I will propose a new theoretical framework to identify the
optimal nonionic surfactant formulation that most closely meets a desired adsorption kinetics be-havior. Specifically, the new theoretical framework poses the design of the surfactant formulation as an optimization problem using predictive adsorption kinetics models, and finds the solution of the formulated optimization problem using numerical algorithms implemented in commercial op-timization packages. As proof of technical feasibility of the proposed new theoretical framework, I will: (a) consider the problem of identifying the nonionic surfactant formulation that optimally sat-isfies a desired adsorption kinetics behavior specified in terms of a desired dynamic surface tension profile, (b) formulate the problem defined in (a) as an optimization problem using the
Mulqueen-Stebe-Blankschtein (MSB) adsorption kinetics model[20], and (c) develop a framework to find the solution of the optimization problem formulated in (b) using the Sequential Nonlinear OPTi-mization (SNOPT) package [34]. Finally. I will demonstrate the effectiveness of the new theoret-ical framework by analyzing a representative case study. The development of the new theorettheoret-ical framework and the demonstration of its utility to design optimal nonionic surfactant formulations are discussed in Chapter 6. A schematic representation of the new theoretical framework is shown in Figure 1-6.
In summary, the remainder of my thesis is organized as follows. In Chapter 2, I discuss the resolution of the conceptual contradiction. In Chapter 3, I discuss the development of a new
Desired Adsorption Kinetics Behavior Surfactant Properties Predictive Models
t
Optimization Package Optimal * Surfactant FormulationFigure 1-6: Specific Thesis Objective 4 - New theoretical framework to identify the optimal nonionic surfactant formulation that most closely meets a desired adsorption kinetics behavior.
methodology to determine the adsorption kinetics rate-limiting mechanism. In Chapter 4, I present an analysis of the pendant-bubble experimental DST data. In Chapter 5, I discuss the development of a new approach to determine equilibrium adsorption properties from experimental DST data. In Chapter 6, I discuss the development of a new theoretical framework to design optimal nonionic surfactant formulations. Finally, in Chapter 7, I summarize the key conclusions of this thesis and discuss possible future research directions.
Bibliography
[1] C. Tanford. The Hydrophobic Effect: Formation of Micelles and Biological membranes.
Wiley-Interscience, second edition, 1980.
[2] J. Eastoe and J. S. Dalton. Dynamic surface tension and adsorption mechanisms of surfactants at the air-water interface. Advances in Colloid and Interface Science, 85:103-144, 2000.
[3] R. H. Notter and J. N. Finkelstein. Pulmonary surfactant: an interdisciplinary approach. Journal of Applied Physiology, 57(6):1613-1624, 1984.
[4] T. J. Mathews, P H. Fay Menacker, and M. E MacDorman. Infant mortality statistics from the
2001 period linked birth/infant death data set. National Vital Statistics Reports, 52(2):1-28, 2003.
[5] Andrew M. Howe. Some aspects of colloids in photography. Current Opinion in Colloid and Interface Science, pages 288-300, 2000.
[6] U. Shavit and N. Chigier. The role of dynamic surface tension in air-assist atomization. Physics of Fluids, 7(1):24-33, 1995.
[7] C-H. Chang and Elias I. Franses. Adsorption dynamics of surfactants at the air/water
inter-face: a critical review of mathematical models, data, and mechanisms. Colloids and Surfaces
A: Physicochemical and Engineering Aspects, 100: 1-45, 1995.
[8] J. E. Valentini, W. R. Thomas, P Sevenhuysen, T. S. Jiang, Y. Liu, H. O. Lee, and S-C. Yen. Role
[9] R R. Garrett and P L. Gratton. Dynamic surface tensions, foam and the transition from micellar
solution to lamellar phase dispersion. Colloids and Surfaces A: Physicochemical and Engineering Aspects, 103:127-145, 1995.
[10] V Schr6der, O. Behrend, and H. Schubert. Effect of dynamic interfacial tension on the emul-sification process using microporous, ceramic membranes. Journal of Colloid and Interface Science, 202:334-340, 1998.
[11] D. A. Edwards, H. Brenner, and D. T. Wasan. Interfacial Transport Processes and Rheology. Butterworth-Heinemann, 1991.
[12] A. D. Nikolov, D. T. Wasan, A. Chengara, K. Koczo, G. A. Policello, and I. Kolossvary. Super-spreading driven by marangoni flow. Advances in Colloid and Interface Science, 96:325-338, 2002.
[13] X. Zhang and 0. A. Basaran. Dynamic surface tension effects in impact of a drop with solid
surface. Journal of Colloid and Interface Science, 187:166-178, 1997.
[14] R. Crooks, J. C-Whitez, and D. V Boger. The role of dynamic surface tension and elasticity on the dynamics of drop impact. Chemical Engineering Science, 56:5575-5592, 2001.
[15] N. M-Candoni, B. P-Foch, E Legay, M. V-Adler, and K. Wong. Influence of dynamic surface
tension on the spreading of surfactant solution droplets impacting onto a low-surface-energy solid substrate. Journal of Colloid and Interface Science, 192:129-141, 1997.
[16] M. von Bahr, E Tiberg, and B. V Zhmud. Spreading dynamics of surfactant solutions. Lang-muir, 15:7069-7075, 1999.
[17] M. J. Rosen and L. D. Song. Superspreading, skein wetting, and dynamic surface tension. Langmuir, 12:4945-4949, 1996.
[18] V N. Kazakov, A. E Vozianov, O. V Sinyachenko, D. V Trukhin, V I. Kovalchuk, and U. Pison.
Studies on the application of dynamic surface tensiometry of serum and cerebrospinal liquid for diagnostics and monitoring of treatment in patients who have rheumatic, neurological or oncological diseases. Advances in Colloid and Interface Science, 86:1-38, 2000.

![Figure 1-2: Various existing experimental techniques to measure DST and their respective time ranges for measurement (from Ref.[2]).](https://thumb-eu.123doks.com/thumbv2/123doknet/14733920.573707/30.918.201.755.197.533/figure-various-existing-experimental-techniques-measure-respective-measurement.webp)