VIII. APPLIED PLASMA RESEARCH
A. Active Plasma Systems
Academic and Research Staff
Prof. L. D. Smullin Prof. R. R. Parker Prof. R. J. Briggs Prof. K. I. Thomassen
Graduate Students
Y. Ayasli J. A. Mangano J. A. Rome
R. K. Linford P. J. McCleer J. M. Tarrh, III M. I. Mirkin
1. DUAL-BEAM PLASMA SOURCE
Introduction
This is a report of the major design considerations for a new plasma source. The source is to produce a steady, warm, highly ionized, moderately dense, hydro-gen plasma. This plasma will enable us to study a variety of low-frequency insta-bilitie s.
At present, Q-machines and Lisitano structures come closer to producing the desired plasma than do other sources. The major limitation of the Q-machine plasma is that the effects of electron and ion temperatures on the low-frequency phenomena cannot be studied because the temperatures are very low and the ions are massive. The plasma produced by a Lisitano structure is very sensitive to the magnetic field. Thus it is very difficult to investigate the effect of the magnetic field on a plasma instability. A commonly observed limitation of the Lisitano struc-ture is that the plasma density is so limited that the electron plasma frequency is less than or equal to the electron-cyclotron frequency. The new source should
elim-inate all of the mentioned deficiencies.
The expected maximum plasma parameters of the new source include: density, 12 -3
10 cm ; T 15 eV; and T. z 1 eV. The neutral gas pressure will be
approx-e 1
imately 10 Torr to yield an ionization of approximately 70%. The maximum mag-netic field available is 3 kG.
The discussion of the plasma system is divided into two main parts: the plasma source, and the plasma confinement region. In most plasma sources, the region of plasma generation is not suitable for studying low-frequency instabilities, wave-wave interaction, and so forth, because of the low percentage of ionization and generally turbulent nature of the plasma in this region. Therefore the "source" and the region
This work is supported by the National Science Foundation (Grant GK-18185).
QPR No. 101 115
(VIII. APPLIED PLASMA RESEARCH)
where the plasma is studied must be considered two separate parts of the system. The plasma source that has been chosen is a beam-plasma discharge (BPD) which can produce a dense, warm plasma without the sensitivity to magnetic field exhibited by the Lisitano structure.
The confinement region has been designed to achieve two objectives. First, the plasma coming from the source must be differentially pumped to achieve low neutral pressure. Second, the system is made longitudinally symmetrical to eliminate the rapid drift of the hydrogen plasma inside the confinement region.
Regardless of the method of plasma production in an open-ended system, the plasma tends to drift out of the system at about half the ion sound speed; that is, vd kTe/m . For the projected parameters of the system, the transit time of the hydrogen plasma through a 1-m drift tube is approximately 20
ps.
Since this tran-sit time is comparable to or less than the characteristic times of important low-frequency instabilities, the drift seriously affects their behavior. This drift should be greatly reduced in the confinement region by making it symmetrical. The effect of this drift is not as severe in argon or alkali-metal plasmas, because of the larger ion mass.Source
The plasma source (Fig. VIII-1) comprises an electron-gun assembly, a plasma generation chamber, and an electron-beam collector. The inverted, magnetron-injection gun emits a hollow cylindrical beam, 2. 5 cm in diameter and 1 mm thick, into the generation chamber where it interacts with the injected hydrogen gas. The hollow beam is stopped by the beam collector to allow the central core of plasma
H2 GAS FEED
PUMP
ELECTRON -GUN ASSEMBLY ELECTRON - BEAM COLLECTOR
GENERATION CHAMBER
SCALE 10 cm
Fig. VIII-1. Plasma source.
QPR No. 101
(VIII. APPLIED PLASMA RESEARCH)
to stream through the hole in the annular collector.
An initial test of the plasma source has been made, using a standard magnetron injection gun like the one described by Mangano and Smullin in Section VIII-A. 2. The test was successful in generating a plasma with n = 1011 and T = 15 eV. The density was limited by the severe but expected thermal load on the cathode.
The electron gun shown in Fig. VIII-2 has several advantages as a plasma source over the standard magnetron gun. The major source of heat, which limits the stan-dard gun, came from bombardment of the cathode by plasma ions. The ion collector in the gun assembly is designed to pull the ions out of the plasma before they can reach the cathode. There are three basic advantages with this arrangement:
1. The energy is deposited on the ion collector which can be easily water-cooled.
2. Less power is wasted, since the potential on the ion collector need not be as large as the cathode.
3. The cathode and its power supply are isolated from the plasma, thereby per-mitting entirely independent control of the electron-beam parameters.
Two additional advantages have been built into the gun assembly. The anode in
SCALE PORT
5 cm
Fig. VIII-2.
Electron-gun assembly.
(VIII. APPLIED PLASMA RESEARCH)
the electron gun can be biased to give independent control of beam energy and
per-veance.
The ion collector anode can be biased slightly negative so that the end of
the rod acts as a planar probe biased in the ion saturation region.
Therefore, if
the electron temperature is known, the plasma density can be easily determined.
Also, when the ion collector anode is biased in the ion saturation region, it should
improve the radial uniformity of the plasma by reflecting electrons and hence
decreasing axial plasma losses in the neutral-core region.
For the ion collector to work effectively, four criteria must be met.
First, the
radial electric field in the gap between the ion collector and its anode must be large
enough to establish an ion Larmor radius larger than the thickness,
1,of the plasma
shell. In terms of the voltage, Vi, on the ion collector, this condition is satisfied
2 2
in the absence of plasma if V.
>
2B
T,
where B is in kG,
T
in mm, and V. in volts.
1 1
The second condition is that the electric field must be capable of penetrating
the plasma in the gap between the ion collector and its anode.
This condition can
exist if the Debye length of the plasma is greater than
T(which is generally not
the case), or if the electric field is large enough to deplete the ions from the gap
as rapidly as the plasma can supply them, and thus not allow a plasma to exist in
the gap.
This condition can be compared with a cathode in temperature-limited flow.
The plasma in the generation chamber acts as an ion emitter capable of supplying
a current density Jm, which is dependent on the density and electron temperature
of the plasma.
If the voltage on the ion collector exceeds the value Vm, which is
related to Jm by the Child-Langmuir law for space charge-limited flow,
"temperature-limited" flow is achieved.
For this condition in planar geometry significant space
charge cannot exist and thus plasma cannot exist in the gap.
Because of the
cross-field geometry of the system, a plasma can exist in the gap near the generation
chamber end of the ion collector, but the plasma must be completely depleted at
the cathode end.
This calculation results in the following condition:
V2 n) 2/3
kTe 1/3
V. > 250 72
1 f/ e
12
-3
The plasma density n is in units of 10
cm
,
Tin mm and the length of the ion
collector f in cm.
For the plasma parameters under consideration this second
con-straint on the ion collector voltage is the dominant condition.
It is now apparent
why the gap thickness
Tis kept as small as possible.
The third constraint is that the beam electrons should not be deflected into the
ion collector anode by the electric field.
This establishes the following upper bound
on the voltage V.:
13
22
V. < 10 B T 1QPR No. 101
118(VIII.
APPLIED PLASMA RESEARCH)
The fourth and last constraint on the ion collector is that it must be capable of dissipating the energy deposited by the ions. The power in kW is given by
P
= X 10 nD( ) 1/2 > 0.12 3n 5 / 3 D kTe) 5/ 6e 1
2/3
e
where the inside diameter, D, of the ion collector is in cm. Because of the strong dependence of P on T and n, a safety factor of at least 10 should be included. For the maximum plasma parameters, this requires the anode to handle approximately 20 kW of power. By machining special finned water channels in the ion collector, this can be accomplished with standard water-line pressures of 40 psi.
Constraints imposed by electrical connections and water cooling forced us to adopt the present inverted cathode design. As can be seen from Fig. VIII-2, the electrons are emitted radially inward from the cathode surface as opposed to the usual magnetron-injection gun.
The pumping port in the gun assembly maintains a lower gas pressure in this region than in the plasma-generation chamber. This prevents significant plasma genera-tion in the gun assembly.
The main design consideration of the plasma-generation chamber is its length. Data obtained by Mangano and Smullin show that the major beam-plasma microwave interaction occurs within 25 cm of the gun. Thus making the plasma generation chamber longer than -25 cm would serve no purpose.
The electron-beam collector is tapered to increase the impact area of the elec-tron beam, thereby reducing the local heating. It is water-cooled in the same man-ner as the ion collector and can handle a 5 kW beam with a safety factor of 8.
Confinement Region
The entire system including the confinement region is shown in Fig. VIII-3. The system is symmetrical and requires two identical plasma sources. The differential pumping regions are designed to maintain a factor of 15 difference in pressure between the generation chambers and the drift region without a plasma. The plasma will decrease the flow of neutral gas into the drift region, but recombination on the walls of that region may offset the decreased flow. For a neutral pressure of 2 X
-4
-10- 4 Torr in the generation region, a neutral pressure of the order of 10- 5 Torr is expected in the drift region.
The system is symmetrical to reduce the drift of the plasma in the confinement region. If radial losses are ignored, the axial drift in this region should be zero.
This can be explained by examining the self-consistent solution of the zero-order potential, density, generation rate, and loss rate of the plasma. The work done by
QPR No. 101
(VIII. APPLIED PLASMA RESEARCH)
Dunn and Selfl has been extended by Linford.2
The results indicate that in a region of plasma generation, the potential is larger kTe
than it is near the axial boundaries of the plasma by a - , where a - 1. In a region where there is no plasma generation, but is bounded on one end by a
plasma0
-TO PUMPS
BAFFLE CENTRAL DRIFT REGION
GAS FEED ELECTRON- BEAM DIFFERENTIAL PLASMA GENERATION
ELECTRON - GUN COLLECTOR PUMPING REGION CHAMBER ASSEMBLY
SCALE 25 cm
Fig. VIII-3. Symmetrical plasma system.
generation region and on the other by a sheath and a wall, the potential is axially kTe
uniform and a - is less than in the generation region. The potential drop between e
the generation region and the drift region provide the ions with the well-known drift vD ~ ]kTe/m. This drift given to the ions is necessary to satisfy the Langmuir
3
sheath criterion at the wall boundary, that is, to preserve ambipolar loss. If, how-ever, the drift region is bounded on both ends by symmetrical plasma generation regions, and if radial losses are ignored, then no net loss from this region occurs in the steady state. Under these conditions, it can be shown that the potential in this central region is the same as in the generation regions and hence no drift occurs.
The radial loss in the drift region will be much smaller than the axial loss from an unsymmetrical, one-source system, but the loss will not be zero. The expected result of finite radial loss is a slight potential depression in the drift region, which results in two slowly contrastreaming plasmas. The magnitude of this drift has not been calculated because the radial loss rate is not known.
QPR No. 101
(VIII. APPLIED PLASMA RESEARCH)
One potential problem with this method of decreasing the axial drift, is that the plasma-generation rate in one source is not entirely independent of the other source. This coupling between the two sources through the plasma electrons can lead to a
",generation" instability. Some stabilizing mechanism will probably be needed to avoid this problem. The most likely approach is to control the beam power with a simple feedback system.
The plasma system is being assembled at the present time.
R. K. Linford, L. D. Smullin
References
1. D. A. Dunn and S. A. Self, "Static Theory of Density and Potential Distribution in a Beam-Generated Plasma," J. Appl. Phys. 35, 113 (1964).
2. R. K. Linford, "Ion Energy Analysis in a Beam-Plasma Discharge," S. M. and E. E. Thesis, Department of Electrical Engineering, M. I. T. , 1969.
3. G. Suits (ed.), Collected Works of Irving Langmuir, Vol. 5 (Macmillan Company, New York, 1961).
2. MICROWAVE INSTABILITIES IN A BEAM-PLASMA DISCHARGE
Introduction
In this report, we shall present experimental data obtained recently in our study of the beam-plasma discharge (BPD). Detailed measurements of the microwave fre-quency spectrum of the self-generated oscillations have been made and correlated with the interaction between the negative energy, slow space-charge wave supported by the electron beam and the electron plasma wave. In an axially uniform, static magnetic field, this intense microwave interaction has been found to grow exponen-tially, saturate, and decay in an axial region of approximately 15 cm directly in front of the electron gun. This axial profile of RF amplitude exists, although the plasma column is 70 cm long. Measurements of the beam and plasma densities, plasma electron temperature, wave number spectrum, and axial growth rates for the interaction are also given. We hope that these data, together with data to be obtained, will lead to a coherent, quantitative understanding of the microscopic pro-cesses involved in sustaining and heating the BPD.
Description of the Experimental Apparatus
Figure VIII-4 is a schematic diagram of the experimental apparatus (system C) , including the orientation of the four probes used in making the measurements to be described here. Those labeled P1 and P2 are axially movable and, together with
a motor drive, were used primarily in making RF measurements. The probe labeled
(VIII. APPLIED PLASMA RESEARCH)
Boz(z)
LANGMUIR PROBE
MAGNETRON INJECTION GUN P P4 VACUUM PUMPS
SVACUUM PUMPS
BEAM COLLECTOR P3U
,LANGMUIR PROBE B P4 P3 2N P R RF OR LANGMUIR PROBES 0 25 50 75 (cm)(a)
(b)
Fig. VIII-4. (a) Beam-Plasma Discharge apparatus. (b) Gun view of the RF and Langmuir
probes.
P3 is movable axially or azimuthally, with a motor drive. The fourth probe, P4, was moved radially with a micrometer head drive to determine Langmuir probe character-istics as a function of radius. All of these probes were constructed from semirigid coaxial line (0. 141 in. O. D.) with 0. 015 in. holes drilled in the center conductors to accommodate 0. 015 in. O. D. tungsten wire extensions of the center conductor. An outer jacket of 0. 25 in. O. D. (0. 030 wall) stainless-steel tubing was used on each probe to improve the rigidity of the probe structure. Since the teflon insulation used in the coaxial line provided a vacuum seal between inner and outer
ANODE
RADIATION
SCATHODE SUPPORTS
ION CURRENT
______________________SHIELD
Fig. VIII-5.
Magnetron injection gun structure.
QPR No. 101
122
(VIII. APPLIED PLASMA RESEARCH)
conductors, this probe construction technique insured a low VSWR, as seen from the probe tip looking back through to the signal-processing equipment.
In the experiments described here, the magnet system was used to produce a uniform axial magnetic field of between 800 G and 1200 G over the entire length of the discharge region. The vacuum system, which has been described elsewhere, produced a base pressure of ~5 X 10- 7 Torr. During system operation the dis-charge chamber was filled with hydrogen gas to pressures of between 0. 5 Torr and
-3
1. 0 X 10-3 Torr.
The magnetron injection gun, shown in Figs. VIII-4 and VIII-5, is composed of an oxide-coated nickel cathode, a copper anode, and two shields with supports. The ion current shield prevents plasma ions from drifting back into the cathode struc-ture and loading down the voltage supply for the gun. This shield is a molybdenum disk, 3 mil thick, supported by thick molybdenum vanes, 3 mil thick and 0. 15 in. wide. The radiation shield is used to prevent some of the radiation emitted from the cathode from heating the probes. The gun produces a hollow electron beam (r ~ 1. 15 cm and t = 1 mm), with a perveance ~8 iperv in vacuum. The electron gun is normally pulsed on for a period of 700
ps
at a repetition rate varying from1 to 5 pulses per second. The cathode voltage is variable up to 10 kV.
Figure VIII-6 shows the angular distribution of beam current coming from the
0 40 80 120 160 200 240 280 320 360
9 (deg)
Fig. VIII-6.
Electron beam current vs azimuth. Operating conditions:Vk = 4. 6 kV B = 940 G -7
I = 2. 5A P = 5 X 10 Torr.
(VIII.
APPLIED PLASMA RESEARCH)
electron gun at an axial position 5 cm from the ion current collector.
This curve
was obtained by rotating probe P
3azimuthally and recording the voltage developed
across a 50 Q resistor at the probe output.
The six dips in the current at various
0 are caused by the six vanes supporting the ion current collector.
One of these
supports (at 0 ~
3200)
is twisted, thereby resulting in the broader dip seen at its
angle.
The positions of probes P
1, P2, and P4 are also shown in Fig. VIII-6.
Plasma Density and Electron Temperature Measurements
The radial profiles of the time-averaged electron density and temperature have
been measured as a function of radius and are plotted in Fig. VIII-7.
These
mea-surements were made with probe P
4at the axial position z
=
5 cm.
As seen from
the data, the plasma column is annular in cross section and is confined to within
a few millimeters of the annular electron gun. The electron temperature, however,
appears to peak twice at radii just inside and outside the plasma annulus and to
decrease monotonically outside these peaks.
An interesting explanation for the measured transverse profile of the electron
temperature can be hypothesized.
Because the plasma column is radially
inhomo-geneous, the cold-plasma, long-wavelength mode excited in the beam region can couple
o o E o x m 10 15 20 25 r (mm)
Fig. VIII-7.
Electron temperature and density vs radius.(VIII. APPLIED PLASMA RESEARCH)
to the hot plasma, short-wavelength, Bernstein-like mode at radii where the fre-quency is equal to the local upper hybrid frefre-quency. 2 - 6 This short wavelength mode is rapidly damped with its wave energy being converted to random electron energy (that is, electron temperature). This picture would predict increased electron tem-perature in regions just inside and outside the electron beam annulus where the coupling occurs. This prediction is consistent with and may possibly be connected with the apparent increase in electron temperature at radii just outside the peak in the radial density profile.
The electron temperature and density profiles shown here were measured at an axial position well before the beam-plasma interaction had grown to its saturated value. Thus far it has not been possible to measure this profile as a function of z because a probe movable in both radial and axial directions has not been built. We are now building such a probe, however. The data from this probe should
indi-cate whether (i) the plasma annulus increases in thickness, which would result in a decrease in ki, (ii) the peak plasma density varies significantly in z; and (iii) the peaks in electron temperature at radii adjacent to the plasma annulus are accen-tuated at axial positions where the beam-plasma interaction amplitude is large.
Frequency Spectrum Measurements for f > f
The time-averaged frequency spectrum of microwave power emitted from our BPD is plotted in Fig. VIII-8 for one set of operating conditions. Eventually we shall show that the oscillations are self-generated by the interaction between the slow space-charge wave of the electron beam interacting with the propagating plasma wave near f . The wideband nature of the spectrum sample shown in this figure
pe
is due to fluctuations (in time) of the electron plasma density, and consequently of the electron plasma frequency (f pe) during the many successive RF pulses in the averaging period. 7
Figure VIII-9 shows plots of the plasma density and electron temperature as a function of the instantaneous frequency of the self-generated oscillations. These data were obtained by measuring the Langmuir probe characteristic during the most intense
bursts of radio frequency at a given frequency. Langmuir-probe curves were thus obtained as a function of the instantaneous frequency. The data shown in Fig. VIII-9 were then extracted from these Langmuir-probe curves. From these data we con-clude that the instantaneous frequency of the self-generated oscillations is approxi-mately given by the instantaneous value of the electron plasma frequency adjacent to the beam region if f > f c e and fpe f, 2fce.
e
p
e
ce
ce
The measured spectra in the frequency regime f > fee are also characterized by minima at frequencies f = nfce, where n = 1, 2,3. The frequency of these minima
Fig. VIII-8.
Vk =3 kV Ik =2A B =860 6 <n>t=8x 10" cm 3 f [gHz]Time-averaged frequency spectrum of microwave oscillations.
Electron cyclotron harmonics are shown.
7.5 -/0
. O
DATA POINTS: 0 BEST FIT .= 2 CURVE: -. DATA CORRECTED FOR TEMPERATUREVARIATION wITH DENSITY
A /
/
I/IS/
0 S Ii r S 1 2 3 4 (0) O0 0 0 0 ° 0 0.. 21 I iI 31 I I h 3 4 5 6 f GHl] (b) I I 7 8 9 10Fig. VIII-9.
(a)
(b)
Electron density as a function of frequency.
Electron temperature as a function of
frequency.
QPR No. 101
a
I i I I I I I II I II
I
1_*
_
_ C'
E 5.0 2.5 5 6 7 8126
(VIII. APPLIED PLASMA RESEARCH)
are plotted in Fig. VIII-10 as a function of the measured, static magnetic field, B0o
The equations of the lines drawn through the plotted points are given by fn = neBo/me where n = 1, 2,3. These minima are interpreted as being caused by electrostatic
electron-cyclotron damping of the primary beam-plasma interaction when the instan-taneous frequency (-fpe) is near nfce . The detailed structure of the frequency spec-trum in regions between the electron-cyclotron harmonics is strongly dependent on the axial position of the probe used to measure the spectrum. In fact, the minima in the frequency spectrum shown in Fig. VIII-8 may be explained by the different
axial growth, saturation, and decay profiles of the RF amplitude at different fre-quencies. We shall show that the growth rate for the interaction is minimum near cyclotron harmonics and maximum between. Therefore the relative minima between cyclotron harmonics observed in Fig. VIII-8 may mean that the oscillation amplitude has grown and already decayed at these frequencies and position.
Wave-number Measurements for f > f pe ce
Figure VIII-11 illustrates a typical curve of RF intensity at a given frequency (f>fce ) vs axial distance. It shows the exponential growth out of noise, saturation, and rapid decay within a relatively short distance. Curves like Fig. VIII-11 were taken at frequencies over the range covered by Fig. VIII-9, and the exponential growth
rates were determined (before saturation). Figure VIII-12 shows what we interpret as Im (kll) as a function of frequency. The pattern of growth from a noise level at z = 0 to saturation clearly indicates a convective instability. This result, ir, turn, implies that the electron plasma wave with which the slow space-charge wave on the beam interacts is a forward wave at the point of synchronism. Figure VIII-12 also illustrates the effects of electrostatic electron-cyclotron damping of the beam-plasma interaction at harmonics of the electron cyclotron frequency.
Figure VIII-13 is a plot of the measured real part of the wave number; k , r against frequency. Also shown in this figure is the wave number vs frequency char-acteristic of the slow charge electron beam wave (dashed line), with the space-charge reduction factor neglected. The proper electron beam-plasma frequency (fpb) was determined from our measurement of the electron beam density (Fig. VIII-6) in the region near probes P1 and P2. Figure VIII-12 illustrates clearly that the interaction
of the plasma with the beam is through the slow space-charge wave of the beam, and not the slow cyclotron wave.
Figure VIII-14 is a chart recording of an interferogram produced by the balanced mixing of signals from a fixed and an axially moving probe (probes labelled P1 and P2). Such curves were used to produce Fig. VIII-13. In our first attempts, we were
unable to detect any such interference pattern. We finally discovered that the two
Fig. VIII-10.
Measured magnetic field plotted against the
fre-quency.of the minima in the measured frequency
spectra for 3 different axial magnetic field
ampli-tudes.
9 10 1 DISTANCE FROM GUN [cm]
(a)
6 9 10 11 12 13
(b)
Fig. VIII- 11.
(a) Relative power in oscillations at f
=
3. 85 GHz vs
axial distance from the electron gun.
(b) Relative power in oscillations at f
=
3. 85 GHz
before axial saturation vs axial distance from the
electron gun. Operating conditions:
V =4.6 kV
k
3.6
A
k
B
=
O940 G
-4P = 7. 2 X 10
Torr.
oQPR No. 101
- C I
I
~ 5
I _____ -2 3 4 5 6 7 a 9 fI gaz]128
0.5 --DATA POINTS: O 0.4 --0.3 H-0.2 h I ce
I
I
I
I
I
I
3fce 0 1 2 3 4 5 6 7 8 9 f (GHz) Fig. VIII-12. 14 -12 10 8 6 4 2Imaginary
conditions
part of the axial are the same as
2T (f +fpb) k Ir
Ir vb
O DATA POINTS
wave number vs frequency.
for Fig. VIII-11.
/ O 7 /0
/
O
/O
7 70 7Z -1 0 1 2 3 f (GHz)Fig. VIII-13.
Real part of the axial wave number vs frequency.
conditions are the same as for Fig. VIII-11.
QPR No. 101
129
Operating
Operating
(VIII. APPLIED PLASMA RESEARCH)
POSITO )OF FIXED PROBE
Fig. VIII-14. Interference pattern between probe P 1 fixed at z = 9 cm and probe P2 plotted against the distance of the probe P
2
from the electron gun. Operating conditions are the same as for Fig. VIII-11.
15 -27 (f+f b k r f v b - DATA POINTS O f = 6 GHz 0__ 0 0 0
O '
O
4 5 6 7 8 9 10 3 Vk(kV)Fig. VIII-15.
Real part of the axial wave number vs beam voltage. Operating conditions: B = 940 Gauss; P = 7. 2 x-4 o o
-40 Torr.
10
Torr.
probes must be at very nearly the same azimuthal position in the cross section in order to have coherent signals.
Finally, Fig. VIII-15 is a plot of k11 against Vk, the gun cathode voltage, at a
r
fixed frequency of 6 GHz. Also shown in this figure is a plot of the relationship between Re (k 1 ) and Vk for the slow space-charge wave on the electron beam (dashed
line). Again the proper electron beam plasma frequency (fpb) was determined from our measurement of the electron-beam density (as in Fig. VIII-6) in the region near probes P1 and P2" The slight bow in these curves is caused by the increase in fpb with the cathode voltage (fpb a Vk1 /2 ). Figure VIII-15 shows that the interaction of
the plasma with the beam is through the slow space-charge wave of the beam at Vk from 4 kV to 8 kV in our discharge.
J. A. Mangano, L. D. Smullin
QPR No. 101
130
DISTANCE FROM GUN [ • 8 9 IO
(VIII. APPLIED PLASMA RESEARCH)
References
1. J. A. Mangano, "Excitation of Ion Cyclotron Waves in a Beam-Generated Plasma," S. M. Thesis, Department of Electrical Engineering, M. I. T. , 1968.
2. R. J. Briggs and S. F. Paik, Int. J. Electronics 23, 163 (1968). 3. L. D. Pearlstein and D. K. Bhadra, Phys. Fluids 12, 213 (1969). 4. S. J. Buchsbaum and A. Hasegawa, Phys. Rev. 143, 303 (1966). 5. D. E. Baldwin, J. Plasma Phys. 1, 289 (1967).
6. V. Kopecky, et al. , J. Plasma Phys. 3, 179 (1969). 7. M. Seidl and P. Sunka, Nucl. Fusion 7, 237 (1967).
3. STABILITY THEOREMS WITH VELOCITY SHEAR
MAGNETIC FIELD In previous reports, 2 we ELECTRO ELECTRON BEAM CONDUCTING V, (0=o) o (r) L Fig. VIII-16.
Geometry of the problem.
FOR AN ELECTRON BEAM IN A LARGE LONGITUDINAL
have considered the stability of a cold electron beam in an infinite longitudinal magnetic field. We have now generalized this to the case of a cylin-drical electron beam focused by a large 2 o>> DC magnetic field, B0. In general, the
equilib-rium electron velocity and density are functions of the radius, r. We consider equilibria for which the beam is unrippled, so that v0z and
v06c = 2r are the only nonzero components of the velocity. This geometry is illustrated in !ALL
Fig. VIII-16.
Because co is large, the small-signal per-pendicular velocity is approximately v1 1
2
(E XB )/B . Under this assumption, the equa-tion obeyed by the small-signal potential can be easily derived.3 2 k d 1 d 2 2 2 pz d r dr 2 2 kcj
r
=O o. (1) r c dIn deriving this equation, we assume that
(VIII.
APPLIED PLASMA RESEARCH)
small-signal quantities vary as exp[j(wt-kz-fO)]. Primes denote differentiation with respect respect to r, wc - qB0/m, and wd -w - kv0z - , a complex function of r.
To test the stability of this system, we assume real values of k and f and try to find complex values of w for which eigenfunctions,
4,
exist that satisfy the boundary con-ditions.In general, this analysis must be performed numerically. This numerical work can be aided considerably, or even avoided, if we perform some preliminary math-ematical analysis in an attempt to answer two questions.
1. Are there certain values or functions that the equilibrium quantities can assume which are sufficient to ensure stability?
2. If the system is potentially unstable, can we limit the possible values of w to some finite region of the complex w-plane?
We shall employ various techniques used in the study of fluid hydrodynamics 4 5 in this attempt. The basic method is to obtain quadratic forms that can be used to bound complex w.
In Eq. 1, let [(r)
= [d(r)] -n
4(r).
To place the resulting equation in self-adjoint form, multiply by i: and integrate from r = 0 to r = b. The result is
b
(1-n)
2dr
0
+
Y
2 dr
(1-n)(kynz+JQ
0
)dkF
-dn + rn(l-n)(kv+
+w
) 2-Zn
+ (1-n)(kvb +f
')
1-Zn+ ro
Z
- 2n
(-+
k2)
r2 2 -2n
vOzp
1-
(n-rk Wpd
kr
+
0.
(2)d
This transformation requires that the velocity be defined in the space between the beam edge and the wall. We define this as the velocity that an electron would have if it were located in this region.
We now choose particular values of n to enable us to cast the imaginary part of Eq. 2 in various useful forms.
QPR No. 101
(VIII. APPLIED PLASMA RESEARCH)
1
If n = - and i # 0, the imaginary part of Eq. 2 is
1
- (kv +ff)
2 22z
- k(1
krVOc o dc r dr= 1cd I r dr ' + + k . 0 r(3)
But, if we use the calculus of variations, we can show that for any L which is zero at r = b, is finite otherwise, and for which r ' = 0 at r = 0,
(4) k2 + (/
/b)2
b 2 r dr<
r dr2
+(
+ ki2)
In this formula, 'i is the first zero of the Bessel function inequality, it follows that somewhere in the region 0
<
r - b2 c)d 2 2 i o d 2 < 1
By using this
1 (kv '2 22(
4 Oz p krwc k2 + ('l I/b) Z max { (kv +f 7') - k 2 W '1 ( r z)k
+ (
l /b)
Equation 6 implies that a sufficient condition for stability is that everywhere
1- (kvz + ')2 < k22
-4 OZ p kr c "
(7)
(5)
If the system is unstable, then the eigenfrequencies must be confined to the region
shown in Fig. VIII-17.
In particular, in Eq. 7 we can let
I
= 0 (or equivalently Ic
-
co)
and obtain
our previous result
1that a sufficient condition for stability is that everywhere
Oz
Wp
QPR No. 101
133' b
0
(VIII. APPLIED PLASMA RESEARCH) max {(k, + 2_k, 22
Au
k2 + ( /b)2 r Iv oz krucFig. VIII-17. Locus of unstable w.
Furthermore, where
k >2'
T
2c
p
if VOz -0, we obtain the result that the beam is stable if
every-This equation is equivalent to one derived by Linson6
for the case of a slab beam with constant density.
n= 0
If we set n = 0 in Eq. 2 and take the imaginary part, we can solve for w :r
2r(kv0 +Q)
L,~
2+ f2+ r k2) L2dr +(4+
k2 I dr~2
P)
r(kv' +k2) +
I
dr
Ozcj
b
2
0 2r[)
+
+
+k2
,l2
dr
rBy using Eq. 4, we can bound
or
so that it lies in the range
QPR No. 101
j
b
0
r b 2r 0sb l2
I
134min
{kv
0z+12} - mpvTi
< max {kv0 + 2} - mny
(VIII. APPLIED PLASMA RESEARCH)
T z'
b
1
br
d
r(ky' +
')
+
-7
r
b2<drL
Oz
cJ k
2b
2,
2
r
dr dr
r(kvz+f
7)+
3Oz
2 ) -C
1 b2 2 + In this equation we have definedmnv = min {minimum negative value, 0} mpv = max {maximum positive value, 0}.
n= 1
Finally, let n = 1 and take the imaginary part of Eq. 2:
2
-2rw (W -kv -fQ)1p r
Oz
Oz )+ l
dl
c1=
0.
(10)
If Wi 0, a necessary condition for instability is that somewhere in 0
<
r<
b2 2
2k 2
(W -kv-&S)
p r
Oz
kv'
Oz
+ krw )d
12r
o.
We can solve this for
ar
- kv -PT2:
2
kw p(krwc -
evz
)p
c
Oz )
r
v
0z2
(
2 ±(00
Since o - kvOz -
ftQ
must be real, we obtain the boundkc p(krw -tv )
p
c
OZ
o. < max
1Similarly, by solving for it must follow that
Similarly, by solving for wi, it must follow that
QPR No. 101
(9)
i
li
2
dr
wd14
(11)
(12)
(13) 135(VIII. APPLIED PLASMA RESEARCH)
2k
2P(krwc -vz' min{kv
0 z+2} - mpv 2 rp
r2kc (krw
c -v'
z )<
max
{kv0
z+&1}
-mnv
2 '
Again, some previously known theorems are included here.
In Eq. 11,
let k = 0.
Then the Rayleigh inflection point theorem will result. It states that a necessary
con-dition for instability is that somewhere in the beam
(w 2 ), S- 0. r
Also, if we let k
=
0, we obtain our previously proved theoreml that a necessary
condition for instability is that somewhere in the beam
Or - kv
= 0.
For practical use in the general case, Eq. 6 yields the most easily obtained and
tightest bounds for use in numerical work.
The other theorems, while of interest,
are presented here primarily to illustrate the techniques used so that they may be
applied to other problems.
J. A. Rome
References
1.
R. J. Briggs and J. A. Rome, "Stability of Electron Beams with Velocity Shear,"
Quarterly Progress Report No. 90, Research Laboratory of Electronics, M. I. T.,
July 15, 1968, pp. 106-107.
2.
J. A. Rome and R. J. Briggs, "Stability of Electron Beams with Velocity Shear,"
Quarterly Progress Report No. 97, Research Laboratory of Electronics, M. I. T.,
April 15, 1970, pp. 69-76.
3.
I. I. Zhelyazkov and A. A. Rukhadze, "Instability of an Electron Beam with a
Veloc-ity Gradient," Soviet Phys.
-
Tech. Phys. 15, 188 (August 1970).
4.
P. G. Drazin and L. N. Howard, "Hydrodynamic Stability of Parallel Flow of
Invis-cid Fluid," Advances in Applied Mechanics Vol. 9, p. 62, 1966.
5.
D. D. Joseph, "Eigenvalue Bounds for the Orr-Sommerfeld Equation," J. Fluid
Mech. 33, Part 3, 617-621 (1968).
6.
L. M. Linson, "Space Charge Waves in Non-neutral Bound Plasmas," Bull. Am.
Phys. Soc. 13, 1497 (1968).
(VIII. APPLIED PLASMA RESEARCH)
4.
DIRECT CONVERSION OF CHARGED-PARTICLE
ENERGY FROM ENERGETIC PLASMAS
Introduction
The development of efficient methods for the conversion of charged-particle energy
to electrical energy would have important consequences in the controlled-fusion
pro-gram. 1,2 A basic difficulty in direct conversion from fusion plasmas is the broad
range of energies present in the escaping plasma particles; a system must be devised
that will remove a substantial fraction of the particle's kinetic energy, even though
the initial energy of individual particles varies considerably.
In this report we consider a scheme based on the interaction of a tenuous plasma
3
stream with a traveling wave set up by a lumped-element transmission line.
Pri-1,2
marily, we have in mind the plasma regimes of current interest for mirror machines,
8
-3
namely plasma densities just beyond the mirror throat of the order of 10
cm
average ion energies (T
i) of several hundred kilovolts, and electron temperatures
T
~ 0. 1 T..
(The basic ideas, of course, could be applicable to a variety of
con-e 1
figurations and plasma regimes.)
In this low-density, high-temperature regime, a
quasi-electrostatic wave with a phase velocity much less than the electron thermal
speed can penetrate a significant distance into the plasma (of the order of 0. 5 m or
so). The plasma escaping from the mirror (B
-
100 kG) is adiabatically brought out
into a weaker field region (B ~ 1-10 kG); and the perpendicular ion energy is thereby
converted almost entirely into parallel energy.
The plasma flow is now located
inside a decelerating traveling potential well set up by the transmission line; the
initial phase speed of the wave is synchronous with the fastest ions in the
distribu-tion.
As we progress down the system, the wave speed slows down while the
ampli-tude of the potential well builds up; the decelerating well therefore "sweeps down"
the ion velocity distribution, trapping the ions and slowing them down to a much
lower velocity.
The electrons are never synchronous with the wave; however, their
average energy is much less than the ions and need not be recovered, since in
equi-librium the flow must have (ve) = (vi) and equal densities.
This scheme does require plasma densities that are low enough to allow
elec-trostatic fields to penetrate the plasma.
In a higher density regime, we might
consider using a traveling "magnetic well" with the equivalent potential
=
-pB
(i. =
mag-netic moment).
This intuitive picture of energy recovery by a decelerating wave is verified by
the following analysis, and criteria for the necessary tapering of the potential
ampli-tude and phase velocity of the wave are derived.
(VIII. APPLIED PLASMA RESEARCH)
Deceleration of Particles by a Traveling Potential Well A nonrelativistic particle of mass m
dimension, z, by a large magnetic field. Em(z), and its phase velocity, v(z), have equation of motion is
and charge q is confined to motion in only one The magnitude of the traveling electric field, adiabatic spatial variation properties. The
z(t) = -
m
Em
(z) sin#,
wherez
Sdz' Sz
0v('
t + z0v(z')(1)
and the initial conditions are z(o) = zo, z(o) = v po and 4(o) = , the initial phase rela-tive to the wave. We define normalized variables
Wz t = t, z- COZ
v( o)
v(z)
v(z)
-v(O)
qE (z) y(z) = mcv(z)In terms of these variables, Eq. 1 can be written in the form
d2 dv d4 2 2
dz
1 +
-y(z) sin
= 0.
dt dz d-=v dt-d
.
1+ dt (3) (4)If we multiply Eq. 3 by d4/dt, we can derive an "energylike" expression in the form
d- (T+V) = P, (5 where
T -
2 dt/
dv V = y(z) cos + ~ dz QPR No. 101 138(VIII. APPLIED PLASMA RESEARCH)
d dv dy dv (d d
P =v 1 t + cos 2+
Note that if the velocity and field amplitude were constant in z, then P is zero, and we have the usual picture of a particle moving in a potential well (V) with kinetic (T) plus potential energies (in the wave frame) equal to a constant. For very slow variation in v(z) and y(z), we can picture the motion, according to (5), as a particle moving in a slowly varying well with a "dissipation" P(t) slowly changing the total energy.
For slowly varying v and y, we can make a linear approximation around z Z z as
v(z) = v(z ) - a(z-z )-- 0 -0
y(z)
=
P[1+C(-z)],
(6)
wheredv
1 dy
a dzP
= N(zo), C - z O OIf we now put the first-order term in y on the right-hand side of Eq. 5, then the poten-tial is
V(4) =
p
cos -ac
(7)and the new "dissipation function" (P) vanishes when the "velocity" (d4/dt) vanishes. This implies that the coordinates of the minima (or maxima) of V(4) are true stable (or unstable) "equilibrium points" throughout the domain where the linear approximation, Eq. 6, is applicable.
For particles with very small ;, and
4
located near the minima of V, we could expand sin about that equilibrium point and proceed with a small-amplitude oscil-lation theory.4 Using the adiabatic invariant of this simplified equation of motion, we find that in order for the amplitude of the phase oscillations about the equilibrium value to remain fixed we must have y increasing according to the lawy(z)= const. [v(z)]- 4 . (8)
This gives some idea of the relation between Em(z) and v(z) required to keep particles with small oscillations trapped. But how particles become trapped is not predicted by the analysis.
An approximate analytical model for analyzing the transition from trapped to
QPR No. 101
(VIII. APPLIED PLASMA RESEARCH)
untrapped particle orbits was developed with the following physical reasoning. A par-ticle with a velocity less than the local phase speed of the wave has ; < 0; this par-ticle travels in the negative
4
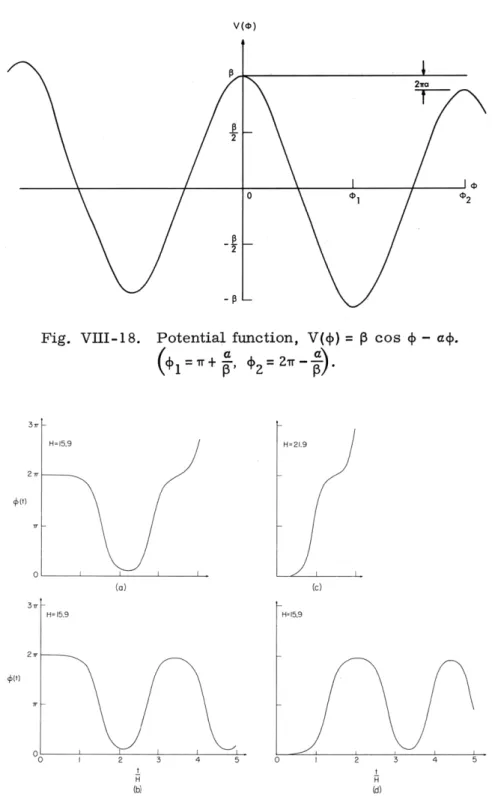
direction in the potential well V(4) with an equivalent"dissipation" P (which can be negative) slowly changing its total energy (see Fig. VIII-18. To become trapped, a particle with
4
< 0 must pass over the potential hump at4
= 2 = 21r -- say, and not be able to clear the potential hill at - . The particle will then be reflected, and travel back toward = 2; it will become trapped only if the net dis-sipation ( P dt) is sufficient to put it below the potential hill at4
=42.
Our basic approximation is to use the zero-order particle orbit (valid in the limit of constant v and y),1 d4)
22 dt + cos = const., (9)
in calculating
#
P dt.Performing these calculations, we find that the condition for a particle that just clears the hill at
42
(that is, with d4/dt = 0 at4
=42)
to just become trapped when it gets back to the peak of the hill (at =42)
is X = 4, whereX
I
(1 )
v'/vi z=010
VoWith X > 4, some of the particles will be trapped. With
2TT + 16
NT
+ 4p3X
>
max = =4J-
+ 2Tr (11)(and
p
< 0. 5) essentially all of the particles will be trapped. This condition (X = maxmax is the condition for a particle that is reflected at the peak of the hill at4
; 0 to "lose enough energy" in one transit from 0 to 2Tr to become trapped. We are, at present, determining the percentage trapping for X in the range between 4 and Xmax; it appears that a rather substantial number (> 50%) are trapped for X not very much larger than 4, as long as the velocity gradient is smooth enough (a ~ 10- 2 to 10- 3). It is also inter-esting to note that the X > 4 condition is identical to the condition for damping of the small-amplitude oscillation (Eq. 8).The preceding analysis was accomplished by assuming adiabatic variation of the field during one oscillation of a trapped particle. This method is approximate and valid for only a small region of parameter space. In order to verify the theory in this region and to investigate nonadiabatic effects, we have performed numerical integrations of the basic equation of motion for a variety of parameters. Some representative numerical
QPR No. 101
V(4)
Fig. VIII-18.
3r 4(t) 0 37 2v 4(t)Potential function, V( ) =
p
cos
4
- a.
7r
'
2 2w -
.
t t
H H
(b) (d)
Fig. VIII-19.
Numerical solutions of phase trajectories, 4(t), with the
d4
parameters a
=
0. 001,
= 0. 1,
-(o) = 0, z(o)
=
0.
(a)
(o)= 6. 27, X = 3. 0
(b) 4(o)= 6. 27, X= 5. O0
(c)
(o)= 0. 0,
X = 7. O0
(d)
(o)= 0. 0,
X= 8. 0.
QPR No. 101
I
141
(VIII. APPLIED PLASMA RESEARCH)
solutions of the phase trajectories of particles are shown in Fig. VIII-19.
The
trajec-tories in Fig. VIII-19a and VIII-19b confirm that
kmin
is within the range of 3. O0
to 5. 0
for the particular conditions given.
From Fig. VIII-19c and VIII-19d, we see that max
is between 7. 0 and 8. 0, where Eq. 11 predicts Xmax = 6. 7 for those conditions.
M. I. Mirkin, R. J. Briggs
References
1. R. F. Post, "Mirror Systems:
Fuel Cycles, Loss Reduction, and Energy
Recov-ery," Proc. International Conference on Nuclear Fusion Reactors, Culham
Labo-ratory, Culham, England, September 1969.
2.
"Preliminary Report of Direct Recovery Study," UCID-15650, Lawrence Radiation
Laboratory, Livermore, California, May 15, 1970.
3.
H. A. Haus, "Alternating-Current Generation with Moving Conducting Fluids,"
J. Appl. Phys. 33, 2161-2172 (1962).
4.
A. D. Vlasov, "Theory of Linear Accelerators" (translated from Russian by Z.
Lerman) Program for Scientific Translations, Jerusalem, Israel, 1968.
QPR No. 101
142
VIII.
APPLIED PLASMA RESEARCH
B.
Plasma Physics and Engineering
Academic and Research Staff
Prof. R. A. Blanken
Prof. E. P. Gyftopoulos
Prof. L. M. Lidsky
Prof. T. H. Dupree
Dr. E. Oktay
Graduate Students
G. W. Braun
B. H. Hui
A. Pant
D. L. Cook
D. S. Komm
C. A. Primmerman
J. C. Hsia
T. A. Moulia
J. E. Robinson
1. FEEDBACK EFFECTS ON A LARGE-AMPLITUDE INSTABILITY
IN A RADIOFREQUENCY DISCHARGE
This report gives experimental results and techniques for feedback stabilization
of a large-amplitude instability; in particular, the relation between wave amplitude
and feedback-loop gain phasing is examined.
The main point of these experimental results will be to show that in the high-gain
regime the instability locks in, at a region near zero phase, to the feedback signal for
all applied feedback phase shifts.
Reports on feedback stabilization of small-amplitude, single-mode instabilities
have been reported previously.
l '2 When many modes are present simultaneously, and
3-5
are of large amplitude the problem becomes more complex.
In this case it is
dif-ficult to interpret results using a simple feedback loop consisting of a wideband
amplifier and a delay line. For example, when applying negative feedback to the
m = 1 mode we are concurrently applying positive feedback to the m
=
2 mode, and
these modes can couple in the plasma. This provides a difficult problem if the coupling
mechanism is unknown.
The instability studied in this experiment occurs in a previously reported
experi-ment. The instability is observed at a magnetic field of 600 G. It is a large-amplitude
7-9
(n/n- 0.35), "drag-type" instability
located 3-4 cm from the column axis (see also
-5
Sec. VIII-B.2). It occurs at low neutral pressures (1-ZX10-5 Torr Argon) and for large
electron temperatures in the central region of the column (5-10 eV).
The wave is a
single azimuthal perturbation that rotates in the electron diamagnetic direction with a
phase velocity of 5.6 X 104 cm/s. The waveform is nonsinusoidal; the Fourier analysis
is shown in Fig. VIII-20. While it is not a multimode instability, it has similar inherent
problems with respect to feedback stabilization, as can be observed from the spectrum.
This work is supported by the National Science Foundation (Grant GK-18185).
(VIII. APPLIED PLASMA RESEARCH)
3 4
(kHz)
Fig. VIII-20. Frequency spectrum of ion saturation current fluctuations.
In this experiment we decided to use filters and to examine the effect of feedback of the first harmonic on the instability. This avoids the possibility of exciting other modes directly. Filters are used, however, at the expense of a greatly increased time delay through the feedback system. The instability, therefore, must have a correlation time greater than the time delay through the system if application of feedback is to have any effect.
Fig. VIII-Z1. Feedback loop.
The feedback circuit is shown in Fig. VIII-21. The filters were calibrated and the damping adjusted so that the bandpass for the entire feedback circuit was centered at 2 kHz with a full width at half-maximum of 900 Hz. Measurements of the time response of the circuit, using a 2-kHz tone burst showed a 1-ms time delay for the signal to decay to half of its original amplitude. At instability frequency of 2 kHz this delay time amounts to 2 cycles. The correlation function for this instability was measured and found to have a decay time of more than 8 cycles. On this basis, the feedback is expected to retain meaningful phase information even if delayed 2 cycles.
The suppressor electrodes are rectangular plates (1 X 2 cm) radially positioned at the maximum wave amplitude and azimuthally separated by 1800 (Fig. VIII-21).
(VIII. APPLIED PLASMA RESEARCH)
The detection probe was located approximately 1 m axially from the electrodes and positioned radially near the maximum wave amplitude. Care was taken in locating this position so that no resistive pickup was obtained directly from the electrodes. This was accomplished by applying a noncoherent, large-amplitude, 9 kHz signal to the electrodes, and then positioning the detection probe so that it did not see this signal. The 9-kHz signal was far enough from the natural frequencies of the plasma that it did not elicit a wave type of response.
Data were taken for one electrode driven with reference to ground and for two elec-trodes driven out of phase. The latter will be presented in this work as both sets are qualitatively similar.
Figure VIII-22a shows the wave amplitude as a function of corrected phase with the gain of the feedback loop as a parameter. At low gains the amplitude dependence has a continuous sinusoidal character. The frequency shift at low gains exhibits the same
WAVE AMPLITUDE (NORMALIZED WITH RESPECT TO EQUILIBRIUM AMPLITUDE)
LOW GAIN HIGH GAIN
GAIN=75 -- GAIN=3 REGION OF ALLOWED \ AT HIGH GAIN O app D app
S
3
T
-
0
-it -3ir -it -T 0 ii ii3r
4 2 4 4 2 4
Fig. VIII-22.
(a) Normalized wave amplitude for high and low gains as a
function of Corr'
(b) Frequency shift Av for high and low gains as a function
of
c orr' Since the phase shift is a function of
fre-quency, orr = app(v +Av); o app = ap (v ).corr
app o
oapp
app
o
QPR No. 101
-I
WAVE
0
=0 o app FEEDBACK w/2(a)
WAVE -S =0 o app FEEDBACK w/4 w/2(b)
Fig. VIII-23.
Direct observation of wave-feedback phase shift.
(a) Low gain; (b) High gain.
QPR No. 101
-w/4 -w/2 - 3w/4 146lmrml
7
T
WAS W
VR
I
VFI
(VIII. APPLIED PLASMA RESEARCH)
properties (Fig. VIII-22b). Figure VIII-23a shows the actual phase shift between the wave and the applied feedback signal at low gains. It should be observed that the applied signal in this low-gain case shifts phase continuously, as o app is varied, with respect to the wave.
In contrast, looking again at Fig. VIII-ZZ, we can see that for the high-gain case the wave locks into the phase shift. This can be noted because, for the most part, change in the wave amplitude is relatively large and positive, indicative of the fact that the wave is maintaining a small phase shift with respect to the feedback signal. In Fig. VIII-22b the frequency shift can be seen as a continuously decreasing function of
corr until
4o
app = +T is reached, at which point Av makes a discontinuous jump back to its value at4o
app=-Looking at Fig. VIII-23b, we see that for all o app such that --i <
40
app < +1T the actual phase shift between the wave and feedback signal is within ±r/2.The region about o app = T is obviously unstable. This region, containing the discontinuous frequency shift can clearly be seen in Fig. VIII-24. The frequency shift is continuous for -w <
4o
app < +rr, but as o app is varied across iT there is a dis-continuous jump from a frequency 300 Hz below to 400 Hz above v .In conclusion, a filtered feedback system has been used to study the effect of low-gain feedback stabilization and high-low-gain phase frequency entrainment. It has been
6 4 Z 2 2 0 1 2 3 4 5 6 7 8 9 v (kHz)
Fig. VIII-24.
Frequency spectra showing discontinuous frequency
transition at40
app = ±r.(VIII. APPLIED PLASMA RESEARCH)