Publisher’s version / Version de l'éditeur:
Vous avez des questions? Nous pouvons vous aider. Pour communiquer directement avec un auteur, consultez la première page de la revue dans laquelle son article a été publié afin de trouver ses coordonnées. Si vous n’arrivez pas à les repérer, communiquez avec nous à [email protected].
Questions? Contact the NRC Publications Archive team at
[email protected]. If you wish to email the authors directly, please see the first page of the publication for their contact information.
https://publications-cnrc.canada.ca/fra/droits
L’accès à ce site Web et l’utilisation de son contenu sont assujettis aux conditions présentées dans le site LISEZ CES CONDITIONS ATTENTIVEMENT AVANT D’UTILISER CE SITE WEB.
PLoS ONE, 14, 3, 2019-03-27
READ THESE TERMS AND CONDITIONS CAREFULLY BEFORE USING THIS WEBSITE. https://nrc-publications.canada.ca/eng/copyright
NRC Publications Archive Record / Notice des Archives des publications du CNRC : https://nrc-publications.canada.ca/eng/view/object/?id=4f5b7555-5bca-4472-919b-bd0c5e7ef6b6 https://publications-cnrc.canada.ca/fra/voir/objet/?id=4f5b7555-5bca-4472-919b-bd0c5e7ef6b6
Archives des publications du CNRC
This publication could be one of several versions: author’s original, accepted manuscript or the publisher’s version. / La version de cette publication peut être l’une des suivantes : la version prépublication de l’auteur, la version acceptée du manuscrit ou la version de l’éditeur.
For the publisher’s version, please access the DOI link below./ Pour consulter la version de l’éditeur, utilisez le lien DOI ci-dessous.
https://doi.org/10.1371/journal.pone.0212342
Access and use of this website and the material on it are subject to the Terms and Conditions set forth at
Talk2Me: automated linguistic data collection for personal assessment
Komeili, Majid; Pou-Prom, Chloé; Liaqat, Daniyal; Fraser, Kathleen C.;
Yancheva, Maria; Rudzicz, Frank
Talk2Me: Automated linguistic data collection
for personal assessment
Majid Komeili1, Chloe´ Pou-Prom2, Daniyal Liaqat3,4, Kathleen C. Fraser5, Maria YanchevaID6, Frank RudziczID2,3,4,7*
1School of Computer Science, Carleton University, Ottawa, Ontario, Canada, 2 Li Ka Shing Knowledge Institute, Saint Michael’s Hospital, Toronto, Ontario, Canada, 3 Vector Institute for Artificial Intelligence, Toronto, Ontario, Canada, 4 Department of Computer Science, University of Toronto, Toronto, Ontario, Canada, 5 National Research Council Canada, Ottawa, Ontario, Canada, 6 WinterLight Labs, Toronto, Ontario, Canada, 7 Surgical Safety Technologies, Toronto, Ontario, Canada
Abstract
Language is one the earliest capacities affected by cognitive change. To monitor that change longitudinally, we have developed a web portal for remote linguistic data acquisition, called Talk2Me, consisting of a variety of tasks. In order to facilitate research in different aspects of language, we provide baselines including the relations between different scoring functions within and across tasks. These data can be used to augment studies that require a normative model; for example, we provide baseline classification results in identifying dementia. These data are released publicly along with a comprehensive open-source pack-age for extracting approximately two thousand lexico-syntactic, acoustic, and semantic fea-tures. This package can be applied arbitrarily to studies that include linguistic data. To our knowledge, this is the most comprehensive publicly available software for extracting linguis-tic features. The software includes scoring functions for different tasks.
Introduction
Between 8% and 10% of the North American population has some speech disorder, including 3 million stutterers, and 7.5 million individuals with dysarthria (caused, e.g, by cerebral palsy, Parkinson’s, or multiple sclerosis) according to the U.S. National Institute of Health. More-over, since linguistic change is often among the first symptoms of neuro-degenerative cogni-tive decline, the broader set of speech and language disorders are expected to increase with the rising prevalence of dementia in the aging population [1]. It is therefore imperative to build tools for earlier detection and management of change in language. To the extent to which these tools will be based on machine learning, this will require large datasets; unfortunately, the available data tend to be prohibitively small for rarer diseases, and prohibitively difficult to collect for more at-risk populations. We therefore developed a language assessment tool, called Talk2Me, designed for large-scale self-administered collection of spoken and written language data. This includes new open-source software for feature extraction, a publicly-available data
a1111111111 a1111111111 a1111111111 a1111111111 a1111111111 OPEN ACCESS
Citation: Komeili M, Pou-Prom C, Liaqat D, Fraser
KC, Yancheva M, Rudzicz F (2019) Talk2Me: Automated linguistic data collection for personal assessment. PLoS ONE 14(3): e0212342.https:// doi.org/10.1371/journal.pone.0212342
Editor: Nicholas Greatorex Riches, Newcastle
University Institute for Health and Society, UNITED KINGDOM
Received: August 25, 2018 Accepted: January 31, 2019
Published: March 27, 2019
Copyright:© 2019 Komeili et al. This is an open
access article distributed under the terms of the
Creative Commons Attribution License, which permits unrestricted use, distribution, and reproduction in any medium, provided the original author and source are credited.
Data Availability Statement: All recordings,
transcripts, computed features, and computed scores are publicly available without restriction from the Talk2Me database, available athttp:// www.cs.toronto.edu/~complingweb/data/talk2me/
as of 27 November 2018.
Funding: This work was partially funded by an
NSERC Discovery grant (Rudzicz, RGPIN 435874 to FR), by a Young Investigator award to FR by the Alzheimer Society of Canada (Rudzicz), and by a CIHR-NSERC Collaborative Health Research
set on which those features were applied, and analysis of relevant linguistic patterns in those features.
After describing the dataset and the feature extraction framework, we present examples of how the dataset might be used in practice, including. This includes unsupervised learning to detect clusters of participants in unlabelled data, and analyzing the relationships between dif-ferent features within a single task, as a means to reduce redundancy in prospective data collec-tion. We also apply normative healthy control data, of the type we obtain, to the classification of Alzheimer’s disease (AD) in a smaller dataset.
Assessing AD with automated analysis of language
Language decline is one of the most salient symptoms of AD. Linguistic and acoustic features, such as information content, noun-to-pronoun ratios, and changes to the pitch contour, are indicative of cognitive decline [2–4]. Connected speech is often used for assessing AD, as it provides insight into semantic processing and syntactic complexity [5]. In a study with 30 healthy participants and 36 participants with AD, Meila´n et al extracted temporal and acoustic features from speech of simple sentences spoken by older adults with and without AD, and achieved an accuracy of 84.8% in a binary classification task (Healthy vs. AD) [6]
Often, connected speech is elicited through the picture description task. Forbes-McKay and Venneri [7] found that deficiencies in semantic processing were apparent not only in partici-pants with AD, but also in those diagnosed with mild or moderate forms of cognitive decline. Jarrold et al [8] collected speech from 48 participants completing a picture description task. They then automatically extracted lexical and acoustic features and identified participants with dementia using different machine learning approaches. Similarly, de Lira et al extracted lin-guistic features from transcripts of 121 older adults completing a picture description task and concluded that participants with AD displayed more word-finding difficulties, revisions, and repetitions than healthy controls [9]. In a study involving 48 participants, Giles et al [10] used information content to classify participants into four categories of impairment: none, minimal, mild, and moderate. Interestingly, they found that participants with minimal cognitive decline had significant impairments in the production of information units, indicating that decline in the use of semantic content can be detected at early stages of cognitive impairment.
DementiaBank [11] is a popular dataset for studying language in AD in which 167 adults with dementia and 97 adults without, all above the age of 44, completed the ‘Cookie Theft’ pic-ture description task, from the Boston Diagnostic Aphasia Examination [12], which includes the raw audio, the textual transcripts, and the validated clinical assessments. Participants com-pleted these tasks once a year along with a mini-mental state examination. However, longitudi-nal data points in DementiaBank, especially for AD participants, are sparse. On
DementiaBank, Yancheva and Rudzicz [13] automatically detected information content using word embeddings for binary classification of AD and achieved an F-score of 0.74. On the same dataset, Wankerl et al employed an n-gram based approach and built two language models, one for AD participants and one for healthy participants and achieved a classification accuracy of 77.1% [14]. Fraser et al used over 370 automatically extracted acoustic, lexical, and syntactic features to detect AD [2] based on acoustics and speech transcripts.
Other tasks have been used to study the relationship between language and AD. Kirshner et al found that people with AD had difficulty on naming tasks even though their language showed no qualitative signs of deterioration, except perhaps that they used more generic terms instead of specific ones [15]. Other work has explored verbal fluency [16] and story recall [3], for example, as means to assess AD.
Projects (Rudzicz, CHRP 381332 to FR). The funders had no role in study design, data collection and analysis, decision to publish, or preparation of the manuscript.
Competing interests: The authors of this
manuscript have read the journal’s policy and have the following competing interests: KCF, MY, and FR are co-founders of a company, WinterLight Labs Incorporated, that commercializes the automated analysis of spontaneous speech and other language tasks. WinterLight Labs provided no influence or financial support, nor has WinterLight Labs received any benefit from this work beyond what is being made public. MY, who was a student at the inception of the study at the University of Toronto, was an employee of WinterLight Labs during the final editing of the document. There are no patents, products in development or marketed products associated with this research to declare. This does not alter our adherence to PLOS ONE policies on sharing data and materials.
Interfaces for self-administered data collection
Clinical cognitive assessments are generally performed in person using physical booklets directly with a clinician. Recently, there has been a push for more remote approaches including telephone-based versions of existing cognitive assessments such as the MMSE and the Mon-tre´al Cognitive Assessment (MoCA) [17]. Rapcan et al [18] administered a battery of language assessments over the telephone and found that speech features (e.g., number of pauses, length of utterances) could be reliably extracted by telephone recordings and did not significantly dif-fer from in-person clinic recordings. Using an interactive-voice-response telephone system, Yu et al [19] extracted speech features and achieved an AUC of 0.77 in classifying between healthy and cognitively impaired participants.
Van Mierlo et al [20] built a web- and telephone-based system for administering cognitive self-tests as a method of automatic screening. In their study, 117 participants used their system and were classified into one of the following categories: subjective cognitive decline, mild cog-nitive impairment, and dementia. They achieved an AUC of 0.86 with the web-based system, and an AUC of 0.78 on the telephone assessment. The tasks employed in that work, however, did not include free-form speech or language production, which is our focus here.
Materials and methods
Talk2Me collects data through tasks similar to those used in standard assessments of cognition (including the Mini-Mental State Examination [21], the Montre´al Cognitive Assessment [22], and the Western Aphasia Battery [23]). Users register on the website and provide consent, then complete a demographics survey (S1 Fig). The survey collects information on their sex, age, ethnicity, language fluency, education level, country of origin, and country of residence. Users are also asked if they have ever been diagnosed with dementia, if they are currently tak-ing dementia medication, and if they have been a regular smoker of tobacco within the last 3 years. After answering the survey questions, they can then complete multiple sessions of data collection, some through typing and others through speaking. In order to be as generic as pos-sible, no restrictions are placed on the environment or channel, except that the browser must support HTML5, which is the case for all major browsers. The source code for this tool is being made available publicly (https://github.com/SPOClab-ca/talk2me_interface).
All data were recorded given informed consent by the participants, according to Research Ethics Board protocol #31127 of the University of Toronto, which specifically approved this study.
Language tasks
Website users complete eight different types of language task, each designed to evaluate vari-ous aspects of cognition. During each session, users complete one or more instances of each task, with each instance corresponding to a different stimulus (e.g., a different word to define, or different picture to describe), as summarized inTable 1.
Image naming In each image naming session, six pictures are displayed and the participant types the name of each object depicted. Images are taken from the Caltech-256 Object Cate-gory dataset [24].
Picture description Participants verbally describe images that convey more complex scenes that show interacting objects. There is no time constraint on this task, although participants are encouraged to speak for at least one minute. Images used for this task include the ‘Cookie Theft’ picture from the Boston Diagnostic Aphasia Examination [12], the ‘Picnic scene’ from the Western Aphasia Battery [23], twelve re-distributable images from Flickr
(https://www.flickr.com/), and twenty-nine images from the Webber Photo Cards: Story Starters collection [25].
Fluency In each session, participants type as many words as possible that match the category. Categories typically consist of a semantic variant (e.g., types of animal) or a phonemic ant (e.g., words that begin with F). Verbal performance on this task can differentiate a vari-ety of conditions, including traumatic brain injury [26] and dementia [27].
Story recall A short story is displayed to the participant. The text then disappears, as expected, and participants verbally re-tell the story in their own words. There is no time constraint on either phase, but participants are encouraged to speak for at least a minute. Stories used in this task are the ‘My Grandfather’ short story [28], the ‘Rainbow’ passage [29], and the ‘Limpy’ passage (http://itcdland.csumb.edu/~mimeyer/CST251/readingpassages.html) which are standardized among speech-language pathologists to assess speaking and mem-ory skills.
Vocabulary Participants define five words by typing definitions using their own words. Words used in this task are taken from the Brown corpus [30]. Each word is assigned a dif-ficulty based on its age-of-acquisition, derived from the Kuperman norms [31]. Specifically, the set of all words is sorted by increasing age-of-acquisition and subsequently trisected into partitions of equal size, uniformly across scores, representing ‘easy’, ‘moderate’, and ‘difficult’ words.
Winograd schema The Winograd Schema challenge [32] consists of questions with two possi-ble answers (e.g., one stimuli is ‘The trophy could not fit into the suitcase because it was too big. What was too big—the trophy or the suitcase?’). Instances are taken from the publicly available Winograd Schema challenge (https://www.cs.nyu.edu/davise/papers/WS.html). Participants simply select an answer from the available pair.
Word-colour Stroop In the Stroop inference task [33], the user is presented with the name of a colour, presented in a coloured typeface. The user says the colour of the given font out loud, ignoring the orthography. The Stroop test has a high degree of discriminative power in Alzheimer’s disease [34], depression [35], and bipolar disorder [36], for example. Self-reported disposition Participants answer five questions taken from a validated
short-form version [37] of the Geriatric Depression Scale (GDS), which is a 30-item self-assess-ment used to identify depression in the elderly [38]. We collect these responses, since mood can affect a person’s performance in language tasks, and since a focus on dementia is ongo-ing in a parallel study. From the GDS, we ask yes/no questions on life satisfaction, general
Table 1. Modality of language tasks, and the number of unique stimuli per session for each task.
Task Mode # of stimuli
Image naming Text 6
Picture description Audio 1
Fluency Text 1
Story recall Audio 1
Vocabulary Text 6
Winograd schemas Multiple-choice 5
Word-colour Stroop Audio 18
General disposition Multiple-choice, Likert scale 5
happiness, and everyday activities. Participants are also asked to rate their current mood on a scale from 1 (very sad) to 10 (very happy).
Talk2Me database
In this section, we describe the demographics of individuals in the database, then we describe how different tasks are scored. Lastly, we describe the extracted features. A task score is a quan-titative measure of how well that task was performed towards some goal. Naturally, this only applies to tasks that have an explicit purpose to be achieved. Unlike scores, features don’t directly measure success in performing a task, but rather evaluate intrinsic aspects of how the task was performed.
Demographics
Collection of this database is ongoing, and subsequent releases or “snapshots” that we make publicly available will be versioned and time-stamped. We report results and analysis on 1369 sessions completed by 339 unique users, of whom 206 have completed more than one session. The released dataset includes sessions from all participants who have agreed to the public release of their data, and contains 1033 sessions from 196 users. Participants were recruited on a voluntary basis, self-assessing for an adequate level of proficiency in English. 96% of users report being native or fluent speakers of English and 92% of users report being Canadian resi-dents but the tool is not built for any particular country or accent; 3% are from United States and the rest are from other countries. We do not restrict age, sex, or other demographics. While most participants using Talk2Me are less than 30 years of age, approximately 50 users are older adults and 36% are female.Fig 1shows the distribution of age and education level over all participants.
Scoring the tasks
We automatically transcribe audio files for the picture description, story recall, and word-col-our Stroop tasks with Kaldi, an open-sword-col-ource speech recognition toolkit [39], using a long short-term memory neural network with i-Vector input [40] and a reverberation model, trained on the Fisher data [41]. An ad hoc evaluation of a random 10% of transcripts generated from the story recall task reveals a word-error rate of 28.08%, which is approximately state-of-the-art for large-vocabulary speech recognition [42]. Each transcript is then aligned with its
Fig 1. Demographics: Age and education distribution of participants.
corresponding audio file using the Gentle forced aligner (https://github.com/lowerquality/ gentle), and then segmented into sentences based on pitch, pause, and parts-of-speech features [43]. The fully segmented transcripts are then scored, as described below.
Image naming scores. Stimuli used in the image naming task are taken from the Caltech-256 Object Category dataset [24], which are labeled. We measure the similarity (on [0..1]) between user input and the set of provided annotations using Wu-Palmer Similarity (WuP) [44] on the ontology provided by WordNet [45]. WordNet is a lexical database that groups English words into synonym sets, and maintains a number of relations among these sets and their members. WuP returns a score denoting how similar two synonym sets (c1and c2) are, based on the depth of the two senses in the ontological graph, from the root node, and that of their least common subsumer LCS (i.e., their most specific ancestor node). Specifically,
simwup¼
2� depthðLCSðc 1; c2Þ depthðc1Þ þ depthðc2Þ
: ð1Þ
Since words can have multiple senses, we choose the most frequent one. There are 257 sti-muli in this task. The average score per stimulus is computed and the distribution of the aver-age score for each stimulus is summarized inFig 2. The overall average score for this task is 0.89 with a variance of 0.02 and a skewness of −1.5.
Picture description scores. Picture description is often scored in terms of both syntactic and semantic properties, such as agrammatical deletions and ‘emptiness’, respectively [12]. For the former, we measure language complexity automatically using Lu’s Syntactic
Fig 2. Image naming task: Distribution of average scores for different images. We provide examples of images that appear simple
and challenging.
Complexity Analyzer (SCA) [46]. For the latter, we count the number of information content units (ICUs) in produced transcripts. These ICUs constitute entities, actions, or relations in the scene, and were initially determined through annotation by speech-language pathologists. Since participants may describe an ICU in different terms (e.g., ‘mom’ instead of ‘mother’, or ‘kid’ instead of ‘boy’), we use the Lin Similarity (LS) metric [47] from NLTK to account for lex-ical variety. LS computes the similarity of two synonym sets (c1and c2) based on the Informa-tion Content (IC) of the the Least Common Subsumer and that of the two input synonym sets. Specifically, simLS¼ 2� ICðLCSðc 1; c2ÞÞ ICðc1Þ þ ICðc2Þ : ð2Þ
For the words in the input sentence, all possible senses are considered and we accept an input word as an ICU if the similarity of its closest synonym set is greater than 0.75, deter-mined empirically. For each picture, 10 examples were randomly selected and manually veri-fied against different thresholds. If a word is determined to be synonym of an ICU in the context of the picture but their similarity does not satisfy the above threshold, the word is man-ually added to the list of ICUs for that picture. A very low value for the threshold results in many words being falsely detected as ICUs. A very large value results in many ICUs not be detected and therefore many synonyms should be added manually to the list of ICUs. The threshold of 0.75 empirically balanced accurately detecting ICUs while minimizing manual annotation.
ICUs can also take the form of multi-word phrases (e.g., ‘hard drive’). To compare an ICU with m words with an input window of n words (where m � n by definition), each word in the ICU must be paired with a word in the input. Note that, as illustrated inFig 3, a greedy strategy can result in suboptimal pairings, called maximum weight matching in bipartite graph theory. Therefore, using maximum weight matching [48], an ICU is detected if the similarities for all words in the candidate are greater than the empirical threshold 0.75. Note that this does not incorporate grammatical dependencies or negations.
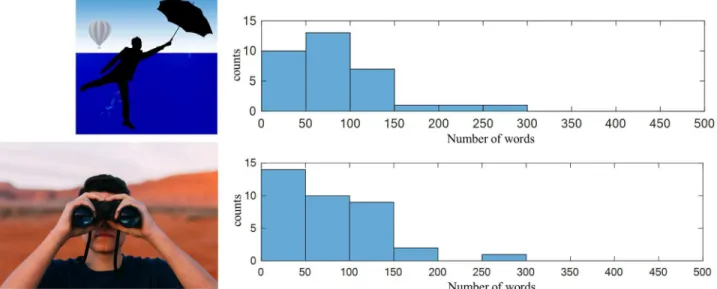
Pictures can have a relatively arbitrary number of ICUs. Some pictures elicit more or less speech, as shown in Figs4and5, respectively.
Fluency scores. We extract the same scores as in the Wisconsin Longitudinal Study [49] for the same type of task, including the number of tokens in a category and the number of tokens out-of-category. For the semantic fluency task, we manually construct dictionaries for each stimulus, based on a subset of user responses (e.g., the ‘animal’ dictionary contains the words ‘lion’, ‘tiger’, and ‘cat’. To determine if a word is in- or out-of-category, we first check if it belongs to any of the dictionaries. If the word is not found, we use WordNet to check if the category word is its hypernym. For the letter fluency, we check that each word begins with the given letter, and then verify that the word exists by checking if it can be found in WordNet. Alternative dictionaries may be used, in general.
Alzheimer’s disease, for example, has a greater impact on semantic fluency than on other types of fluency [16,50].Fig 6shows the pairwise Kullback—Leibler (KL) divergence between the distributions of the number of tokens in-category, for different instances of the fluency task. For visualization, values are linearly normalized on [0..1]. Dark blue elements indicate smaller distances between distributions. Here, ‘drinks’, ‘occupations’, ‘cities’, and ‘fruits’ show similar distributions. As one may expect, ‘letters’ and ‘numbers’ have also similar distributions. The distributions of the number of tokens out of category for different instances are examined inFig 7.
These results suggest that latent subgroups exist in the fluency task, which may be useful in mitigating the practice effect that often occurs in longitudinal analysis [51].
Story recall scores. We transcribe the audio recordings of story recall, and score the task using the ROUGE score (i.e., ‘recall-oriented understudy for gisting evaluation’) [52]. ROUGE is typically used to evaluate automatic summarization software, and compares a candidate
Fig 3. Picture description task: Optimal pairing is found by solving a maximum weight matching in bipartite graphs. Using a threshold of 0.75, a
greedy algorithm would result in pairing word1with word �
2. The optimal pairing of word1with word �
1and word2with word �
2is obtained with maximum
weight matching.
https://doi.org/10.1371/journal.pone.0212342.g003
Fig 4. The picture description task: Distributions of the number of words for two of the picture stimuli (shown) with longer descriptions. The top
image is a redistributable proxy of image 17 from the Webber collection.
summary to a list of reference summaries using the overlap of their n-grams. When scoring the story recall task, we use the original text of the short story as the reference and the tran-script of the participant’s story retelling as the candidate. We extract ROUGE metrics on uni-grams (ROUGE-1) and on biuni-grams (ROUGE-2).Fig 8shows the distribution of these scores for different stories, including the ‘Grandfather’ passage, whose lower scores suggest that it is harder to recall.
Vocabulary scores. We use the BLEU measure (i.e., ‘bilingual evaluation understudy’) [53] to score the vocabulary task. BLEU is similar to ROUGE in that it compares oracle-pro-vided reference sentences and candidate sentences, but its focus is precision rather than recall.
Fig 5. The picture description task: Distributions of the number of words for two of the picture stimuli (shown) with shorter descriptions. The
top image and bottom images are redistributable proxies of images 41 and 42, respectively, from the Webber collection.
https://doi.org/10.1371/journal.pone.0212342.g005
Fig 6. Fluency task: KL distances between distributions of the number of the tokens in category for different instances of the fluency task. The
actual distributions are shown on the right.
Specifically, given a brevity penalty: BP ¼ 1 if r < c e1 r=c if r � c ( ð3Þ
where c is the number of word tokens in the candidate and r is the nearest length among refer-ences, and
pn¼ C=N ð4Þ
is the n-gram precision given the number C of n-grams in the candidate that are in at least one reference and the total number N of words in the candidate, then:
BLEU ¼ BPðp1p2:::pnÞ
1=n ð5Þ
In our case, the user provides the candidate definition, and reference definitions are derived from WordNet [54], Wiktionary (http://www.igrec.ca/projects/wiktionary-text-parser/, and the Merriam-Webster dictionary (https://www.dictionaryapi.com/). There are 301 different
Fig 7. Fluency task: KL distances between distributions of the number of the tokens out of category for different instances of the fluency task. The
actual distributions are shown on the right.
https://doi.org/10.1371/journal.pone.0212342.g007
Fig 8. Story recall: Distribution of the average ROUGE-1 (ROUGE-2) scores for different stories on right (left).
stimuli. The average BLEU score per stimulus is computed and the distribution of the average score of the stimuli is shown inFig 9. We provide examples of vocabulary items with very high and very low scores. The average score of the Vocabulary task is 0.49 with variance of 0.03 and skewness of -0.41. Stimuli around the average may be good candidates for future studies of vocabulary.
Winograd schema scores. The dataset used for the Winograd schema is annotated with correct answers. Participants receive a score of 1 for every correct response, and 0 otherwise. There are 274 Winograd stimuli. The average score per stimulus is computed and the distribu-tion of the average score of the stimuli is shown inFig 10. The average score of the Winograd task is 0.75 with a variance of 0.01 and a skewness of −0.46. Similar to the vocabulary task, the stimuli around the average may be a good candidate for future studies.
Feature extraction
We extract both textual features where available (including transcripts from speech recogni-tion), and acoustic features from audio, as described below.
From text and transcribed audio of the image naming, fluency, story recall, and vocabulary tasks, we extract lexical, syntactic, semantic, and pragmatic features, as described inTable 2.
Lexical features. We automatically extract features related to each word (e.g., the number of syllables per word, and the number of characters per word). We count the number of fillers (e.g., “uh”, “um”) and normalize by the total number of word tokens in the sample.
Fig 9. Vocabulary task: Distribution of the average BLEU score of different stimuli. Some examples with very high and low scores are also provided
on the right, from references.
https://doi.org/10.1371/journal.pone.0212342.g009
Fig 10. Winograd task: Distribution of the average score given different stimuli. Some examples with very high and very low scores are provided on
the right.
To compute vocabulary richness, we calculate the type-token-ratio and the moving-aver-age-type-token-ratio [55] with window sizes of 10, 20, 30, 40, and 50. We also calculate the Brunet index (Eq 6) and the Honore´ statistic (Eq 7) [56]; i.e.,
BI ¼ NðU 0:165Þ
; ð6Þ
where N is total number of word tokens and U is the total number of unique word types, and
HS ¼100log N
1 N1
U
; ð7Þ
where N is the total number of word tokens, U is the total number of unique word types, and N1is the number of hapax legomena (i.e., words used only once).
The readability of transcripts is calculated by the Flesch reading score (Eq 8), and the Flesch-Kincaid grade level (Eq 9) [57]; i.e.,
F ¼ 206:835 1:015 total words total sentences 84:6 total syllables total words ð8Þ and FK ¼ 0:39 total words total sentencesþ 11:8 total syllables total words þ 15:59 ð9Þ
We measure the polarity of transcripts by computing averages and standard deviations of norms derived from the Multi-Perspective Question Answering (MPQA) lexicon [58] and the Stanford Sentiment analyzer [59]. The MPQA lexicon provides values of polarity of words as “strong negative”, “strong positive”, “weak positive”, or “weak negative”. The Stanford Sentiment analyzer provides values of polarity of words as “very negative”, “very positive”, “neutral”, “neg-ative”, or “positive”.
We extract mean values of frequency, age-of-acquisition, imageability, familiarity, arousal, dominance, and valence based on lexical norms. We compute the mean frequency (with which a word occurs in a corpus) of words based on the SUBTL frequency norms [60]. Age-of-acqui-sition (i.e., the age at which a person learned a word), imageability (i.e., the ease at which a
Table 2. Extracted lexical, syntactic, semantic, and pragmatic features for image naming (IN), picture description (PD), fluency (F), story recall (SR), and vocabulary (V) tasks. We do not extract any text features for the Winograd schema or the word-colour Stroop task.
IN PD F SR V Lexical Word ✔ ✔ ✔ ✔ Fillers ✔ ✔ ✔ ✔ Vocabulary richness ✔ ✔ ✔ ✔ Readability ✔ ✔ ✔ ✔ Polarity ✔ ✔ ✔ ✔
POS counts & ratios ✔ ✔ ✔ ✔
Lexical norms ✔ ✔ ✔ ✔ ✔ Pragmatic LDA ✔ ✔ RST ✔ ✔ Semantic WordNet ✔ ✔ ✔ ✔ Cosine measures ✔ ✔ ✔ ✔ Syntactic Lu ✔ ✔ ✔ Parse trees ✔ ✔ ✔ Density ✔ ✔ ✔ ✔ ✔ https://doi.org/10.1371/journal.pone.0212342.t002
word can give rise to a mental image), and familiarity (i.e., how often a word is used, seen or heard) are determined from the Bristol [61] and Gilhoolie-Logie ratings [62]. Arousal (i.e., the intensity of emotion), dominance (i.e., the degree of control), and valence (i.e., the pleasant-ness) of words are derived from the Affective Norms for English Words (ANEW) ratings [63] and the Warriner norms [64]. We also obtain average values for psycholinguistic measures from the Linguistic Inquiry and Word Count (LIWC) corpus [65] and the Receptiviti platform (https://www.receptiviti.ai/liwc-api-get-started).
Syntactic features. We count constructs extracted from Lu’s Syntactic Complexity Ana-lyzer (SCA) [46]. SCA computes various ratios involving T-units (i.e., main clauses plus their dependent clauses) and complex nominals (i.e., groups of words that describe an entity). We compute the Yngve measure [66], which is computed from Stanford context-free parse trees and quantifies to what extent a sentence is left-branching rather than right-branching. We extract propositional [67] and content density [3], respectively:
densityprop¼
verbs þ adjectives þ adverbs þ prepositions þ conjunctions
words ; ð10Þ
and
densitycontent¼
nouns þ verbs þ adjectives þ adverbs
words : ð11Þ
Next, we measure the part-of-speech (POS) counts using the Stanford POS tagger (https:// nlp.stanford.edu/software/tagger.shtml). These include adjectives, adverbs, coordinate con-junctions, demonstratives, determiners, function words, inflected verbs, light verbs, nouns, prepositions, pronouns, subordinate conjunctions, verbs. We also compute the following POS ratios:
noun verb ratio ¼#nouns
#verbs
noun ratio ¼ #nouns
ð#nouns þ #verbsÞ
pronoun ratio ¼ #pronouns
ð#pronouns þ #nounsÞ
subordinate coordinate ratio ¼#subordinate conjunctions
#coordinate conjunctions
ð12Þ
Semantic features. We compute semantic similarity using the average and minimum cosine distance between each pair of one-hot embeddings of utterances, and the cosine cutoff (i.e., the number of pairs of utterances whose the cosine distance is below a certain threshold). We compute word specificity and ambiguity based on tree depth and the number of senses in WordNet [54]. We also extract multiple WordNet measures of similarity: Resnik [68], Jiang-Coranth [69], Lin [47], Leacock-Chodorow [70], and Wu-Palmer [71].
Pragmatic features. We train a general 100-topic latent Dirichlet allocation (LDA) model [72] on the Wikipedia corpus for generalizability. LDA is a generative statistical model used to determine unlabeled topics in a document. For each transcript, we extract the probabilities of each LDA topic. Next, we extract features related to rhetorical structure theory (RST), which is a classic framework for discourse parsing in which partitions of text are arranged in a tree structure by pragmatic relations such as Elaboration or Contrast [73].
Acoustic features. We extract acoustic features from all tasks in which the response is spoken, i.e., the picture description, story recall, and word-colour Stroop tasks. We extract acoustic features with the openSMILE open-source tool [74], which includes features related to formants, loudness, approximations of pitch, including zero-crossing rate and Mel-fre-quency cepstral coefficients (MFCCs) among others. Additionally, we extract the following features that are not extracted by openSMILE: 1) total duration, 2) total duration of active speech divided by total duration of the sample, 3) mean length of all pauses (pause > 150 ms), short pauses (150 ms < pause < 400 ms), and long pauses (pause > 400 ms), and 4) ratio of pauses > 150 ms to non-silent segments.
Results
Correlation across different tasks
In this section, we evaluate the relations between the performance of subjects on different tasks through correlation analysis. For tasks that are scored with multiple measures, e.g., ROUGE-1 and ROUGE-2 in story recall, we consider all the measures and the results are shown inFig 11. We also include age, sex, and the education level in the analysis. Scores within the same task are usually very highly correlated across subjects, as one might expect; therefore, for visualization, we only show correlations between scores across different tasks. Additionally, correlation values that are not significant, with respect to the p = 0.05, are also ignored. We have normalized the scores as follows:
Tasks such as picture description have different stimuli, which may affect the scores. To alleviate this effect, scores are equalized according to their cumulative distribution function (CDF). The resulting scores are therefore uniformly distributed between 0 and 1. This tech-nique is also known as ‘histogram equalization’ or ‘dynamic range expansion’ [75].Fig 12 illus-trates this process for story recall. The original scores for the ‘grandfather story’ are lower than the ‘rainbow story’, suggesting that it is a harder story to recall (Fig 12, bottom). This has been alleviated in the normalized scores, where all stories have similar distribution (Fig 12, left). For tasks that involve binary questions, such as Winograd, CDF is not helpful because the proba-bility distribution function is a Bernoulli process. However, in those tasks, there are multiple stimuli per session that allows for computing an average over stimuli. Taking into account the fact that some stimuli are harder than others, we adopt a weighted average strategy such that the effect of ‘hard’ questions are reduced. That is, the average score is more degraded if a sub-ject answers an easy question incorrectly. The weight of a question represents its ‘simplicity’ and is defined as the rate of correct responses to that question, computed over all available responses to that question. For subjects with more than one session, normalized scores are averaged over all available sessions.
In the Fluency task, the number of tokens ‘in category’ has a moderate correlation with the number of ICUs in the picture description task (ρ = 0.44, p = 9 × 10⁻⁹) and with performance on the image naming task (ρ = 0.43, p = 6 × 10⁻⁸). Similarly, the Rouge-2 score in story recall is correlated with number of ICUs in the picture description task (ρ = 0.41, p = 2 × 10⁻⁷). The Winograd task is correlated with the life satisfaction response in the GDS task (ρ = 0.71, p = 5 × 10⁻²⁰).
Principal component analysis of scores within tasks
Tasks such as GDS and picture description are scored based on different scoring metrics, which we can combine using principal components analysis. The picture description task includes features of both information content and language complexity. InFig 13, the direc-tion and length of the vectors indicate how each scoring metric contributes to the two
principal components. For example, fromFig 13(a), the Dependent clause ratio (DC/C) and Dependent clauses per T-unit (DC/T), which reflect the amount of subordination, are approxi-mately orthogonal to the Coordinate phrases per clause (CP/C) and Coordinate phrases per T-unit (CP/T), which reflect the amount of coordination. They are also approximately orthogo-nal to the number of ICUs. This suggests that DC/C and DC/T measure a very different aspect of the task compared to the CP/C and CP/T metrics. Similarly, fromFig 13(b)regarding GDS, the question about staying at home is approximately orthogonal to the other four questions, which are positively associated with happiness.
Fig 11. Correlation between scores of different tasks. For a better visualization, same-task correlation values are shown in gray and those that are not significant with respect to p = 0.05 are in white. S: # of sentences, T: # of T-units, C: # of clauses, VP: # of verb phrases, CT: # of complex T-units,
CN: # of complex nominals, CP: # of coordinate phrases, DC: # of dependent clauses, MLS: Mean length of sentence, MLTU: Mean length of T-unit, MLC: Mean length of clause.
Unsupervised analysis of data
In order to further evaluate the generalizability of tasks involving spontaneous speech produc-tion, we look for the homogeneity across picture description and story recall tasks. We use t-SNE [76] to visualize features across these tasks. This analysis reveals a cluster, indicated with green ellipsoids acrossFig 14. We further investigate characteristics of the cluster with respect to different scores. We colour the samples by comparing their score against a threshold, to highlight the homogeneity of the cluster with respect to that score. FromFig 14, it can be seen that the cluster is associated with high GDS-Happiness scale and high story recall (Rouge-1) score.
Fig 12. An illustration of score normalization based on a cumulative distribution function, for the story recall task. Bottom:
distribution of the original scores (ROUGE-1); Center: cumulative distribution functions; Left: distribution of the normalized scores.
Data augmentation for the assessment of Alzheimer’s disease
In this experiment, we combine our normative data with DementiaBank (DB), described above. We adopt the approach used by Vasquez-Correa et al [77] for multi-view representation learning via canonical correlation analysis (CCA) to improve the classification of dementia from healthy controls.
CCA computes a projection matrix for every view such that, in the shared space, the corre-lation between the projected samples from different views are maximized. We construct two views using the Talk2Me database. We consider features from the picture description task as the first view and the concatenation of features from the remaining tasks as the second view. Applying CCA on the Talk2Me database provides two projection matrices corresponding to the two views. We then project the DementiaBank data to the shared space using the projec-tion matrix corresponding to the picture descripprojec-tion task. We apply feature selecprojec-tion on the original features of DementiaBank and the selected features are concatenated with the CCA embeddings. Classification is done using an SVM with a radial-basis function kernel.Table 3
shows that, across five feature selection methods, the normative Talk2me data improves overall accuracy; however, an ANOVA test reveals no significant difference. We would encourage exploring additional tools in domain adaptation to handle domain shift and leverage comple-mentary information could be a direction for future research. Moreover, the Talk2Me dataset may be more effective in application domains where participants have demographics more similar to Talk2Me. In the context of AD, it is important to recruit older adults. We will discuss this in the next section.
Following [77], the number of embeddings is set to 20. We also examined a wide range of values for the number of embeddings (i.e., 10, 20, 30 and 40) and also different combinations of tasks to increase the number of views, but no significant difference was observed. We use
Fig 13. PCA analysis of different scores (a) Picture description, (b) GDS tasks.
10-fold cross-validation in all cases. In addition, hyper-parameters are selected through an internal 10-fold cross-validation where the RBF kernel width is selected among [0.01, 1, 10, 100] and the error penalty parameter is set to 1. The number of selected features is selected among 50 to 300 in steps of 50. These settings are determined empirically.
Limitations
We aim to design a platform that can be generalized to various populations, conditions, and tasks; in fact, we have recently applied it to a project involving language delays in elementary school children. However, a limitation of the existing data snapshot is that the age range is
Fig 14. t-SNE reveals a cluster with high GDS happiness score. The cluster also shows high Rouge 1 scores. Scores higher (lower) than a threshold are
in blue (red).
https://doi.org/10.1371/journal.pone.0212342.g014
Table 3. Average accuracies (micro- and macro-) of the classification of dementia with and without CCA features. Columns refer to different feature selection
methods.
FMS [78] Elasticnet [79] KPLS [80] Logo [81] MetaDist [82] No Feature Selection
Without CCA (micro) 76.3 74.8 76.7 77.6 73.7 60.7
With CCA (micro) 78.2 75.8 77.8 78.3 74.5 60.5
Without CCA (macro) 77.2 75.6 77.4 77.6 74.0 69.1
With CCA (macro) 79.0 76.4 78.6 78.2 74.9 68.6
skewed towards young adults, and the majority of users have at least an undergraduate degree. For our work in specific demographics, e.g., in the detection of Alzheimer’s disease, it will be important to recruit more data from a wider range of people. Some potential barriers to recruitment include: older adults not knowing about the study, not being able to access the website, not wanting to put their personal information online, or not understanding the inter-face. These concerns may dissipate over time, as a growing proportion of older adults are using computers and accessing the Internet. For instance, Statistics Canada reports that Inter-net use among 65- to 74-year-olds rose from 65% to 81% in the period between 2013 and 2016, and from 35% to 50% in those aged 75 and older [83]. We intend to increase recruitment of this population through promoting the study on forums and mailing lists for older adults, and in retirement homes, assisted living facilities, and day programs.
Another limitation is the lack of control over recording conditions and environmental noise, which can present a challenge for audio processing. However, this is a consequence of collecting data with a set of microphones and recording conditions representative of the intended use. To be of practical use outside of controlled environments, analyses must be robust against changing channel conditions. In our reported analyses, we have previously attempted to mitigate such factors using spectral noise subtraction [84], and we have shown that software can reduce the effect of the channel in identifying differences in the voice [85]. Moreover, recent research suggests that “training on different noise environments and differ-ent microphones barely affects [speech recognition] performance, especially when several environments are present in the training data” [86].
The demographic and personal health information associated with the dataset are self-reported and have not been clinically validated. This can also be a limitation due to the poten-tial for deliberate participant misrepresentation [87]. However, the cost and complexity associ-ated with obtaining individual clinical assessments are not compatible with our goals of large-scale data collection and repeated, on-going participation.
Conclusion and future work
We have developed a public portal for ongoing longitudinal language data collection from a naturalistic population—there are very few barriers to inclusion. We are releasing the first public ‘snapshot’ of normative data, consisting of 1033 sessions from 196 healthy subjects, including raw data, computed transcripts, features, and scores. We are also releasing a new software package (https://github.com/SPOClab-ca/COVFEFE) that extracts a variety of lexical, syntactic, semantic, pragmatic, and acoustic features for generic speech and language analysis. To our knowledge, this is the most comprehensive publicly available software pipeline for extracting linguistic features. The data and tools enable a common dataset to benchmark mod-els, extend existing data sets with more data, including longitudinal data, and more diverse demographics and tasks. To describe these data, we analyze relations between tasks, and pro-vide normative scores. This enables baselines against which smaller clinical data sets can be compared in the future. The Talk2Me dataset may be used to augment smaller datasets, espe-cially those with demographics similar to Talk2Me. Along these lines, we have started to take a multi-view approach based on canonical correlation analysis, trained on Talk2Me, to improve the accuracy of classification [88].
We are currently recruiting more older adults to use the Talk2Me interface through various means, such as in retirement homes, assisted living facilities, and day programs. Also, we are currently extending the Talk2Me data collection tool to include a telephone-based interface. The telephone-based version of Talk2Me relies on interactive-voice-response and uses the same tasks as in the based version, except for Stroop. Data collection for both the
web-and telephone- based systems is ongoing, web-and we are focusing our efforts on populations of older adults with and without dementia and cognitive decline.
Supporting information
S1 Fig. Demographics survey used on the talk2me website. (PDF)
Author Contributions
Conceptualization: Maria Yancheva, Frank Rudzicz. Data curation: Chloe´ Pou-Prom, Maria Yancheva.
Formal analysis: Majid Komeili, Chloe´ Pou-Prom, Frank Rudzicz. Funding acquisition: Frank Rudzicz.
Investigation: Majid Komeili, Chloe´ Pou-Prom, Frank Rudzicz.
Methodology: Majid Komeili, Chloe´ Pou-Prom, Maria Yancheva, Frank Rudzicz. Project administration: Frank Rudzicz.
Software: Chloe´ Pou-Prom, Daniyal Liaqat, Kathleen C. Fraser, Maria Yancheva, Frank Rudzicz.
Supervision: Frank Rudzicz. Validation: Chloe´ Pou-Prom.
Writing – original draft: Majid Komeili.
Writing – review & editing: Chloe´ Pou-Prom, Daniyal Liaqat, Kathleen C. Fraser, Maria Yan-cheva, Frank Rudzicz.
References
1. Alzheimer’s Association. 2017 Alzheimer’s disease facts and figures. Alzheimer’s & Dementia. 2017; 13(4):325–373.https://doi.org/10.1016/j.jalz.2017.02.001
2. Fraser KC, Meltzer JA, Rudzicz F. Linguistic features identify Alzheimer’s disease in narrative speech. Journal of Alzheimer’s Disease. 2015; 49(2):407–422.https://doi.org/10.3233/JAD-150520
3. Roark B, Mitchell M, Hosom JP, Hollingshead K, Kaye J. Spoken Language Derived Measures for Detecting Mild Cognitive Impairment. IEEE Transactions on Audio, Speech, and Language Processing. 2011; 19(7):2081–2090.https://doi.org/10.1109/TASL.2011.2112351PMID:22199464
4. McKhann GM, Knopman DS, Chertkow H, Hyman BT, Jack CR, Kawas CH, et al. The diagnosis of dementia due to Alzheimer’s disease: Recommendations from the National Institute on Aging-Alzhei-mer’s Association workgroups on diagnostic guidelines for AlzheiAging-Alzhei-mer’s disease. AlzheiAging-Alzhei-mer’s & Demen-tia. 2011; 7(3):263–269.https://doi.org/10.1016/j.jalz.2011.03.005
5. Mueller KD, Hermann B, Mecollari J, Turkstra LS. Connected speech and language in mild cognitive impairment and Alzheimer’s disease: A review of picture description tasks. Journal of Clinical and Experimental Neuropsychology. 2018; 0(0):1–23.
6. Meila´n JJG, Martı´nez-Sa´nchez F, Carro J, Lo´pez DE, Millian-Morell L, Arana JM. Speech in Alzheimer’s Disease: Can Temporal and Acoustic Parameters Discriminate Dementia? Dementia and Geriatric Cognitive Disorders. 2014; 37:327–334.https://doi.org/10.1159/000356726PMID:24481220
7. Forbes-McKay KE, Venneri A. Detecting subtle spontaneous language decline in early Alzheimer’s dis-ease with a picture description task. Neurological Sciences. 2005; 26(4):243–254.https://doi.org/10. 1007/s10072-005-0467-9PMID:16193251
8. Jarrold W, Peintner B, Wilkins D, Vergryi D, Richey C, Gorno-Tempini ML, et al. Aided diagnosis of dementia type through computer-based analysis of spontaneous speech. In: Proceedings of the Work-shop on Computational Linguistics and Clinical Psychology: From Linguistic Signal to Clinical Reality.
Stroudsburg, PA, USA: Association for Computational Linguistics; 2014. p. 27–37. Available from:
http://aclweb.org/anthology/W14-3204.
9. De Lira JO, Ortiz KZ, Campanha AC, Bertolucci PHF, Minett TSC. Microlinguistic aspects of the oral narrative in patients with Alzheimer’s disease. International Psychogeriatrics. 2011; 23(03):404–412.
https://doi.org/10.1017/S1041610210001092PMID:20699046
10. Giles E, Patterson K, Hodges JR. Performance on the Boston Cookie theft picture description task in patients with early dementia of the Alzheimer’s type: Missing information. Aphasiology. 1996; 10(4):395–408.https://doi.org/10.1080/02687039608248419
11. Becker JT, Boller F, Lopez OI, Saxton J, McGonigle KL. The Natural History of Alzheimer’s Disease: Description of Study Cohort and Accuracy of Diagnosis. Archives of Neurology. 1994; 51(6):585–594.
https://doi.org/10.1001/archneur.1994.00540180063015PMID:8198470
12. Goodglass H, Kaplan E. Boston Diagnostic Aphasia Examination. 1. Lea & Febinger, Philadelphia; 1983.
13. Yancheva M, Rudzicz F. Vector-space topic models for detecting Alzheimer’s disease. In: Proceedings of the 54th Annual Meeting of the Association for Computational Linguistics (Volume 1: Long Papers). vol. 1; 2016. p. 2337–2346.
14. Wankerl S, No¨th E, Evert S. An N-Gram Based Approach to the Automatic Diagnosis of Alzheimer’s Disease from Spoken Language. In: Interspeech 2017. ISCA: ISCA; 2017. p. 3162–3166. Available from:http://www.isca-speech.org/archive/Interspeech_2017/abstracts/1572.html.
15. Kirshner HS, Webb WG, Kelly MP. The naming disorder of dementia. Neuropsychologia. 1984; 22(1):23–30.https://doi.org/10.1016/0028-3932(84)90004-6PMID:6709173
16. Henry JD, Crawford JR, Phillips LH. Verbal fluency performance in dementia of the Alzheimer’s type: a meta-analysis. Neuropsychologia. 2004; 42(9):1212–1222.https://doi.org/10.1016/j.neuropsychologia. 2004.02.001PMID:15178173
17. Pendlebury ST, Welch SJV, Cuthbertson FC, Mariz J, Mehta Z, Rothwell PM. Telephone Assessment of Cognition After Transient Ischemic Attack and Stroke: Modified Telephone Interview of Cognitive Sta-tus and Telephone Montreal Cognitive Assessment Versus Face-to-Face Montreal Cognitive Assess-ment and Neuropsychological Battery. Stroke. 2013; 44(1):227–229.https://doi.org/10.1161/ STROKEAHA.112.673384PMID:23138443
18. Rapcan V, D’Arcy S, Penard N, Robertson IH, Reilly RB. The use of telephone speech recordings for assessment and monitoring of cognitive function in elderly people. In: Tenth Annual Conference of the International Speech Communication Association; 2009.
19. Yu B, Williamson JR, Mundt J, Quatieri TF. Speech-Based Automated Cognitive Impairment Detection from Remotely-Collected Cognitive Test Audio. IEEE Access. 2018;.
20. Van Mierlo LD, Wouters H, Sikkes SAM, Van der Flier WM, Prins ND, Bremer JAE, et al. Screening for Mild Cognitive Impairment and Dementia with Automated, Anonymous Online and Telephone Cognitive Self-Tests. Journal of Alzheimer’s Disease. 2017; 56(1):249–259.https://doi.org/10.3233/JAD-160566
PMID:27911296
21. Folstein MF, Folstein SE, McHugh PR. Mini-mental state. A practical method for grading the cognitive state of patients for the clinician. Journal of Psychiatric Research. 1975; 12(3):189–98.https://doi.org/ 10.1016/0022-3956(75)90026-6PMID:1202204
22. Nasreddine ZS, Phillips NA, Be´dirian V, Charbonneau S, Whitehead V, Collin I, et al. The Montreal Cog-nitive Assessment, MoCA: A Brief Screening Tool For Mild CogCog-nitive Impairment. Journal of the Ameri-can Geriatrics Society. 2005; 53(4):695–699.https://doi.org/10.1111/j.1532-5415.2005.53221.xPMID:
15817019
23. Kertesz A, McCabe P. Recovery patterns and prognosis in aphasia. Brain. 1977; 100 Pt 1:1–18.https:// doi.org/10.1093/brain/100.1.1PMID:861709
24. Griffin G, Holub A, Perona P. Caltech-256 Object Category Dataset; 2007. Available from:https:// authors.library.caltech.edu/7694/.
25. Webber SG. Webber photo cards: Story starters. Super Duper Publications; 2005.
26. Woods DL, Wyma JM, Herron TJ, Yund EW. Computerized analysis of verbal fluency: Normative data and the effects of repeated testing, simulated malingering, and traumatic brain injury. PLoS ONE. 2016; 11(12):1–37.https://doi.org/10.1371/journal.pone.0166439
27. Clark DG, Kapur P, Geldmacher DS, Brockington JC, Harrell L, DeRamus TP, et al. Latent information in fluency lists predicts functional decline in persons at risk for Alzheimer disease. Cortex. 2014;https:// doi.org/10.1016/j.cortex.2013.12.013
28. Van Riper C. Speech Correction: Principles and Methods. Prentice-Hall; 1963.
29. Fairbanks G. Voice and articulation drillbook. Joanna Cotler Books; 1960. Available from:https://books. google.ca/books?id=qN1ZAAAAMAAJ.
30. Francis WN, Kucera H. Brown corpus manual. Brown University. 1979; 2.
31. Kuperman V, Stadthagen-Gonzalez H, Brysbaert M. Age-of-acquisition ratings for 30,000 English words. Behavior Research Methods. 2012; 44(4):978–990.https://doi.org/10.3758/s13428-012-0210-4
PMID:22581493
32. Levesque HJ, Davis E, Morgenstern L. The Winograd Schema Challenge. In: Proceedings of the Thir-teenth International Conference on Principles of Knowledge Representation and Reasoning; 2012. p. 552–561.
33. Stroop JR. Studies of interference in serial verbal reactions. Journal of Experimental Psychology. 1935; 18(6):643.https://doi.org/10.1037/h0054651
34. Ben-David BM, Tewari A, Shakuf V, Van Lieshout PHHM. Stroop Effects in Alzheimer’s Disease: Selec-tive Attention of Processing, or Color-naming? A Meta-Analysis. Journal of Alzheimer’s Disease. 2014; 38:923–938.https://doi.org/10.3233/JAD-131244PMID:24100125
35. Epp AM, Dobson KS, Dozois DJA, Frewen PA. A systematic meta-analysis of the Stroop task in depres-sion. Clinical Psychology Review. 2012; 32(4):316–328.https://doi.org/10.1016/j.cpr.2012.02.005
PMID:22459792
36. Kravariti E, Schulze K, Kane F, Kalidini S, Bramon E, Walshe M, et al. Stroop-test interference in bipolar disorder. British Journal of Psychiatry. 2009; 194(3):285–286.https://doi.org/10.1192/bjp.bp.108. 052639PMID:19252161
37. van Marwijk HW, Wallace P, de Bock GH, Hermans J, Kaptein AA, Mulder JD. Evaluation of the feasibil-ity, reliability and diagnostic value of shortened versions of the geriatric depression scale. The British Journal of General Practice. 1995; 45(393):195–199. PMID:7612321
38. Yesavage JA, Brink TL, Rose TL, Lum O, Huang V, Adey M, et al. Development and validation of a geri-atric depression screening scale: a preliminary report. Journal of psychigeri-atric research. 1983; 17(1):37– 49.https://doi.org/10.1016/0022-3956(82)90033-4
39. Povey D, Ghoshal A, Boulianne G, Burget L, Glembek O, Goel N, et al. The Kaldi speech recognition toolkit. In: IEEE Workshop on Automatic Speech Recognition and Understanding; 2011. p. 1–4.
40. Verma P, Das PK. i-Vectors in speech processing applications: A survey. International Journal of Speech Technology. 2015; 18(4):529–546.https://doi.org/10.1007/s10772-015-9295-3
41. Cieri C, Graff D, Kimball O, Miller D, Walker K. Fisher English Training Speech Parts 1 and 2 Transcripts LDC2004T19 and LDC2005T19; 2005.https://catalog.ldc.upenn.edu/ldc2005t19, Linguistic Data Consortium.
42. Xiong W, Droppo J, Huang X, Seide F, Seltzer ML, Stolcke A, et al. Toward Human Parity in Conversa-tional Speech Recognition. IEEE/ACM Transactions on Audio Speech and Language Processing. 2017; 25(12):2410–2423.https://doi.org/10.1109/TASLP.2017.2756440
43. Fraser KC, Ben-David N, Hirst G, Graham N, Rochon E. Sentence segmentation of aphasic speech. In: Proceedings of the 2015 Conference of the North American Chapter of the Association for Computa-tional Linguistics: Human Language Technologies; 2015. p. 862–871.
44. Wu Z, Palmer M. Verbs semantics and lexical selection. In: Proceedings of the 32nd annual meeting on Association for Computational Linguistics. Association for Computational Linguistics; 1994. p. 133–138.
45. Bird S, Klein E, Loper E. Natural Language Processing with Python. O’Reilly Media; 2009.
46. Lu X. Automatic analysis of syntactic complexity in second language writing. International journal of cor-pus linguistics. 2010; 15(4):474–496.https://doi.org/10.1075/ijcl.15.4.02lu
47. Lin D. An Information-Theoretic Definition of Similarity. In: Proceedings of ICML; 1998. p. 296–304.
48. Kuhn HW. The Hungarian method for the assignment problem. Naval research logistics quarterly. 1955; 2(1-2):83–97.https://doi.org/10.1002/nav.3800020109
49. Herd P, Carr D, Roan C. Cohort Profile: Wisconsin longitudinal study (WLS). International Journal of Epidemiology. 2014; 43:34–41.https://doi.org/10.1093/ije/dys194PMID:24585852
50. Adlam ALR, Bozeat S, Arnold R, Watson P, Hodges JR. Semantic knowledge in mild cognitive impairment and mild Alzheimer’s disease. Cortex. 2006; 42(5):675–84. https://doi.org/10.1016/S0010-9452(08)70404-0PMID:16909626
51. Cooper DB, Epker M, Lacritz L, Weine M, Rosenberg RN, Honig L, et al. Effects of practice on category fluency in Alzheimer’s disease. The Clinical neuropsychologist. 2001; 15(1):125–128.https://doi.org/ 10.1076/clin.15.1.125.1914PMID:11778573
52. Lin CY, Hovy E. Automatic evaluation of summaries using N-gram co-occurrence statistics. In: Pro-ceedings of the 2003 Conference of the North American Chapter of the Association for Computational Linguistics on Human Language Technology—NAACL’03. vol. 1. Morristown, NJ, USA: Association for Computational Linguistics; 2003. p. 71–78. Available from:http://portal.acm.org/citation.cfm?doid= 1073445.1073465.
53. Papineni K, Roukos S, Ward T, Zhu WJ. BLEU: A method for automatic evaluation of machine transla-tion. In: Proceedings of the 40th Annual Meeting of the Association for Computational Linguistics (ACL); 2002. p. 311—-318. Available from:http://citeseerx.ist.psu.edu/viewdoc/summary?doi=10.1.1.19.9416.
54. Miller GA. WordNet: a lexical database for English. Communications of the ACM. 1995; 38(11):39–41.
https://doi.org/10.1145/219717.219748
55. Covington MA, McFall JD. Cutting the Gordian Knot: The Moving-Average Type-Token Ratio (MATTR). Journal of Quantitative Linguistics. 2010; 17(2):94–100.https://doi.org/10.1080/09296171003643098
56. Bucks RS, Singh S, Cuerden JM, Wilcock GK. Analysis of spontaneous, conversational speech in dementia of Alzheimer type: Evaluation of an objective technique for analyzing lexical performance. Aphasiology. 2000; 14(1):71–91.https://doi.org/10.1080/026870300401603
57. Kincaid JP, Fishburne Jr RP, Rogers RL, Chissom BS. Derivation of new readability formulas (auto-mated readability index, FOG count and Flesch reading ease formula) for Navy enlisted personnel. Naval Technical Training Command Millington TN Research Branch; 1975.
58. Wilson T, Wiebe J, Hoffmann P. Recognizing contextual polarity in phrase-level sentiment analysis. In: Proceedings of the conference on human language technology and empirical methods in natural lan-guage processing. Association for Computational Linguistics; 2005. p. 347–354.
59. Manning CD, Surdeanu M, Bauer J, Finkel JR, Bethard S, McClosky D. The Stanford coreNLP natural language processing toolkit. In: ACL (System Demonstrations); 2014. p. 55–60.
60. Brysbaert M, New B. Moving beyond Kučera and Francis: A critical evaluation of current word frequency
norms and the introduction of a new and improved word frequency measure for American English. Behavior Research Methods. 2009; 41(4):977–990.https://doi.org/10.3758/BRM.41.4.977PMID:
19897807
61. Stadthagen-Gonzalez H, Davis CJ. The Bristol norms for age of acquisition, imageability, and familiar-ity. Behavior Research Methods. 2006; 38(4):598–605.https://doi.org/10.3758/BF03193891PMID:
17393830
62. Gilhooly KJ, Logie RH. Age-of-acquisition, imagery, concreteness, familiarity, and ambiguity measures for 1,944 words. Behavior Research Methods & Instrumentation. 1980; 12(4):395–427.https://doi.org/ 10.3758/BF03201693
63. Bradley MM, Lang PPJ. Affective Norms for English Words (ANEW): Instruction Manual and Affective Ratings. Psychology. 1999; Technical(C-1):0.
64. Warriner AB, Kuperman V, Brysbaert M. Norms of valence, arousal, and dominance for 13,915 English lemmas. Behavior Research Methods. 2013; 45(4):1191–1207. https://doi.org/10.3758/s13428-012-0314-xPMID:23404613
65. Pennebaker JW, Boyd RL, Jordan K, Blackburn K. The Development and Psychometric Properties of LIWC2015. Psychology. 2015;.
66. Yngve VH. A model and an hypothesis for language structure. Proceedings of the American philosophi-cal society. 1960; 104(5):444–466.
67. Snowdon DA, Kemper SJ, Mortimer JA, Greiner LH, Wekstein DR, Markesbery WR. Linguistic ability in early life and cognitive function and Alzheimer’s disease in late life. Findings from the Nun Study. Jour-nal of the American Medical Association. 1996; 275(7):528–32.https://doi.org/10.1001/jama.1996. 03530310034029PMID:8606473
68. Resnik P. Using information content to evaluate semantic similarity in a taxonomy. arXiv preprint cmp-lg/9511007. 1995;.
69. Jiang JJ, Conrath DW. Semantic similarity based on corpus statistics and lexical taxonomy. arXiv pre-print cmp-lg/9709008. 1997;.
70. Leacock C, Chodorow M. Combining local context and WordNet similarity for word sense identification. WordNet: An electronic lexical database. 1998; 49(2):265–283.
71. Wu Z, Palmer M. Verbs semantics and lexical selection. In: Proceedings of the 32nd annual meeting on Association for Computational Linguistics. Association for Computational Linguistics; 1994. p. 133–138.
72. Blei DM, Ng AY, Jordan MI. Latent dirichlet allocation. Journal of Machine Learning Research. 2003; 3 (Jan):993–1022.
73. Mann WC, Thompson SA. Rhetorical structure theory: Toward a functional theory of text organization. Text-Interdisciplinary Journal for the Study of Discourse. 1988; 8(3):243–281.https://doi.org/10.1515/ text.1.1988.8.3.243
74. Eyben F, Weninger F, Gross F, Schuller B. Recent developments in openSMILE, the munich open-source multimedia feature extractor. In: Proceedings of the 21st ACM international conference on Multi-media—MM’13. New York, New York, USA: ACM Press; 2013. p. 835–838. Available from:http://dl. acm.org/citation.cfm?doid=2502081.2502224.
75. Gonzalez RC. Digital image processing. Prentice Hall; 2016.
76. Maaten Lvd, Hinton G. Visualizing data using t-SNE. Journal of Machine Learning Research. 2008; 9(Nov):2579–2605.
77. Vasquez-Correa JC, Orozco-Arroyave JR, Arora R, No¨th E, Dehak N, Christensen H, et al. Multi-view representation learning via gcca for multimodal analysis of Parkinson’s disease. In: Acoustics, Speech and Signal Processing (ICASSP), 2017 IEEE International Conference on. IEEE; 2017. p. 2966–2970.
78. Cheng Q, Zhou H, Cheng J. The Fisher-Markov selector: fast selecting maximally separable feature subset for multiclass classification with applications to high-dimensional data. IEEE transactions on pat-tern analysis and machine intelligence. 2011; 33(6):1217–1233.https://doi.org/10.1109/TPAMI.2010. 195PMID:21493968
79. Zou H, Hastie T. Regularization and variable selection via the elastic net. Journal of the Royal Statistical Society: Series B (Statistical Methodology). 2005; 67(2):301–320.https://doi.org/10.1111/j.1467-9868. 2005.00503.x
80. Sun S, Peng Q, Shakoor A. A kernel-based multivariate feature selection method for microarray data classification. PloS one. 2014; 9(7):e102541.https://doi.org/10.1371/journal.pone.0102541PMID:
25048512
81. Sun Y, Todorovic S, Goodison S. Local-learning-based feature selection for high-dimensional data analysis. IEEE transactions on pattern analysis and machine intelligence. 2010; 32(9):1610–1626.
https://doi.org/10.1109/TPAMI.2009.190PMID:20634556
82. Liu Z, Hsiao W, Cantarel BL, Dra´bek EF, Fraser-Liggett C. Sparse distance-based learning for simulta-neous multiclass classification and feature selection of metagenomic data. Bioinformatics. 2011; 27(23):3242–3249.https://doi.org/10.1093/bioinformatics/btr547PMID:21984758
83. Statistics Canada. Life in the fast lane: How are Canadians managing?; 2017. Available from:https:// www150.statcan.gc.ca/n1/daily-quotidien/171114/dq171114a-eng.htm.
84. Kirubagari B, Palanivel S, Subathra NSNT. Speech enhancement using minimum mean square error fil-ter and spectral subtraction filfil-ter. In: Infil-ternational Conference on Information Communication and Embedded Systems (ICICES2014); 2014. p. 1–7.
85. Hsu YT, Zhu Z, Wang CT, Fang SH, Rudzicz F. Robustness against the channel effect in pathological voice detection. In: Proceedings of Machine Learning for Health (ML4H) at NIPS; 2018.
86. Vincent E, Watanabe S, Nugraha AA, Barker J, Vincent E, Watanabe S, et al. An analysis of environ-ment, microphone and data simulation mismatches in robust speech recognition To cite this version:. Computer Speech and Language. 2017; 46(C):535–557.https://doi.org/10.1016/j.csl.2016.11.005
87. Shapiro DN, Chandler J, Mueller PA. Using Mechanical Turk to study clinical populations. Clinical Psy-chological Science. 2013; 1(2):213–220.https://doi.org/10.1177/2167702612469015
88. Pou-Prom C, Rudzicz F. Learning multiview embeddings for assessing dementia. In: Proceedings of EMNLP 2018; 2018.