Supporting Information
One-Step Approach to Single-Ensemble CdS Magic-Size Clusters with Enhanced Production Yields
Jing Zhang,† Lijia Li,‡ Nelson Rowell,§ Theo Kreouzis,II Maureen Willis,†,II
Hongsong Fan,‡ Chunchun Zhang,⊥ Wen Huang,#
Meng Zhang,*,† Kui Yu*,†,‡,@
†Institute of Atomic and Molecular Physics, Sichuan University, Chengdu,
Sichuan 610065, People’s Republic of China
‡Engineering Research Center in Biomaterials, Sichuan University, Chengdu,
Sichuan 610065, People’s Republic of China
§Metrology Research Centre, National Research Council Canada,
Ottawa, Ontario K1A 0R6, Canada
IISchool of Physics and Astronomy, Queen Mary University of London,
London E1 4NS, United Kingdom
⊥Analytical & Testing Center, Sichuan University, Chengdu,
Sichuan 610065, People’s Republic of China
#Laboratory of Ethnopharmacology, West China School of Medicine,
Sichuan University, Chengdu, Sichuan 610065, People’s Republic of China
@State Key Laboratory of Polymer Materials Engineering, Chengdu,
Sichuan 610065, People’s Republic of China
S1
Table of contents
Experimental Methods S1
Table S1 Experimental summary of our synthesis and characterization S3
Figure S1-1. Absorption evolution of Fig 1 reactions 1 and 2 samples S4 Figure S1-2a. Fig 1 reaction 1 sample dispersions before and after incubation S5 Figure S1-2b. Fig 1 reaction 2 sample dispersions before and after incubation S6 Figure S1-3. Evolution of absorption of Cd(OA)2 + S + HPPh2 and
Cd(OA)2 + SPPh2H samples S7
Figure S2-1a. Fig 2 top-panel reactions 1 and 2 early-stage sample S8 Figure S2-1b. Fig 2 bottom-panel reactions 1 and 2 early-stage sample S8 Figure S2-2. Fig 2 reaction 1 sample dispersions before and after incubation S9
Figure S2-3. Comparison of the PC yield S10
Figure S2-4. Evolution of sample absorption from Cd(OA)2 + S + HPPh2 + OA S11
Figure S3-1. Fig 3a reaction sample dispersions before and after incubation S12 Figure S3-2. Fig 3b reaction sample dispersions before and after incubation S13
Figure S4-1. Absorption evolution of Cd(MA)2 + S + HPPh2 of 60 to 160 C samples S14
Figure S4-2a. Absorption evolution of Cd(MA)2 + S + HPPh2 at 100 C samples S15
Figure S4-2b. Fig S4-2a reaction sample dispersions before and after incubation S16
EXPERIMENTAL METHODS
Chemicals. Cadmium oxide (CdO, 99.99%), oleic acid (OA, 90%), 1-octadecene (1-ODE, 90%), 2methylbutyric acid (98%), 2, 2dimethylbutyric acid (96%), diphenylphosphine (HPPh2,
98%), and 2-methyloctadecanoic acid (MA, 97%), were purchased from Sigma-Aldrich. Sulfur powder (S, 99.5%), toluene (A. R.), were obtained from Chengdu Ke Long Chemical. All chemicals were used as received without purification (except otherwise mentioned).
Synthesis and Characterization. For a typical reaction of Cd(OA)2 + S + HPPh2 (Figure 1),
S2
(4.5453 g) were loaded into a 50 mL three-necked round bottom flask at room temperature. The mixture was evacuated and filled with N2, with the procedure repeated for three times.
The reaction batch was then heated up to ∼240 C upon stirring in N2 to get a clear colorless
solution. The resulting solution was cooled to 120 C and retained at this temperature for 60 min under vacuum. The sample was then purged with N2 and cooled further to 40 C.
Sulphur powder (0.0048 g, 0.15 mmol) and HPPh2 (100 L, 0.60 mmol) were added into the
flask to result in a total mass of ~5.0000 g. The eventual reaction batch has a 4Cd to 1S feed molar ratio with a S concentration of ~30 mmol/kg.
For the reactions with the addition of methyl carboxylic acid shown in Figures 2 and 3, 1.75 mmol of methyl carboxylic acid (such as 2-methyloctadecanoic acid (MA) or 2-methylbutyric acid or 2,2-dimethylbutyric acid) was added in the induction period of the reaction batches of Cd(OA)2 + S + HPPh2 (after 10 min at 40 C) or Cd(OA)2 + S (after 15 min
at 180 C). For the reaction of Cd(MA)2 + S +HPPh2 shown in Figure 4, MA (1.32 mmol) was
used to replace OA as described above for the Cd(OA)2 + S + HPPh2 reaction.
The reactions were carried out with a temperature increase mode or a constant
temperature mode. For the former mode, a reaction was heated up to from 40 to 160 C in a stepwise manner with an interval of 20 °C, holding at each temperature for 10 min. Samples were then extracted. For the latter mode, a reaction was held initially at 40 C for 10 min and was then heated to a constant temperature of 100 C; samples were taken after various reaction periods.
For optical absorption characterization, different amounts of as-synthesized samples were used to disperse in different volumes of toluene. For the reactions without HPPh2, an
aliquot of 25 L of each sample was dispersed in 3.0 mL of toluene. For the reactions with HPPh2, an aliquot of 10 L of each sample were dispersed in 6.0 mL of toluene. Sometimes,
the measurements were performed also after a one-day incubation at room temperature. The absorption spectra were carried out using a TECHCOMP UV 2310 II and Hitachi UH4150 ultraviolet-visible (UV-Vis) spectrometer, with a data collection interval of 1 nm.
S3
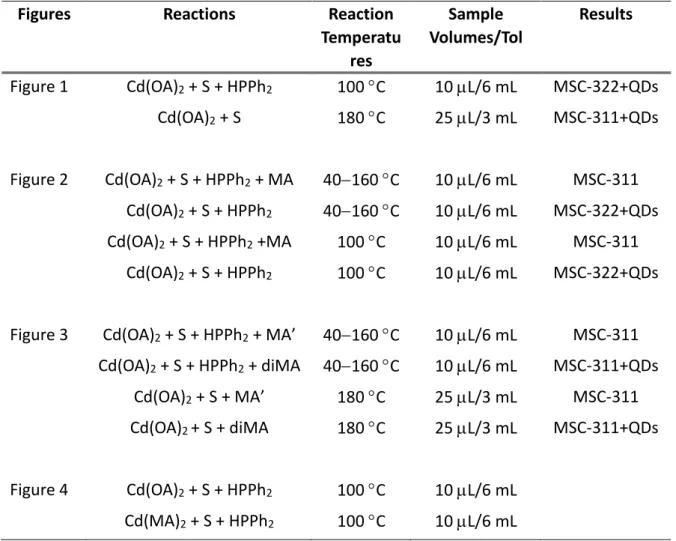
Table S1. Experimental summary of our synthesis and optical characterization.
Figures Reactions Reaction
Temperatu res Sample Volumes/Tol Results Figure 1 Cd(OA)2 + S + HPPh2 100 C 10 L/6 mL MSC-322+QDs Cd(OA)2 + S 180 C 25 L/3 mL MSC-311+QDs Figure 2 Cd(OA)2 + S + HPPh2 + MA 40160 C 10 L/6 mL MSC-311 Cd(OA)2 + S + HPPh2 40160 C 10 L/6 mL MSC-322+QDs Cd(OA)2 + S + HPPh2 +MA 100 C 10 L/6 mL MSC-311 Cd(OA)2 + S + HPPh2 100 C 10 L/6 mL MSC-322+QDs
Figure 3 Cd(OA)2 + S + HPPh2 + MA’ 40160 C 10 L/6 mL MSC-311
Cd(OA)2 + S + HPPh2 + diMA 40160 C 10 L/6 mL MSC-311+QDs
Cd(OA)2 + S + MA’ 180 C 25 L/3 mL MSC-311
Cd(OA)2 + S + diMA 180 C 25 L/3 mL MSC-311+QDs
Figure 4 Cd(OA)2 + S + HPPh2 100 C 10 L/6 mL
Cd(MA)2 + S + HPPh2 100 C 10 L/6 mL
MA’: 2methylbutyric acid diMA: 2, 2dimethylbutyric acid
S4
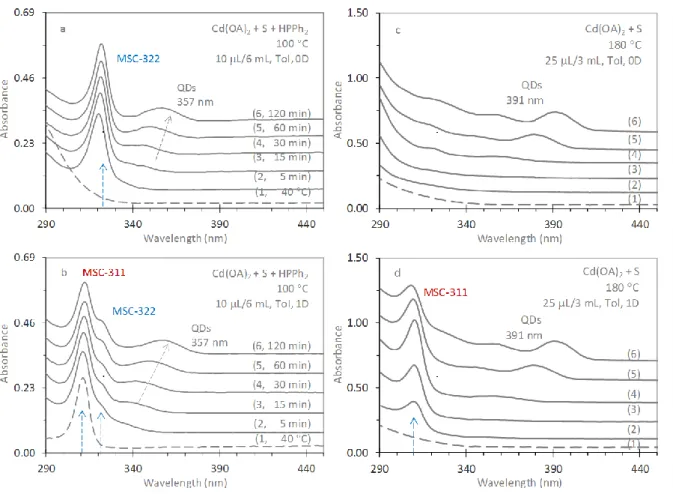
Figure S1-1. Evolution of optical absorption properties of samples extracted from the reactions: Cd(OA)2 + S + HPPh2 (reaction 1, a) and Cd(OA)2 + S (reaction 2, c) in ODE. Both
reactions were held at 40 C for 10 min with one sample extracted (1, dashed lines). The reaction temperature was then increased to and held at 100 C and 180 C, respectively. Samples were taken at (2) 5, (3) 15, (4) 30, (5) 60, and (6) 120 min. The samples (10 μL each) from reaction 1 were dispersed in 6.0 mL of toluene, and those (25 μL each) from reaction 2 were dispersed in 3.0 mL of toluene. All sample dispersions were measured again after a one-day room-temperature incubation (b and d). MSC-322 was monitored directly from the reaction 1 sample dispersions (a), which transformed partially to MSC-311 after a one-day incubation (b). On the other hand, MSC-311 evolved during a 1day incubation for the reaction 2 sample dispersions (d) that were initially transparent in optical absorption (c).
S5
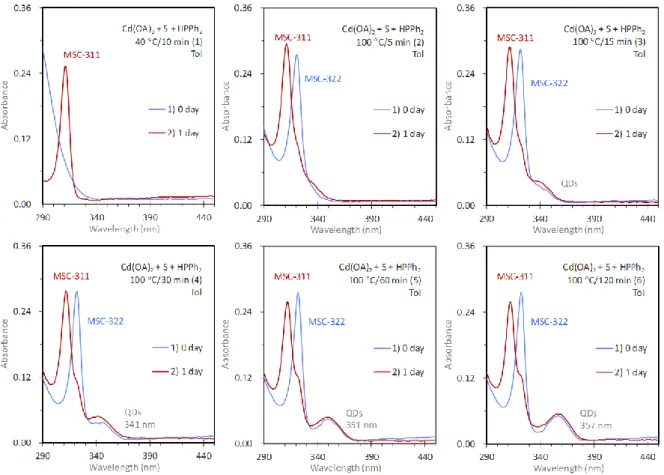
Figure S1-2a. Absorption spectra of samples collected from reaction 1 (Cd(OA)2 + S + HPPh2)
performed with a constant reaction temperature of 100 C. The reaction was held at 40 C for 10 min and the first sample (1) was obtained; afterwards, the temperature reaction was increased to 100 C with samples extracted at (2) 5, (3) 15, (4) 30, (5) 60 and (6) 120 min. The samples (10 μL each) were dispersed in 6.0 mL of toluene. The spectra were collected before (blue traces) and after (red traces) a one-day room-temperature incubation. MSC-322 seems to transform partially to MSC-311 during the incubation.
S6
Figure S1-2b. Absorption spectra of samples collected from reaction 2 (Cd(OA)2 + S without
the use of HPPh2), which was performed with a constant reaction temperature mode at 180
C. The reaction was initially held at 40 C for 10 min and the first sample (1) was obtained; afterwards, the temperature reaction was increased to 180 C with samples extracted at (2) 5, (3) 15, (4) 30, (5) 60 and (6) 120 min. The samples (25 μL each) were dispersed in 3.0 mL of toluene. The spectra were collected before (blue traces) and after (red traces) a one-day room-temperature incubation. MSC-311 evolves during the incubation.
S7
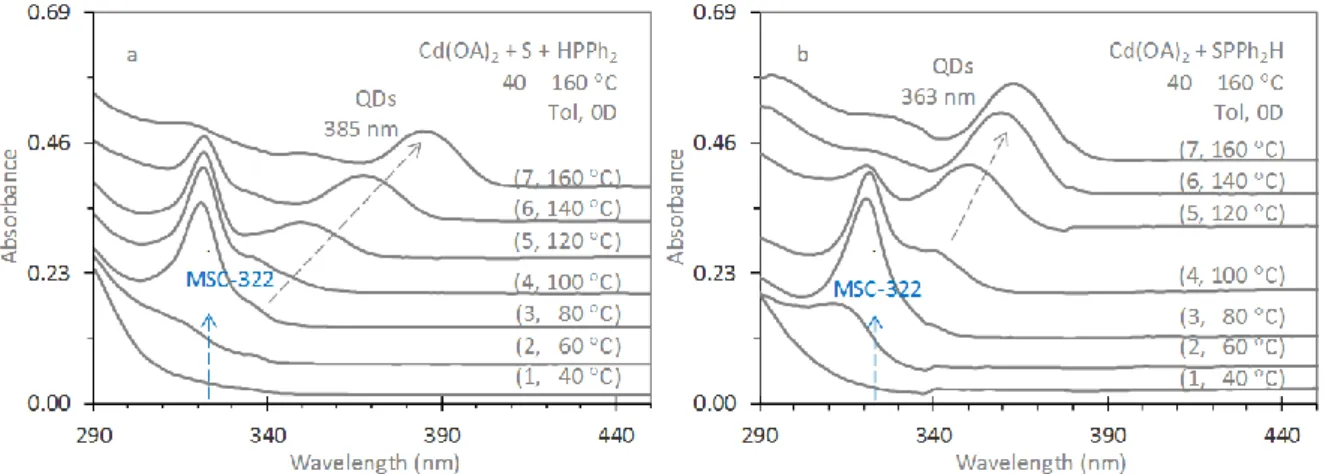
Figure S1-3. Optical absorption properties of the samples extracted from the reactions of Cd(OA)2 + S + HPPh2 (a) and Cd(OA)2 + SPPh2H (b) in ODE (with a temperature increase
mode). The preparation of SPPh2H was carried out in a glovebox with a mixture of S (0.0048
g, 0.15 mmol) and HPPh2 (100 L, 0.60 mmol) at 70 C for 5 min. Seven samples were
collected from each of the two reactions, when the temperature was held for 10 min at (1) 40, (2) 60, (3) 80, (4) 100, (5) 120, (6) 140, and (7) 160 C. Regarding the evolution of both MSCs and QDs, the two reactions seem to be similar. Such a similar growth pattern supports that SPPh2H is the very S precursor to react with the Cd precursor for the reaction of Cd(OA)2
S8
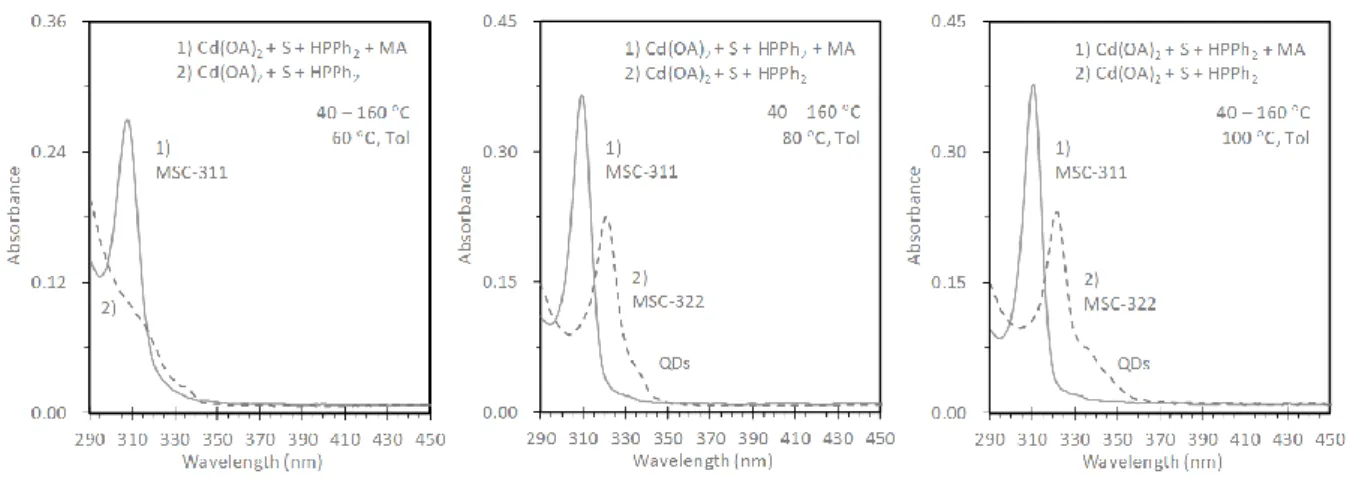
Figure S2-1a. Comparison of the optical absorption spectra for the samples collected from Reaction 1 Cd(OA)2 + S + HPPh2 + MA (solid traces) and Reaction 2 Cd(OA)2 + S + HPPh2
(dashed traces), as referenced in the top panel of Figure 2. The three samples (taken from each batch during the temperature increase from 40 to 160 C) are indicated. The nucleation and growth of QDs was suppressed by the addition of MA in the induction period at 40 C.
Figure S2-1b. Comparison of the optical absorption spectra for the samples collected from Reaction 1 Cd(OA)2 + S + HPPh2 + MA (solid traces) and Reaction 2 Cd(OA)2 + S + HPPh2
(dashed traces), as referenced in the bottom panel of Figure 2. The growth periods for the two samples (extracted from each batch at a constant reaction temperature of 100 C) are indicated.
S9
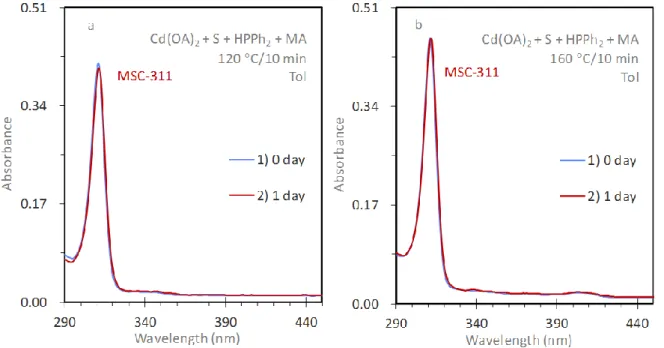
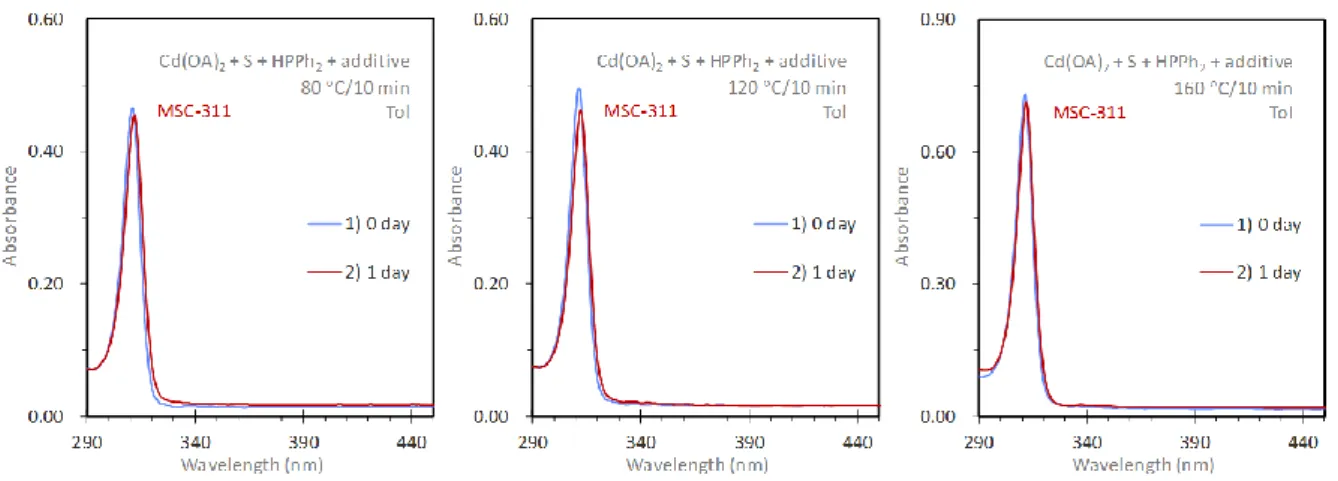
Figure S2-2. Comparison of optical absorption of three sample dispersions before (blue traces) and after (red traces) a one-day room-temperature incubation. The samples were collected from Reaction 1 shown in Figure 2, Cd(OA)2 + S + HPPh2 + MA. Evidently, there is no
significant change in the MSC-311 population after the incubation, as demonstrated by the 120 (a) and 160 C (b) sample dispersions. Therefore, it seems the majority of the PC had transformed into MSC-311 during the reaction.
S10
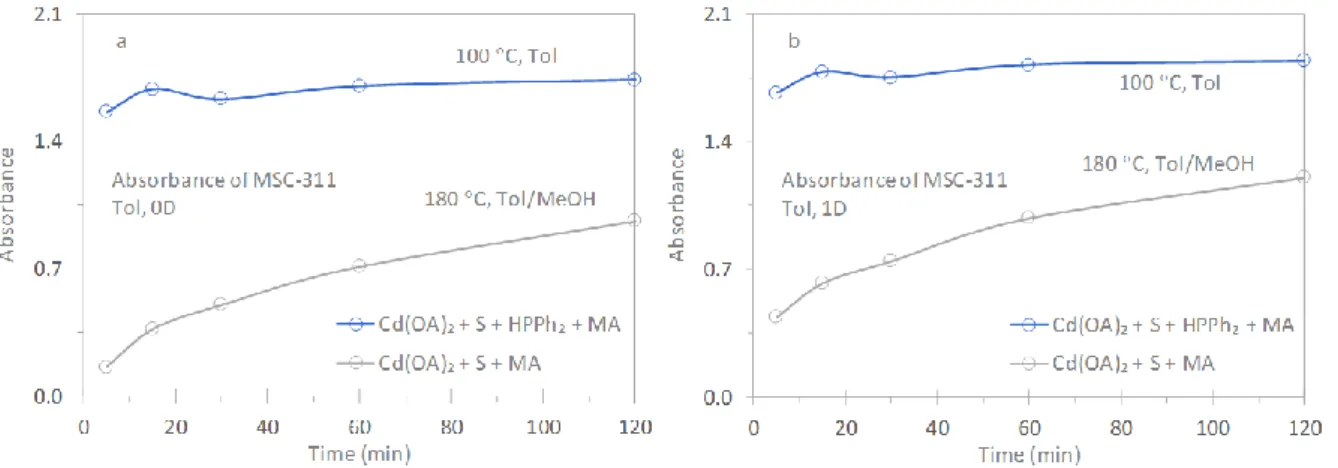
Figure S2-3. Summary of the absorbance at 311 nm for MSC-311 obtained from the sample dispersions before (a, 0D) and after (b, 1D) a 1 day room-temperature incubation. The samples were extracted from reaction Cd(OA)2 + S + HPPh2 + MA at 100 C (blue circles, the
addition of MA was at 40 °C which was held for 10 min) and reaction Cd(OA)2 + S + MA at
180 C (gray circles, the addition of MA was at 180 C which was held for 15 min). The solvent used was Tol (6.00 mL) for each (10 L) of the former reaction samples, and was a mixture of Tol (2.95 mL)MeOH (0.05 mL) for each (25 L) of the latter reaction samples.1
The absorbance at 311 nm for the former reaction sample dispersions has been multiplied by a factor of 5. Based on the assumption that the amount of MSC-311 monitored
represents that of the PC produced, the production yield of the PC for the former reaction at 100 C is estimated to have increased by ~80% for the 120 min sample and ~90% for the 60 min sample, as compared with the latter reaction at 180 C. As a side note, we tried to estimate the reaction yield for reaction Cd(OA)2 + S + HPPh2 + MA. MA was added at 40
C/10 min; afterwards, the reaction temperature was increased to 100 C (inside 5 min) and was held for 1 h. The reaction temperature was decreased to room temperature. For a dispersion prepared with 10 L (product) in 6 mL Tol, the absorption spectrum displays the peak position of 311 nm and absorbance of 0.37. The reaction product was divided into two parts, each was dispersed in 3.0 mL of Tol; 9.0 mL acetone was added. Centrifugation was performed with 8000 rpm for 3 min. After the removal of the supernatant, 1.5 mL Tol was added followed by 5.0 mL acetone. Centrifugation was carried again under the same condition. The supernatant was removed and the precipitate was dried under ambient condition. About 50 mg precipitate was obtained, and the product yield is estimated to be
S11
80% (based on the use of S powder of 0.0048 g), under the assumption that the surface ligand to CdS core weight ratio is 1 to 1 and the Cd to S atomic ratio is 1 to 1.2
(1) Zhang, J.; Hao, X.; Rowell, N.; Kreouzis, T.; Han, S.; Fan, H.; Zhang, C.; Hu, C.; Zhang, M.; Yu, K. Individual Pathways in the Formation of Magic-Size Clusters and Conventional Quantum Dots. J. Phys. Chem. Lett. 2018, 9, 36603666.
(2) Zhang, B.; Zhu, T.; Ou, M.; Rowell, N.; Fan, H.; Han, J.; Tan, L.; Dove, M. T.; Ren, Y.; Zuo, X.; Han, S.; Zeng, J.; Yu, K. Thermally-Induced Reversible Structural Isomerization in
Colloidal Semiconductor CdS Magic-Size Clusters. Nat. Commun. 2018, 9, 2499.
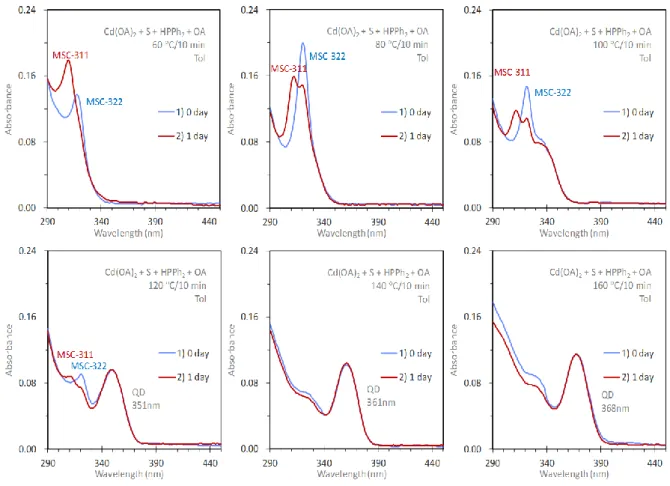
Figure S2-4. For Reaction 1 shown in Figure 2, Cd(OA)2 + S + HPPh2 + MA, we performed its
background experiment, namely Cd(OA)2 + S + HPPh2 + OA. The reaction of Cd(OA)2 + S +
HPPh2 was held at 40 C for 10 min, before the addition of OA. The six samples are indicated;
an aliquot (10 μL) of each sample was dispersed in 6.0 mL of toluene for the absorption measurement.
S12
Figure S3-1. Comparison of the optical absorption of the samples from Batch a shown in Figure 3, before (blue traces) and after (red traces) a one-day room-temperature incubation. The reaction of Cd(OA)2 + S + HPPh2 was held at 40 C for 10 min, before the addition of
2methylbutyric acid. Afterward, the reaction temperature was increased to 160 C with an interval of 20 C. The three samples were extracted at 80, 120, and 160 C. An aliquot (10 μL) of each sample was dispersed in 6.0 mL of toluene for the absorption measurements.
S13
Figure S3-2. Comparison of the optical absorption of the samples from Batch b shown in Figure 3, before (blue traces) and after (red traces) a one-day room-temperature incubation. The reaction of Cd(OA)2 + S + HPPh2 was held at 40 C for 10 min, before the addition of 2,
2dimethylbutyric acid. The six samples are indicated; an aliquot (10 μL) of each sample was dispersed in 6.0 mL of toluene for the absorption measurement. Interestingly, the use of this additive results in the presence of MSC-311, together with QDs.
S14
Figure S4-1. Evolution of optical absorption properties of samples extracted from a reaction of Cd(MA)2 + S + HPPh2, with a temperature increase mode from 40 to 160 C. The stepwise
increase was 20 C with a hold period of 10 min. An aliquot (10 L) of each sample was dispersed in 6.0 mL of toluene for absorption measurements. Again, MSC-311 developed and the nucleation and growth of QDs were suppressed, even at a temperature as high as 140 C.
S15
Figure S4-2a. Evolution of optical absorption properties of samples extracted from a reaction of Cd(MA)2 + S + HPPh2, with a constant temperature mode at 100 C. The growth period is
indicated; an aliquot (10 L) of each sample was dispersed in 6.0 mL of toluene for
absorption measurements before (a) and after (b) a one-day room-temperature incubation. Again, MSC-311 developed and the nucleation and growth of QDs were suppressed, even up to 120 min at 100 C.
S16
Figure S4-2b. Comparison of the absorption spectra of the sample dispersion shown in Figure S4-2a, before (blue traces) and after (red traces) a one-day room-temperature incubation.