Publisher’s version / Version de l'éditeur:
Vous avez des questions? Nous pouvons vous aider. Pour communiquer directement avec un auteur, consultez la
première page de la revue dans laquelle son article a été publié afin de trouver ses coordonnées. Si vous n’arrivez pas à les repérer, communiquez avec nous à PublicationsArchive-ArchivesPublications@nrc-cnrc.gc.ca.
Questions? Contact the NRC Publications Archive team at
PublicationsArchive-ArchivesPublications@nrc-cnrc.gc.ca. If you wish to email the authors directly, please see the first page of the publication for their contact information.
https://publications-cnrc.canada.ca/fra/droits
L’accès à ce site Web et l’utilisation de son contenu sont assujettis aux conditions présentées dans le site LISEZ CES CONDITIONS ATTENTIVEMENT AVANT D’UTILISER CE SITE WEB.
Proceedings of the 25th International Conference on Port and Ocean Engineering under Arctic Conditions (POAC 2019), 2019-06-19
READ THESE TERMS AND CONDITIONS CAREFULLY BEFORE USING THIS WEBSITE. https://nrc-publications.canada.ca/eng/copyright
NRC Publications Archive Record / Notice des Archives des publications du CNRC :
https://nrc-publications.canada.ca/eng/view/object/?id=ebcd5e60-8ddf-4b3d-a096-fe13068a106a https://publications-cnrc.canada.ca/fra/voir/objet/?id=ebcd5e60-8ddf-4b3d-a096-fe13068a106a
NRC Publications Archive
Archives des publications du CNRC
This publication could be one of several versions: author’s original, accepted manuscript or the publisher’s version. / La version de cette publication peut être l’une des suivantes : la version prépublication de l’auteur, la version acceptée du manuscrit ou la version de l’éditeur.
Access and use of this website and the material on it are subject to the Terms and Conditions set forth at Formation and dynamics of an ice bustle at the Nanisivik Wharf
Proceedings of the 25th International Conference on
Port and Ocean Engineering under Arctic Conditions June 9-13, 2019, Delft, The Netherlands
Formation and Dynamics of an Ice Bustle at the Nanisivk Wharf
Jeffrey Brown1, Louis Poirier2, R.M.W. Frederking2 1 National Research Council Canada, St. John’s, Canada 2 National Research Council Canada, Ottawa, Canada
ABSTRACT
In the summer of 2015, the Department of National Defense’s began construction of a new deep water refueling station in Nanisivik In October of 2017, two load panels were installed on the outward face of one of three cylindrical cells making up the wharf. In June of 2018, a field team performed a short measurement program to validate the pressure panels and data logger, extract data, and collect measurements of the ice developed during the previous winter. A region of very thick ice first year sea ice in an ‘active zone’ develops around the wharf every winter. The thickness of the ice bustle and surrounding level ice was measured manually via ice auguring and an elevation survey work at the time of the June 2018 field visit. The ice feature was found to be roughly 4-5m thick on average, and the parent level ice was recorded in the range of 1.6-1.9m. The motions of the active zone were monitored via a 6 degree of freedom position tracking system throughout a full tide cycle to identify early melt-season dynamics of the ice feature. Motions of the ice in the active zone are compared with tide information demonstrating a strong dependence.
The active zone ice feature forms initially from an ice bustle, ad-frozen to the wharf. The life cycle of the ice bustle and a summary of the various dynamics observed both through the measurement program and the loading records are discussed, with particular emphasis on the transition from an ad-frozen ice feature, affixed to the wharf, to a free floating bustle. A region of hard ice appeared to have formed on the steel sheet piles encasing the wharf during the spring. The impact on pressures exerted on the wharf is presented and discussed.
KEY WORDS:
ICE BUSTLE; ACTIVE ZONE; TIDAL JACKING INTRODUCTION
A data collection system installed on the Nanisivik wharf contained two pressure sensors at varying depths encompassing the tidal range in the sounds, thermistors on each panel, an air temperature sensor in the data logger and a pressure sensor. The system was installed in September, 2017 and the site was visited in June, 2018 to extract the first winter’s data, and to validate the system and measure the dimensions and motions of the feature. A more detailed summary of the long term monitoring equipment is presented by Poirier et al. (2019).
The ice feature which forms at Nanisivik wharf is of key interest in the development of safe and reliable coastal infrastructure to support shipping, refueling and recreational activities in northern communities. The combination of high tide range and cold temperatures along with the rarity of similar wharfs in the high arctic creates challenging conditions and requirements for engineers and designers. Understanding the mode of application and the magnitude of forces and pressures supports the development of robust northern infrastructure.
ICE BUSTLES
Ice bustles are ice features which form on thermally conductive materials exposed to both freezing conditions and tidal variation. Ice bustles are ad-frozen to some vertical structures and are exposed to air at minimum tide. These features are characterized by three basic features: a region of hard ice ad-frozen to the vertical structure, the floating ice, and a soft ice shear-zone against which the floating ice moves against the bustle as a function of the tide. Typically ice bustles form and grow as a static feature which is fixed with respect to the tide. Løset and Marchenko (2009) discuss ice bustles which form at a coal quay near Sveagruve on the Svalbard Archipelago, which is expected to be representative of the bustle formation at the Nansivik wharf, despite the difference in structure diameters.
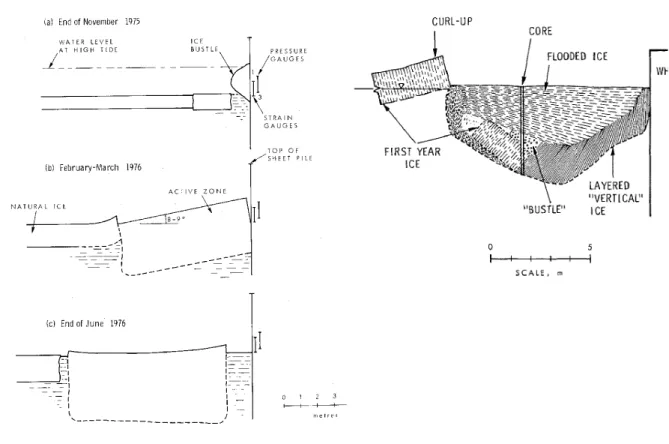
The ice bustle which forms at Nanisivik, and eventually transitions into the active zone ice feature, pictured in Figure 1, has been previously investigated both in terms of life cycle and loads imparted to the structure by Frederking and Sinha (1976), Frederking (1980), Frederking and Nakawo (1984) and Frederking and Sayed (1988). Figure 2 shows the life cycle of the ice feature as reported by Frederking and Sinha (1976) and Frederking and Nakawo (1984). The bustle originates in the same manner as in the Svalbard coal quay in the early season, however at some time in the winter season, the bustle releases from the steel sheet piles and become a free floating ice feature, constrained between the fast ice in the sound and the wharf.
Following separation of the bustle from the wharf, the ice in the active zone continues to grow in thickness due to rotation of the feature, and subsequent flooding as a function of the tide. The rotation is about an axis roughly parallel to the cell perimeter and shore line between cells. The grain structure of the ice bustle at the wharf was previously investigated through extraction of cores and preparation of thin-sections, Figure 2 (Frederking and Nakawo, 1984).
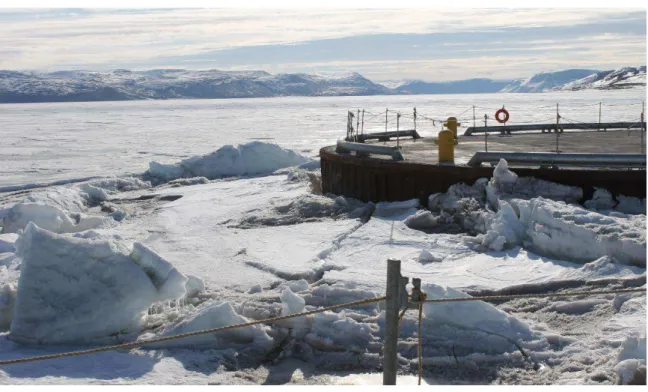
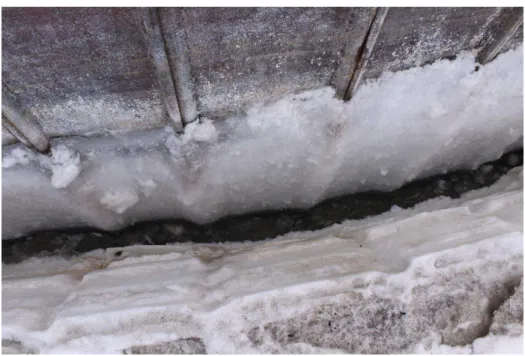
Figure 1: Ice in the active zone near cell 3, Nansivik wharf.
equipment. The rough locations for measurement are shown in Figure 3. The active zone was approximately 9.5m (radially outwards from sheet piles), with thickness of the active zone ice in the range of 4-5m. Previous measurements of the active zone width were completed in February (7.6m) and in July (11.4m) during the winter of 1976 by Frederking and Sinha (1976), and again in 1980 by Frederking (1980). Both earlier measurements are consistent with one another, as well as the measurement of 9.5m in the early part of June, 2017. Thickness of the ice in the active zone was recorded by sparse measurements by Frederking and Nawako (1984) and Frederking (1980) in March, with a peak thickness value of over 6m, which exceeds any measurements recorded in 2018 (peak of 5.5m). It is possible the thickness of the active zone was reduced in 2018 compared to previous years, however there is no comparable thickness measurement in early June for a good comparison.
During thickness measurement work in 2018, several voids at lower layers in the active zone were noted suggesting the presence of ice blocks underneath the feature. It was not possible to determine the level of consolidation of these blocks (or if they were indeed blocks), and only a small number of holes contained voids detected through physical feedback of the auger equipment.
The profile (elevation and draft) of the ‘B’ measurement line (Figure 3) is shown in Figure 4, which compares well with both assessments provided in Figure 2.
Figure 2: Diagram of the active zone life cycle in Nansivik, left, and suspected grain structure from core sample, right
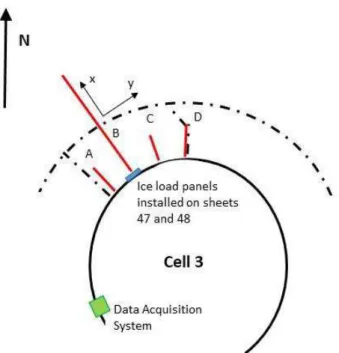
Figure 3: Locations of borehole and survey lines (red) relative to installed load panel (blue), active zone (circular dotted line) and radial cracks in the ice in the active zone.
Figure 4: Ice profile along radial line B of measurements relative to the working surface of the wharf at 10:40am on June 6th, 2018.
BUSTLE SEPERATION FROM WHARF
Each of the pressure panels installed (as shown in Figure 3) contained thermistors to measure the temperature of the top of the panel. There is a 1 m vertical elevation difference between the two thermistors. The temperature datasets prove very useful in understanding what is in contact with the panel at any time throughout the data history. There are three possibilities; air, ice or water. Air is easily identified due to sharp drops in temperature as the tide exposes the thermistor to the air which, after ice forms in the sound during the winter, has a large difference
when compared to the water temperature. Water is also trivial to identify; during the winter the temperature reaches the freezing temperature of sea water.
There were two load panels attached to the wharf, positioned to cover the expected interactions with the active zone ice (see Figure 2) over the entire tide range. The panels were 2m and 3m in length, oriented vertically, and installed to cover a total range of 4m, with one meter of overlap. The as-installed load panels are pictured and described in more detail in Poirier et al (2019).
The tidal range in the region is large, up to 2.5m. At extreme low tides, the upper portion of the lower panel (3m panel) is exposed to air. At these tide levels, most of the 2m panel may be exposed. As the bustle develops, the entire upper panel, and some fraction of the lower panel are anticipated to be encased in ice.
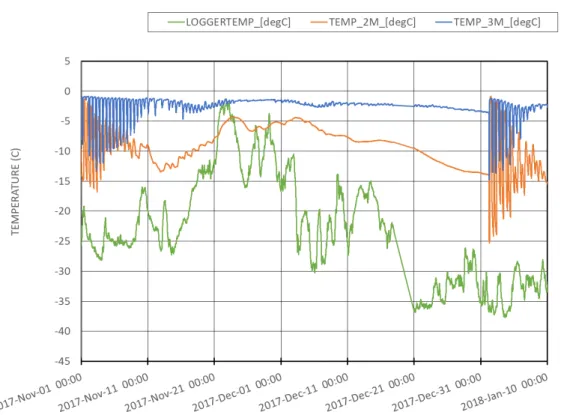
The upper panel is regularly exposed to air at low tide, causing cyclic temperature records where the adhered ice or panel face is exposed to cold air followed by water. As the bustle thickens the change in panel temperature through each tidal cycle reduces due to the insulating effect of the bustle. As the bustle becomes sufficiently thick, the temperature variations reduce to close to zero as a function of tide. Figure 5 shows the temperature time series between November (bustle formation and growth) and the first weeks of January when the bustle separates from the wharf and becomes a free floating ice feature.
We hypothesize that on January 1st at 5:20 the ice bustle became sufficiently large that it
dislodged from the cell under its own weight. Previous observations of the bustle were at discrete times so the end result was known, but not the complete process. From previous years’ observations it was not clear if the bustle fell off abruptly or gradually over several tide cycles. After reviewing this data we can conclude that in this instance, the ice bustle that formed in the early part of winter 2017-18 fell off abruptly. This hypothesis is supported by the load data, in which a jump in most of the pressure records was observed between 5:20 and 5:25.
To our knowledge this behaviour has not been observed before. It appears that as the ice bustle forms over the load panels it is creating a thermal buffer insulating the thermistors from the warmer water. The bustle appears to be fully set in by the last week of November. From that point on the temperature recorded by the 2 m panel continues to decrease almost continually. This anomalous behaviour comes to a sudden end on January 1st at 5:20 as shown in Figure 5.
At this time the temperature of each panel drops dramatically and simultaneously by 8 – 9 ̊ C in 15 minutes. The temperature continues to drop but at a much more normal rate until the wetting cycle, which was not observed between November and this point in time, resumes.
Figure 5: Temperature time series for both panels and logger (air temperature) during the formation and eventual release of the ice bustle.
Figure 6: System thermistor and tide data leading up to the suspected bustle separation event on January 1st, 2018.
SECONDARY BUSTLE FORMATION
Once the bustle separates from the wharf, it forms the basis of the mass of ice in the active zone, which grows according to the processes described by Frederking and Sayed (1986) and Frederking and Nakawo (1984). However both accounts of the ice feature do not identify a
secondary bustle which was observed in June, shown in Figure 7, and formed sometime after the primary bustle is released from the sheet piles encasing the wharf. Inspection of the temperature time-series from the 2m and 3m panels immediately following the bustle separation event (Jan 1st-10th in Figure 5) is similar to the initial bustle formation in early
November suggesting that the feature may have formed immediately following the bustle separation.
It is possible that such small bustles occur only when pressures on the wharf are low, early in the winter, and once the active zone retreats from contact with the wharf in spring. The thermal mass of the aggregate fill within the wharf cell is expected to keep temperatures of the steel sheet piles below freezing even in the presence of above zero air temperatures.
Figure 7: Secondary ice bustle and shear zone at interface with the active zone. ACTIVE ZONE MOTIONS
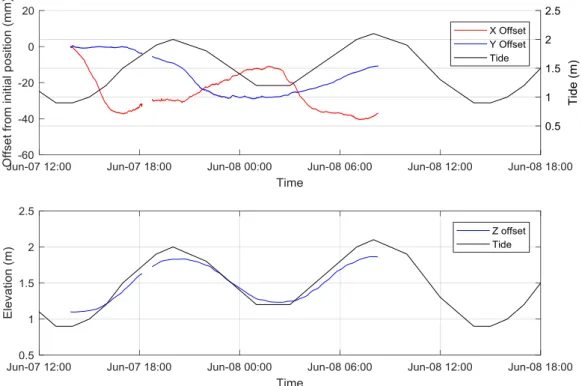
During the fieldwork, the active zone was instrumented using an optical position tracking system (Qualysis®) to record the motions of the active zone ice throughout a tidal cycle. The test was completed overnight on June 7th-8th and captures a little more than one full tidal period,
with a tidal range of about 1.1m. Figure 8 shows two plots of the X/Y motions and vertical motions of the active zone. In the coordinate frame the X axis is roughly perpendicular to the shoreline, and Y is parallel. Positive Y is movement away from the mouth of the sound (easterly), and positive X is movement towards the wharf. In general, as the tide falls, water drains from the sound, pulling the active zone to the west (Y decreasing), however this action may not be simple, as is likely influenced by local currents and circulation in the sound. During low tide the hinge angles along the shoreline are largest, allowing the active zone to move away from the wharf. Movements in both directions are small, in the 10’s of mm. Vertical motions of the active zone closely follow the tide, as expected for this time of the year where the zone is not completely confined by frozen ice. It should also be noted that there is approximately 1cm of drift in planar motions away from the wharf throughout a single tidal period. This corresponds to about 2cm of drift per day, consistent with continued increasing width of the active zone into July, discussed by Frederking and Sinha (1976), and Frederking (1980). Small angles of rotation were observed, about 2.5-3 degrees, about the Y axis. These angles are small in comparison to expected mid-winter inclination of the active zone, which is reported as 8-9 degrees in February by Frederking and Sayed (1986). It is assumed that the motions as
a function of tide are similar in June and February, with reduced tidal and current driven planar motions in February, and reduced inclination angles in June. Angles decrease with decreasing tide - the surface of the active zone ice feature is near level at low tide). From June motion information, the ice feature begins moving back towards the wharf when the tide is roughly one quarter through its period, starting at low tide. Motions maybe significantly different during mid-winter months however, as no pressures are present on the pressure panels during motion measurements shown in Figure 8.
Figure 8: Planar motions of the active zone on June 7-8th, 2019
POTENTIAL LOADING MECHANISMS
The increasing tide also increases the space between the active zone and the wharf or the secondary bustle. The motions towards and away from the wharf are in phase with the tide, and confirmed by visual observations during field work.
Frederking and Sayed, (1988) noted a high force was due to rapid temperature increases, leading to thermal expansion of the ice in the sound, which applied pressure to the wharf. Poirier (2019) demonstrates a correlation between high pressure and decreasing temperatures, suggesting that much of the forcing on the Nanisivik wharf is not due to thermal expansion of the level ice in the sound.
The mostly likely mode of force application is through tidal jacking, as discussed by Stander et al. (1988), Stander (2006) and Morse et al (2011) where water permeates into voids created through tidal motions of hinges at the coast line or during repeated raising and lowering of hydro reservoir levels, and freezes. As the cracks re-converge with rising water level, confinement is present, leading to motions and associated stress of the surrounding ice. Motions have been measured on the order of 10’s of mm per day (Stander, 2006) consistent with measurements presented by Frederking and Nawako (1984) and the growth of the active zone width from field observations in 2018 (roughly 4-5cm per day on average assuming the active zone is small when the bustle is released from the wharf). The presence of a vertical structure, and significant level ice creates confinement and subsequent stress. The action of the active zone ice is not unique to Nanisivik, however in terms of the thickness, which is several orders
of magnitude higher compared to thicknesses observed in hydroelectric dams (Morse et. al. 2011), there is increased potential to generate high stresses, typically limited by failure of the ice. Poirier et al (2019) shows peak forces in the range of 1.2MPa vs peak forces in hydroelectric dams recorded by Morse et al. (2011) of around 350kPa.
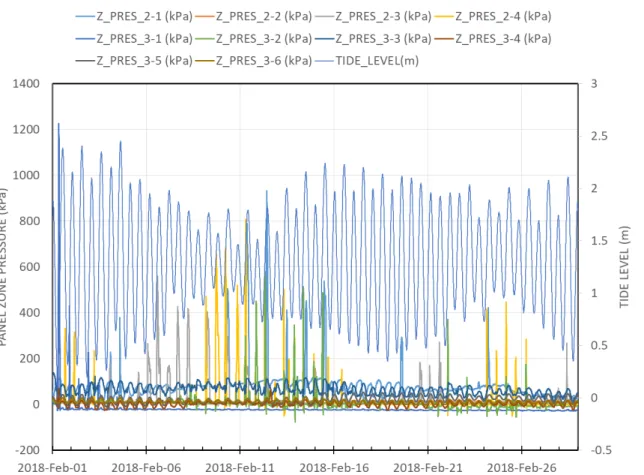
From observational inspection, the majority of the high loading events occur when the tide range is small see (Figure 9), and during periods of increasing tides as discussed by Poirier et al. (2019). This follows the period in which the distance between the active zone and wharf is largest from the motion data collected in the field work presented here, and when air temperature is cold support the assertion that the most common mechanism of force application on the wharf is tidal jacking. This action maybe exaggerated by the thermal conductivity of the steel sheet piles, allowing ad-freeze of permeated water deep into the ice surface (or on the sheet piles directly, instead of in hinge cracks). The thermal expansion of the ice itself as it refreezes may also contribute to the development of pressures.
Figure 9: Complete pressure record from February, showing correlation to high pressures and relatively low tidal range
CONCLUSIONS
The physical dimensions and dynamics of an active zone ice feature were documented in 2018 at the Nanisivik Wharf in Strathcona sound, Nunavut. The active ice feature is composed initially from an ice bustle which formed on the steel sheet piles of the wharf between early November and early January. Once the bustle reached sufficient mass concurrent with low tide, the bustle suddenly separated from the wharf and was included in the active zone ice mass. The process of bustle release from the wharf took less than 5 minutes, and was likely instantaneous. Following separation of the primary ice bustle, a secondary bustle formed, and was observed to be ad-frozen to the wharf in June. This feature has not been observed in previous field programs in March and July, suggesting that it its existence is either dependent on specific
conditions (annual) or forms only in the early spring. The active zone ice feature grows in thickness through tidal flooding. Thickness and width of the active zone are similar to those reported in earlier observations.
The motions of the feature are driven by tides, as well as confinement between landfast ice formed in Stathcona Sound and the vertical sheet piles of the wharf. The dynamics of this ice feature are hypothesized to be due to general loads through the mechanism of tidal jacking, to correlation of recorded pressures with specific tidal patterns and to low temperatures.
ACKNOWLEDGEMENTS
The authors would like to acknowledge the support from the Department of National Defense, Defense Construction Canada, Advisian, Almiq Contracting Ltd., Pagui Inc., The Nunavut Research Institute, and NRC colleagues Dave Hnatiw, Yvan Brunet.
REFERENCES
Frederking, R. (1980) Ice Action on Nanisivik Wharf, Strathcona Sound, N.W.T., winter 1978 - 1979, Can. J. Civ. Eng, Vol. 7, pp. 558 - 563.
Frederking, R., and Nakawo, M. (1984) Ice Action on Nanisivik Wharf, winter 1979 - 1980,
Can. J. Civ. Eng, Vol. 11, pp. 996 - 1003.
Frederking, R., and Sayed, M. (1988) Ice Forces on the Nanisivik Wharf, IAHR Symposium
1988, Sapporo, Japan, August 23 – 27, 1988.
Frederking, R., and Sinha, N.K. (1978) Ice Action on Wharf at Strathcona Sound, Proceedings
of the 4th International Conference on Port and Ocean Engineering under Arctic Conditions, St. John’s, NF, Canada, September 26-30, 1977.
Løset, S., Marchenko, A. (2009). Field studies and numerical simulations of ice bustles on vertical piles. Cold Regions Science and Technology. 58. pp. 15-28.
Poirier, L., Brown, J., Frederking, R. (2019) Environmental Monitoring and Ice Forces on the Nanisivik Wharf. Proceedings of the 25th International Conference on Port and Ocean Engineering under Arctic Conditions, Delft, The Netherlands, June 9-13, 2019.
Morse, B., Stander, E., Côte, A., Martin, R., Desmet V. (2011) Stress and Strain Dynamics in a Hydro-Electric Reservoir Ice Sheet. 16th Workshop on River ice, CGU HS Committee on River Ice Processes and the Environment. Winnipeg, Manitoba, September 18-22, 2011.
Stander, E. (2006) Ice Stresses in Reservoirs: Effect of Water Level Fluctuations. Journal of
Cold Regions Engineering, Vol. 20, No 2, 52-67.
Stander, E., Frederking, R., Nadreau, JP. (1988) The Effects of Tidal Jacking on Ice
Displacement and Strain in the Nearshore Environment. IAHR Symposium, Sapporo, Japan,