HAL Id: hal-02089305
https://hal.archives-ouvertes.fr/hal-02089305
Submitted on 3 Apr 2019HAL is a multi-disciplinary open access archive for the deposit and dissemination of sci-entific research documents, whether they are pub-lished or not. The documents may come from teaching and research institutions in France or abroad, or from public or private research centers.
L’archive ouverte pluridisciplinaire HAL, est destinée au dépôt et à la diffusion de documents scientifiques de niveau recherche, publiés ou non, émanant des établissements d’enseignement et de recherche français ou étrangers, des laboratoires publics ou privés.
A Volunteer Design Methodology of Data Warehouses
Amir Sakka, Sandro Bimonte, Lucile Sautot, Guy Camilleri, Pascale Zaraté,
Aurelien Besnard
To cite this version:
Amir Sakka, Sandro Bimonte, Lucile Sautot, Guy Camilleri, Pascale Zaraté, et al.. A Volunteer Design Methodology of Data Warehouses. 37th International Conference on Conceptual Modeling (ER 2018), Oct 2018, Xi’an, China. pp.286-300. �hal-02089305�
Any correspondence concerning this service should be sent
to the repository administrator: [email protected] This is an author’s version published in:
http://oatao.univ-toulouse.fr/22698
Official URL
DOI : https://doi.org/10.1007/978-3-030-00847-5_21 Open Archive Toulouse Archive Ouverte
OATAO is an open access repository that collects the work of Toulouse researchers and makes it freely available over the web where possible
To cite this version: Sakka, Amir and Bimonte, Sandro and Sautot, Lucile and Camilleri, Guy and Zaraté, Pascale and Besnard, Aurelien A Volunteer Design Methodology of Data Warehouses. (2018) In: 37th International Conference on Conceptual Modeling (ER 2018), 22 October 2018 - 25 October 2018 (Xi'an, China).
A Volunteer Design Methodology
of Data Warehouses
Amir Sakka1,2(✉), Sandro Bimonte1, Lucile Sautot4, Guy Camilleri2, Pascale Zaraté2, and Aurelien Besnard3
1
IRSTEA, UR TSCF, 9 Av. B. Pascal, 63178 Aubiere, France {amir.sakka,sandro.bimonte}@irstea.fr
2 IRIT, Toulouse University, Toulouse, France {guy.camilleri,pascale.zarate}@irit.fr 3
LPO Aquitaine, 433 Chemin de Leysotte, 33140 Villenave-d’Ornon, France [email protected]
4
AgroParistech, UMR TETIS, Maison de la télédétection, Montpellier, France [email protected]
Abstract. In the context of Volunteered Geographic Information (VGI), volunteers are not involved in the decisional processes. Moreover, VGI systems do not offer advanced historical analysis tools. Therefore, in this work, we propose to use Data Warehouse (DW) and OLAP systems to analyze VGI data, and we define a new DW design methodology that allows involving volunteers in the definition of analysis needs over VGI data. We validate it using a real biodiversity case study.
Keywords: OLAP · Data Warehouse · Volunteered Geographic Information GDSS
1
Introduction
Crowd science (i.e., citizen science or volunteer science) has been defined as “online,
distributed problem-solving and production model” [4]. Well-known examples of crowdsourcing systems are Wikipedia1, forums, etc. In crowdsourcing systems the users of the community add, delete and modify contents (ex: forum answers, documents, etc.) until achieving an agreement. In the context of geographical data, crowdsourcing has been defined as VGI (Volunteered Geographic Information). VGI is “the mobilization
of tools to create, assemble and disseminate geographic data provided by volunteers” [18]. VGI allows managing amounts of geo-localized data (e.g. Openstreetmap2), and it is widely used in different application domains i.e. urban, biodiversity, risks, etc. Usually, volunteers are data producers and passive consumers of VGI data analyses provided by organisms/enterprises. This “bottom-up data supply and top-down data
analysis” paradigm represents an important barrier for the development of volunteers’
1
https://www.wikipedia.org.
2
https://www.openstreetmap.org.
observatories, since data producers feel excluded from the decision-making process [13]. Moreover, as highlighted in [2] VGI does not present analysis functionalities to scope huge volumes of geospatial data. Therefore, the analysis of VGI using Geo-Busi‐ ness Intelligence (GeoBI) has been proved as an effective solution [2]. In particular, VGI are designed for operational tasks and complex analysis on small spatial data, whereas Spatial On-Line Analytical Processing (SOLAP) systems are more relevant for analysis based on exploration of massive spatial datasets stored in Spatial Data Warehouse (SDW) [12, 17]. Since DWs are conceived according to data sources and users require‐ ments, the more the DW model reflects stakeholders’ needs, the more stakeholders will make use of their data [12, 15], implying social (e.g. welfare improvement) and econom‐ ical (e.g. sustainable agriculture) benefits. Providing GeoBI applications fitting the VGI community’s analysis needs, will represent important social and economic advances, since: (i) new required and effective analysis possibilities on numerous different crowd‐ sourced data will be possible (urban, agricultural, risks, environmental data, etc.), and (ii) volunteers will be more and more motivated to collect data. Therefore, this work
aims at moving volunteers from data suppliers to volunteered data analysts by means of a new kind of OLAP systems, as described in the next.
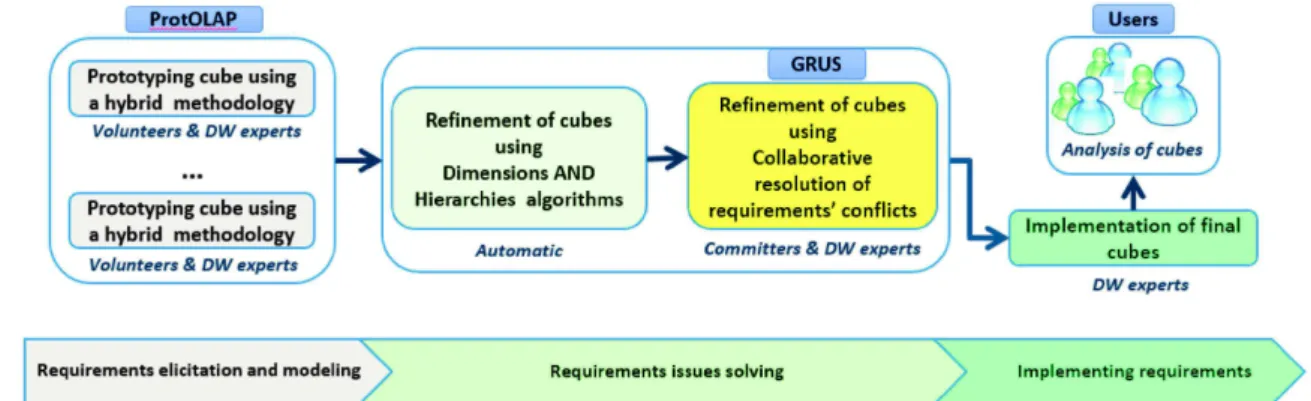
Our Vision: In the same way as methodologies of data validation adopted by existing crowdsourcing systems (OpenStreetMap, Wikipedia, etc.), in Fig. 1 we present our vision of a new OLAP system (OLAP2.0). The main idea is to allow volunteers to express separately their requirements for OLAP analysis, in a first step. These require‐ ments will then be translated to multidimensional (i.e. DW) models. Next, these OLAP models are submitted to a set of particular volunteers called committers, who are fully involved in the project and highly experimented in the crowdsourced data. [12] empha‐ sizes on the necessity of data stewardship (conducted by committers in our approach) to solve issues related to the lack of users’ experience in queries specification and data ownership/sensitivity problems encountered by organizations during DWs implemen‐ tation process. Hence thus, committers decide whether to implement crowdsourced requirements (i.e. multidimensional models) of volunteers or not, according to their expertise to judge the relevance of requirements. After that, the DW expert designers are in charge of implementing models agreed by committers (Fig. 1). Finally, the new OLAP models are implemented and made available to all users that can visualize, explore and analyze data (Fig. 1).
Fig. 1. OLAP2.0 methodology
Investigated Issues: In this work we focus on issues related to the design of multi‐ dimensional models from crowdsourced requirements. Let us note the fact that our use of VGI data does not cover the data quality validation/investigation, we apply our methodology on already cleansed VGI databases.
Several design methodologies for DW have been proposed [7, 15], however, when decision-makers are volunteers and they are different from those who decide the rele‐ vance of the requirements, they:
(i) Only represent few potential users of the OLAP system, so their specific analysis needs may be perhaps not those useful for most final users;
(ii) Can have different backgrounds (e.g. scientists, citizen, etc.), which can lead to multiple contradictious interpretations of the same requirement. When stake‐ holders have divergent goals, it becomes problematic to maintain an agreement between them from a requirement-engineering point of view [9, 21];
(iii) Are not skilled in DW, and sometimes, also in Information Technologies (IT), thus it remains possible that they do not correctly or clearly formalize most of their needs;
(iv) Can be numerous, making conflicts management an extremely complicated task; (v) Are not “employed” by the project, their involvement time in the project is limited, and so they cannot exhaustively, accurately and correctly define their require‐ ments;
(vi) They are geographically distributed over different locations; Therefore, requirements elicited by volunteers can present [21]:
– Similarities i.e. the same multidimensional elements are separately defined, – Differences i.e. Different definitions of the same multidimensional elements, and – Conflicts i.e. irrelevant or erroneous multidimensional elements definition.
Hence, dealing with these particular stakeholders using the existing DW methodol‐ ogies is not possible since the existing DW methodologies:
(a) Require advanced knowledge of OLAP main concepts (because of iii);
(b) Assume that users are effectively involved in the project, which makes all their needed requirements well and completely defined (because of i, ii and v);
(c) They do not handle the cases where large number of multidimensional models can be generated (because of ii, iv);
(d) They deal with domain experts only, so they have no need to manage Inconsistent definitions (because of ii, iv, v).
To address these issues, based on main principles of requirements engineering [21] and in particular using the Groupware tools approach [21], we propose an innovative collaborative DW design methodology using a Group Decision Support System (GDSS), to help committers to decide whether to implement or not the crowdsourced require‐ ments of volunteers. Indeed, GDSSs are designed to support a group engaged in a collective and collaborative decision process with geographically distributed users, they are used in several domains e.g. workflows, user interfaces and databases design [19], but not for DW. Moreover, to allow volunteers to easily crowdsource their requirements (Fig. 1), we use the ProtOLAP methodology [3], a methodology for DW rapid proto‐ typing when computer science inexpert users supply data.
We validate our proposal in the context of the French ANR project VGI4Bio, but several different VGI-based applications could be addressed in the same way.
The paper is organized as following: in Sect. 2 we describe our case of study; Sect. 3 illustrates the proposed methodology; Sect. 4 presents the implementation and validation of the methodology, and Sect. 5 overviews related works.
2
Case Study
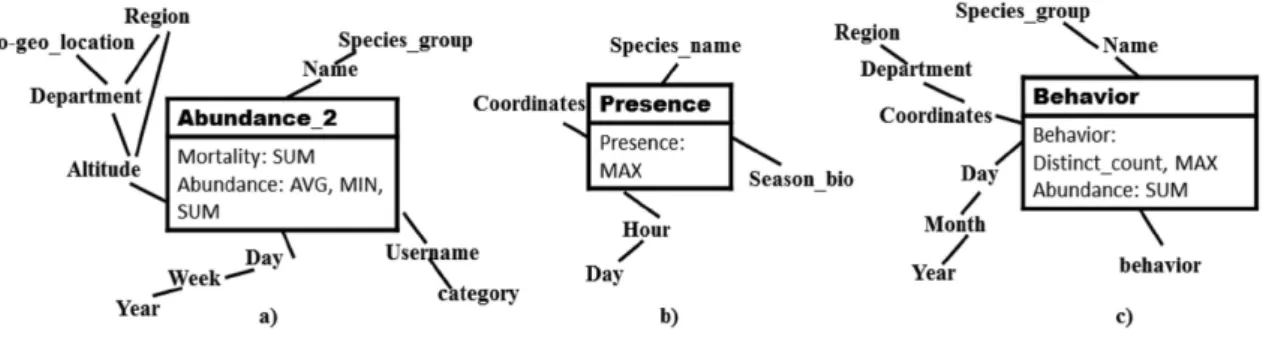
In the context of project VGI4Bio3, we mobilize two VGI databases (Visionature and Observatoire Agricole de la Biodiversité4 - OAB) to build SOLAP applications to analyze farmland biodiversity indicators. Visionature and OAB have 7682 and 1500 volunteers that produce data, respectively. Among possible users interested in analyzing these data, we have identified a huge number of users belonging to diverse categories such as: volunteers that are interested in analyzing data to improve their data production quality, their related daily practices, etc.; public and private organisms (DREAL, Chambre d’Agriculture, etc.). At this phase of the project, we have identified some volunteers, and a set of committers. Figure 2 shows three multidimensional models defined by three different volunteers to analyze the abundance of animals, these models answers queries such as: “What is the total abundance of birds per altitude, species and week?” (Fig. 2a). On one hand, as for classical DW design methodologies, these require‐ ments can present the following issues: Similarities such as “abundance + SUM”, “day”, etc., and Differences such as “Season_bio”, “behavior”, etc. On the other hand, since for different goals, different volunteers have defined these requirements, the multidi‐ mensional model can present some Conflicts. For example, for the “abundance” measure of some species, the data acquisition protocol requires that the observation last for a particular duration or distance (ex: 10 m for butterflies). Therefore, this measure makes no biological analysis sense, unless it is accompanied by the observation duration or
3
www.vgi4bio.fr.
4
distance. These conflicts are not issued by the source data, but they are due to disparities of knowledge and expertise in the application domain. Thus, they cannot be solved using any automatic tool, but only by specialists. Moreover, due to the huge number of volun‐ teers in any VGI project, providing an implementation for each proposed model is unre‐ alistic because of its high human, temporal and economic costs. Therefore, we propose to design one or only few models that represent an agreement for all volunteers solving the Similarities, differences and Conflicts issues, instead of the classical DW imple‐ mentation. In the rest of the paper, we use a simple graphical representation of multi‐ dimensional conceptual models for reasons of brevity.
Fig. 2. SOLAP models of volunteers
3
OLAP2.0
In this section, we define the main steps of our volunteer design methodology for DW design (Fig. 1). In the rest of the paper we use the terms ‘requirement’ and ‘model’ for defining multidimensional requirement and multidimensional model, respectively. The methodology is composed of the following steps:
1. Requirements elicitation, modelling and validation on data. It aims at collecting requirements of each volunteer, translates them into models and validates them on data source (Sect. 3.1).
The following two steps aim at solving issues of requirements as previously described. Since requirements are translated into validated models, these following two steps provide a refinement of the models from the previous step:
2. Solving Differences and Similarities of requirements. This step merges the different volunteers’ models in order to solve Similarities and Differences issues, and gener‐ ates refined models. (Sect. 3.2), it is based on existing works that integrates data marts.
3. Collaborative resolution of requirements’ conflicts. This step allows committers to solve conflicts (Sect. 3.3).
4. The models that meet the committers’ agreement are then implemented.
It is important to underline that the collaborative design step has not been added from the beginning of the design process for two important reasons:
(a) The lack of collaborative tools and methodologies for DW design,
(b) Since the impossibility of achieving an agreement among committers a priori, moving the collaborative task after the models’ definition will grant us at least a set of possible models that can be implemented.
Let us provide some notations used in the next: (i) An Indicator is the measure + aggregation function; (ii) A cube is a model (dimensions and fact) (iii) A dimension d is a directed acyclic graph (iv) A hierarchy is a path from root to leaf of d, e.g. the Location dimension in Fig. 2a have 3 hierarchies: {Altitude –> region, Altitude –>
Department –> Region and Altitude –> Department –> Bio-geo_Location}.
3.1 Requirements Elicitation, Modeling and Validation on Data
This step is composed of two phases: the first is the requirements elicitation, and the second is their translation into valid multidimensional models.
We use the ProtOLAP methodology and tool [3] for the elicitation of volunteers’ requirements. According to the elicitation of requirements practices [2], ProtOLAP provides interviews, workshops, and prototyping. In particular with ProtOLAP, volun‐ teers explain their analysis requirements during meetings in natural language and using word/excel documents [14]. Then, the DW experts transform them into a UML model, defined using the UML profile ICSOLAP implemented in the commercial CASE tool MagicDraw. Finally, the ProtOLAP tool generates a prototype cube from the expressed requirements. This prototyped cube is used in an iterative process to support volunteers eliciting their requirements e.g. models in Fig. 2.
After this elicitation phase, these cubes are validated by DW experts on data sources using an existing hybrid DW design methodology [7, 15], and the DW experts associate to each model a goal specification given by its definer to be used later at the third step. For example, for the model of Fig. 2b, the owner volunteer announce, “This model is for analyzing spatial and temporal coverages of VGI data”.
Let us note that, by using ProtOLAP, multidimensional requirements are simply represented with pivot tables of prototyped cubes, which, as shown in [11], can be auto‐ matically translated into well-formed models. This allows us to avoid the usage of multi‐ dimensional requirements formalisms, which can be very complicated for our decision-makers (i.e. volunteers). Moreover, the volunteers know very well the dataset since they have already used and/or alimented it. Therefore, they can easily define some indicators over the source dataset, which eases the validation of the requirements on the data sources (such as in an on-demand data supply approach [3]). Finally, to avoid vocabulary alignment issues during the elicitation phase with ProtOLAP, DW experts check and oblige volunteers to use the same vocabulary when possible using a MagicDraw repo‐ sitory to keep a track of previously used terms for every specified requirement (such as [1]). For example, for the temporal dimension, the “Time” dimension name is imposed. To conclude, this step takes as input the requirements of each volunteer, and outputs
3.2 Solving Differences and Similarities of Requirements
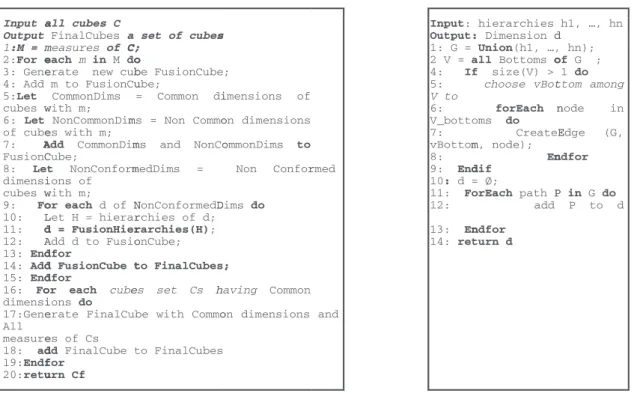
This step aims to solve Differences and Similarities among similar requirements that were differently defined in step 3.1. This step is based on previous existing methods of data marts design and integration [11, 15, 23]. In this paper, we provide our own methodology only for comprehensibility purposes. To this goal, it refines these models by merging them, which is achieved using the Dimensions algorithm of Fig. 3. For each common measure, the algorithm fuses all dimensions of different models in one model. In this way, when a volunteer expresses the same analysis subject i.e. the measure of other volunteers, but using different dimensions/hierarchies, the Dimensions algorithm returns the same analysis subject but enriched with dimensions of the other volunteers. For example “F1” model in Fig. 5 is the fusion of the two cubes “abundance_2” and “behaviour” based on their common measure “Abundance” with their common dimen‐ sion “Species”, their common dimensions “Behaviour” and “Users”, and their non-conformed dimensions “Time” and “Location”.
Fig. 3. Dimensions algorithm Fig. 4. Hierarchies algorithm Likewise, the Hierarchies algorithm Fig. 4 aims to return all possible hierarchies defined for a commonly, but differently defined, dimension.
The Hierarchies’ algorithm merges all hierarchies in one graph, and then finds all possible paths from the leaf to the root nodes. When the graph has multiple bottom leaves, the DW expert must choose one, e.g. in “F1” model of Fig. 5b, the level “coor‐ dinates” was considered as the lowest level (lower than the level “Altitude”) of the enriched hierarchy of the dimension “Location”.
Fig. 5. Solving differences and similarities of requirements step example
To conclude, this step allows proposing useful dimensions and hierarchies that volunteers have unintentionally forgotten or consciously ignored, i.e. Differences requirement issue, and use, when possible, the same multidimensional elements, i.e. Similarities requirement issue.
3.3 Collaborative Resolution of Requirements Conflicts
The aim of this step is to solve the conflicts engendered at the previous step by means of another refinement of the previously obtained models (Sect. 3.2): Are the multidi‐
mensional elements added by the Solving Differences and Similarities of requirements
step needed by all volunteers? The refinement is provided by the Collaborative design
algorithm (Fig. 6), where the committers express their recommendations for each multi‐ dimensional element according to some criteria concerning their utility and usability. The algorithm finds a consensus among committers, and returns the agreed models. In the following, we firstly describe the algorithm, and then we explain the objective of each used method.
input: Cube c output Cube c
1: Let I the set of indicators of c; 2: Let D the set of dimensions of c; 3: SetConfidenceLevel(c);
4: I’=VoteIndicators(I);
5: if I’ is empty then return;
6: ForEach indicator i of I not in I’
do 7: delete i from c; 8: endFor 9: endif 10: D’=RankDimensions(D); //rank dimensions 11 CleanIndicators(D’,D) ; 12: D’’=VoteHierarchies(D’); 13: CleanIndicators(D’’,D’) ; 14: ForEach dimension d of D’’ do 15: flag=VoteCubeDimensionUsability(d);
16: if flag is false then
CleanIndicators(d,D’’) 17: endFor
18: VoteImplementationCube(c);Return c;
Procedure CleanIndicators
Input set of Dimension D’ subset of D
1: ForEach dimension d of D not in D’ do
2: delete d from c;
3: delete all Holistic indicators from c;
4: endFor
Fig. 6. Collaborative resolution of requirements conflicts algorithm
Collaborative resolution of requirements conflicts algorithm: using the method ‘SetConfidenceLevel’ of Table 1 (Fig. 6-Line 3), committers define a confidence level for the cube according to their skills in the cube’s application domain. This confidence level prioritizes the choices of committers with most appropriate skills regarding the under evaluation cube e.g. a committer specialized in ecology, sets his/her confidence level for the cube ‘Behaviour’ in Fig. 7a to “High”.
Table 1. Resolution of requirements conflicts methods For each committer Input Output Method Criteria SetConfidenceLevel Cube Conf- level
auto-evaluation
Application skilled VoteIndicators Indicators Indicators Vote (Borda) Indicator is useful RankDimensions Dimensions Dims rank Vote (Borda) Dimension is useful VoteHierarchies Dimension
hierarchies
Dims rank Multicriteria (Weighted avg) - Hierarchies richness - Fact-dim is accurate VoteCubeDimensionUsa bility
Dimension Dimension Vote (Majority)
Cube with dimension is usable
VoteImplementationCube Cube Finale cube Vote (Majority)
Cube must be implemented
Fig. 7. Collaborative resolution of requirements conflicts example
Then, the committers evaluate the analysis relevance of each indicator in order to remove useless indicators from the final cube by the method ‘VoteIndicators’ of Table 1 (Fig. 6-Line 4). As an example, all committers estimate that “behaviour + Min” is not a relevant indicator, therefore, it is removed (Fig. 7a).
Afterwards, if at least one indicator is kept after the previous vote procedure, the committers evaluate the analysis relevance of each dimension in order to remove the useless dimensions, using the method ‘RankDimensions’ of the Table 1 (Fig. 6-Line 10), e.g. committer1 considers relevant all but “Users” dimension, then it’s removed (Fig. 7b). Note that holistic indicators [12] are removed when a dimension is not kept after the vote procedure (Fig. 6-Line 11) since this type of indicators becomes erroneous when it haven’t access to the finest level of granularity after a dimension’s removal. For other indicators (i.e. distributive and algebraic) the dimension elimination does not pose problems since measures can be aggregated on its ‘All’ member, and then reused for other aggregations (such as materialized views [12]).
Once all useless dimensions are gotten rid of, the committers must evaluate each retained dimension according to its hierarchies’ richness and the accuracy of its lowest level of granularity, that is done by the method ‘VoteHierarchies’ of Table 1 (Fig. 6 -Line 12). In our case study for example, the committers agreed that all the dimensions’ hierarchies are well defined. Let us note that, this method eliminates the dimension if all its hierarchies are eliminated. Indeed, with the ‘VoteCubeDimensionUsability’ method of Table 1 (Fig. 6-Line 15) the committers must evaluate the usability of the cube with every dimensions [20], since it is well known that the number of used dimen‐ sions affects the usability of the cube, and so the decision-making process. For that goal, the algorithm, starting from the most important dimension, adds dimensions consecu‐ tively to the cube showing each time the resulting cube to committers. In this way, committers, exploring the cube with the new added dimension, decide of its usability, and thus to keep it or not.
Finally, the committers vote the implementation of the resulting cube made with ‘VoteImplementationCube’ method of Table 1 (Fig. 6-Line 18).
Methods description: The Table 1 illustrates the methods used by the Collaborative
resolution of requirements conflicts algorithm.
‘VoteIndicators’ and ‘RankDimensions’, use a vote procedure with the Borda calcu‐ lation method [16], since they have only one criterion. The ‘VoteHierarchies’ uses a weighted sum aggregation operator as well as a weighted sum, since it a multicriteria
approach. Finally, the ‘VoteCubeDimensionUsability’ and ‘VoteImplementationCube’ use a majority vote since a boolean result is needed.
At this point, the obtained cube is composed of only usable, useful and well-formed
dimensions, and with useful indicators.
In the following, we describe the different criteria used by the methods. “Indicator is useful” and “Dimension is useful” [5] are used to evaluate the necessity of indicators and dimensions for the decision-making goal. For the ‘VoteHirarchies’, since the right OLAP analysis does not only depend on the presence of a dimension, but also on its levels, we have defined the criteria: (i) “Fact-dimension is accurate”, which represents whether or not the factual data are stored at the convenient dimension’s granularity, and (ii) “The hierarchies of the dimension are rich enough”, which means that sufficient aggregation possibilities exists over the dimension. “Cube with dimension is usable” [5, 20] is used to check the degree of usability of the cube using each dimension, and finally “Cube must be implemented” corresponds to the evaluation of the users’ satisfaction about the obtained cube [5]. Let us note that we have used a scoring scale of [1–5] for all our GDSS evaluations.
4
Implementation and Validation
4.1 Implementation
The methodology has been implemented in a Relational OLAP architecture composed of Postgres as DBMS, Mondrian as OLAP server, and JRubik as OLAP client.
We use the ProtOLAP system for the first step of our methodology. ProtOLAP takes as input an UML model defined using ICSOLAP UML profile for SOLAP [3], which is implemented in the CASE tool MagicDraw. It automatically creates the SQL scripts for Postgres (tables creation and data insertion) and XML configuration Mondrian files. The collaborative design has been carried out by the GRUS system [19]. With a voting-oriented approach as well as a Multi-Criteria approach, we defined a specific group decision-making process. During the voting-oriented approach, users participated to GRUS system and sorted the alternative elements in order of their preferences. For the Multi-Criteria approach, participants gave to every element a mark based on each criteria. The system then, returned a report of results. Finally, it is important to underline that GRUS is a web-based system that allows asynchronous processes. Therefore, it is well adapted to our committers that are geographically located in different places, and work at different time.
4.2 Experiments and Validation
For the validation of our proposal, we engaged four volunteers with different skills, and we have identified four committers.
For the validation of the first step (Sect. 3.1) using ProtOLAP, we have counted the number of meetings between volunteers and DW designers and their duration. The time of implementing a DW prototype with ProtOLAP is negligible, since it is only a few minutes task. In average, there are three meetings by volunteer and each is one
hour long. Therefore, we can conclude that only when the number of volunteers is small, the usage of the ProtOLAP methodology is possible. When the number of volunteers becomes significant, a new methodology must be provided to allow volunteers defining themselves their OLAP models without the intervention of DW designers.
To validate the proposed collaborative resolution of requirements conflicts meth‐ odology (Sect. 3.3), we considered one cube defined with one ornithology decision-maker, which corresponds exactly to the experts’ needs. Then, we have modified it by adding some dimensions and indicators that the ornithologist considers useless. In this way, we obtained a degraded cube. In particular, we have added a dimension “Users”, and the indicator “Max behaviour”. Finally, we submitted this cube to committers, and we tested whether or not using our design methodology, committers will be able to obtain the original ‘good’ cube. The experiments validated our methodology, since ‘VoteIn‐ dicators’ effectively classified “Max behaviour” as the last important indicator and the ‘RankDimensions’ function eliminated the “Users” dimension (with only 7.7% of votes). In GRUS, the Borda calculation method does not eliminate alternatives, and then we have chosen for each vote method a threshold for eliminating the multidimensional elements. For example, for ‘RankDimensions’ 10% or under would be eliminated. All other methods kept the other multidimensional elements. In this way, the exact original cube was returned by the end of the collaborative step.
Finally, since committers are not employed by the project and then they cannot spend too much time, it is important to note that the complete collaborative process has taken less than one hour, and it has been done during one meeting.
5
Related Work
(S) DWs design has been investigated in several works [7, 15]. Three types of approaches have been defined: (i) methods based on user specification (user-driven approach), which define the DW schema using users requirements only (i.e. analysis needs); (ii) methods based on data sources (data-driven approach), where the multidimensional schema is automatically derived from the data sources; (iii) mixed methods (hybrid approach), which merges data-driven and user-driven methodologies. it has been widely recognized that mixed approaches are the most effective for the design of successful DW projects. They provide mechanisms to map and validate users’ requirements on data sources, and output a model [7]. However, as previously described in Sect. 1, they are not appropriate for our vision since they do not provide collaborative support needed to solve conflicts of requirements. Indeed, although conflicts management during the requirement elici‐ tation phase has been explored in several domains [9], this software engineering theory has not yet been applied to the DW design. To the best of our knowledge, only [6] provides an agile questionnaire-based methodology to help decision-makers to work together in the conception of the DWs, but this approach is not supported by a computer tool. Contrary to DWs, users participation to design and collaborative design method‐ ologies has been adopted in other fields (such as in GIS [8], to aid in mitigating semantic coherence, in socio-material design [10], e-learning, etc.). For the similarities and
and similarities have been proposed in literature (such as [1]), but they are too much complex to be used in our proposal, since, contrary to existing approaches, in our context all models are defined from the same source of data.
Existing computer tools for collecting analysis needs within user-driven approaches are formalized using complex formalisms [7, 15], or query languages (i.e. SQL, MDX, etc.). However, in our approach with ProtOLAP we use the same approach of [11] that formalizes requirements as pivot tables. This allows us to use pivot tables (i.e. cubes prototypes) to represent requirements but also to elicit them. Indeed, about the elicitation of multidimensional requirements, apart from manual approaches (meetings, reports, etc.), some existing works provide automatic tools for translating requirements defined in natural language into models [22]. Nevertheless, they require that decision-makers are OLAP skilled users, which is obviously not true for volunteers.
6
Conclusion and Future Work
In this work, we propose new collaborative DW design methodology that allows involving volunteers in the definition of analysis needs over VGI data. Our methodology allows DW and OLAP unskilled volunteers to participate to the design process. We implement the methodology and validate it using a real farmland biodiversity case study, thus, a better assessment would be by applying it on a case study in which, different volunteers with conflicting models can attend the collaborative evaluation step to vali‐ date the effectiveness of the conflicts resolution.
Our current work is dedicated to apply the collaborative methodology also on hier‐ archies’ definition and to test other group decision methods. Moreover, with ProtOLAP, DW experts must assist volunteers in the elicitation process, which becomes impossible in a large-scale requirements crowdsourcing scenario. Then, our future work is to provide a user-friendly visual language based on the pivot table metaphor for the multi‐ dimensional requirements elicitation step. Finally, we will extend criteria used by our collaborative approach according to qualitative metrics defined for DW user satisfaction, as in [5], as well as integrating some quantitative ones such as what [20] highlighted. Acknowledgment. This work is supported by the project ANR-17-CE04-0012. We thank Pr. Omar Boussaid and Stefano Rizzi for their precious advices.
References
1. Bakillah, M., Mostafavi, M.A., Bédard, Y.: A semantic similarity model for mapping between evolving geospatial data cubes. In: Meersman, R., Tari, Z., Herrero, P. (eds.) OTM 2006. LNCS, vol. 4278, pp. 1658–1669. Springer, Heidelberg (2006). https://doi.org/ 10.1007/11915072_72
2. Bimonte, S., Boucelma, O., Machabert, O., Sellami, S.: A new Spatial OLAP approach for the analysis of volunteered geographic information. Comput. Environ. Urban Syst. 48, 111– 123 (2014). https://doi.org/10.1016/j.compenvurbsys.2014.07.006
3. Bimonte, S., Edoh-alove, E., Nazih, H., Kang, M.-A., Rizzi, S.: ProtOLAP: rapid OLAP prototyping with on-demand data supply. In: DOLAP 2013, pp. 61–66. ACM, New York (2013). https://doi.org/10.1145/2513190.2513199
4. Brabham, D.C.: Crowdsourcing as a model for problem solving: an introduction and cases. Convergence. 14, 75–90 (2008). https://doi.org/10.1177/1354856507084420
5. Chen, L., Soliman, K.S., Mao, E., Frolick, M.N.: Measuring user satisfaction with data warehouses: an exploratory study. Inf. Manage. 37, 103–110 (2000). https://doi.org/10.1016/ S0378-7206(99)00042-7
6. Corr, L., Stagnitto, J.: Agile Data Warehouse Design: Collaborative Dimensional Modeling, from Whiteboard to Star Schema. DecisionOne Consulting (2011)
7. Cravero, A., Sepúlveda, S.: Multidimensional design paradigms for data warehouses: a systematic mapping study. J. Softw. Eng. Applications. 07, 53 (2013). https://doi.org/ 10.4236/jsea.2014.71006
8. Driedger, S.M., Kothari, A., Morrison, J., Sawada, M., Crighton, E.J., Graham, I.D.: Correction: using participatory design to develop (public) health decision support systems through GIS. Int J Health Geogr. 6, 53 (2007). https://doi.org/10.1186/1476-072X-6-53 9. Egyed, A., Grunbacher, P.: Identifying requirements conflicts and cooperation: how quality
attributes and automated traceability can help. IEEE Softw. 21, 50–58 (2004). https:// doi.org/ 10.1109/MS.2004.40
10. Ehn, P.: Participation in design things. In: Proceedings of the Tenth Conference on Participatory Design 2008, Indianapolis, IN, USA, pp. 92–101 (2008)
11. Nabli, A., Feki, J., Gargouri, F.: Automatic construction of multidimensional schema from OLAP requirements. In: AICCSA (2005). https://doi.org/10.1109/aiccsa.2005.1387025 12. Kimball, R., Ross, M.: The Kimball Group Reader: Relentlessly Practical Tools for Data
Warehousing and Business Intelligence Remastered Collection. Wiley (2016)
13. Levrel, H., et al.: Balancing state and volunteer investment in biodiversity monitoring for the implementation of CBD indicators: a French example. Ecol. Econ. 69, 1580–1586 (2010). https://doi.org/10.1016/j.ecolecon.2010.03.001
14. Nuseibeh, B., Easterbrook, S.: Requirements engineering: a roadmap. In: Conference on the Future of Software Engineering, pp. 35–46. ACM, New York (2000). https://doi.org/ 10.1145/336512.336523
15. Romero, O., Abelló, A.: A survey of multidimensional modeling methodologies. IJDWM 5, 1–23 (2009). https://doi.org/10.4018/jdwm.2009040101
16. Gavish, B., Gerdes, J.H.: Voting mechanisms and their implications in a GDSS environment. Ann. Oper. Res. 71, 41–74 (1997). https://doi.org/10.1023/A:1018931801461
17. Stefanovic, N., Han, J., Koperski, K.: Object-based selective materialization for efficient implementation of spatial data cubes. IEEE Trans. Knowl. Data Eng. 12, 938–958 (2000). https://doi.org/10.1109/69.895803
18. Sui, D.Z., Elwood, S., Goodchild, M. (eds.): Crowdsourcing Geographic Knowledge: Volunteered Geographic Information (VGI) in Theory and Practice. Springer, Dordrecht (2013). https://doi.org/10.1007/978-94-007-4587-2
19. Zaraté, P.: Tools for Collaborative Decision-Making: Zaraté/Tools for Collaborative Decision-Making. Wiley, London (2013)
20. Golfarelli, M., Rizzi, S.: Data warehouse testing: a prototype-based methodology. Inf. Softw. Technol. 53(11), 1183–1198 (2011). https://doi.org/10.1016/j.infsof.2011.04.002
21. Pohl, K.: Requirements Engineering: Fundamentals, Principles, and Techniques. Springer, Heidelberg (2010)
22. Naeem, M.Asif, Ullah, S., Bajwa, I.S.: Interacting with data warehouse by using a natural language interface. In: Bouma, G., Ittoo, A., Métais, E., Wortmann, H. (eds.) NLDB 2012. LNCS, vol. 7337, pp. 372–377. Springer, Heidelberg (2012). https://doi.org/ 10.1007/978-3-642-31178-9_50
23. Torlone, R.: Two approaches to the integration of heterogeneous data warehouses. Distrib. Parallel Databases 23(1), 69–97 (2008). https://doi.org/10.1007/s10619-007-7022-z


![Administration de [6]-gingérol intrathécal pour le traitement de la douleur neuropathique chez le rat mâle Sprague-Dawley](data:image/gif;base64,R0lGODlhAQABAIAAAP///wAAACH5BAEAAAAALAAAAAABAAEAAAICRAEAOw==)