HAL Id: hal-00296327
https://hal.archives-ouvertes.fr/hal-00296327
Submitted on 7 Sep 2007
HAL is a multi-disciplinary open access
archive for the deposit and dissemination of
sci-entific research documents, whether they are
pub-lished or not. The documents may come from
teaching and research institutions in France or
abroad, or from public or private research centers.
L’archive ouverte pluridisciplinaire HAL, est
destinée au dépôt et à la diffusion de documents
scientifiques de niveau recherche, publiés ou non,
émanant des établissements d’enseignement et de
recherche français ou étrangers, des laboratoires
publics ou privés.
coastal Antarctica measured with a new instrument for
the detection of sub-part per trillion mixing ratios of
PAN
G. P. Mills, W. T. Sturges, R. A. Salmon, S. J.-B. Bauguitte, K. A. Read, B.
J. Bandy
To cite this version:
G. P. Mills, W. T. Sturges, R. A. Salmon, S. J.-B. Bauguitte, K. A. Read, et al.. Seasonal variation of
peroxyacetylnitrate (PAN) in coastal Antarctica measured with a new instrument for the detection of
sub-part per trillion mixing ratios of PAN. Atmospheric Chemistry and Physics, European Geosciences
Union, 2007, 7 (17), pp.4589-4599. �hal-00296327�
www.atmos-chem-phys.net/7/4589/2007/ © Author(s) 2007. This work is licensed under a Creative Commons License.
Chemistry
and Physics
Seasonal variation of peroxyacetylnitrate (PAN) in coastal
Antarctica measured with a new instrument for the detection of
sub-part per trillion mixing ratios of PAN
G. P. Mills1, W. T. Sturges1, R. A. Salmon2, S. J.-B. Bauguitte2, K. A. Read3, and B. J. Bandy1
1School of Environmental Sciences, University of East Anglia, Norwich NR4 7TJ, UK 2British Antarctic Survey, Maddingley Road, Cambridge, UK
3Department of Chemistry, University of York, Heslington, York YO19 4RR, UK
Received: 5 April 2007 – Published in Atmos. Chem. Phys. Discuss.: 26 April 2007 Revised: 20 August 2007 – Accepted: 4 September 2007 – Published: 7 September 2007
Abstract. An automated gas chromatograph with sam-ple pre-concentration for the measurement of peroxyacetyl-nitrate (PAN) was constructed with a minimum detection limit below 1 pptv. This instrument was deployed at the British Antarctic Survey’s Halley Research Station, Antarc-tica (75.6◦S, 26.6◦W) as part of the CHABLIS (Chem-istry of the Antarctic Boundary Layer and the Interface with Snow) campaign. Hourly measurements were carried out between July 2004 and February 2005 with observed max-imum and minmax-imum mixing ratios of 52.3 and <0.6 pptv, re-spectively with a mean PAN mixing ratio for the measure-ment period of 9.2 pptv (standard deviation: 6.2 pptv). The changes in PAN mixing ratios typically occurred over peri-ods of several days to a week and showed a strong similar-ity to the variation in alkenes. The mixing ratio of PAN at Halley has a possible seasonal cycle with a winter maximum and summer minimum, though the cycle is incomplete and the data are very variable. Calculations indicate that gross local PAN production is approximately 1 pptv d−1in spring and 0.6 pptv d−1in summer. Net loss of PAN transported to Halley in the summer is a small gas-phase source of NOx and net production of PAN in the spring is a very small NOx sink.
1 Introduction
One of the products of the oxidation of most hydrocarbons by OH radicals in the presence of NO2is peroxyacetylnitrate
(CH3C(O)OONO2), hereafter referred to as PAN, which is
the most abundant of a number of peroxy nitrates which have been observed in the troposphere (Roberts 1990, Roberts et al., 2003; Flocke et al., 2005).
Correspondence to: G. P. Mills
(g.mills@uea.ac.uk)
Since its discovery as a component of photochemical smog, PAN has been measured throughout the troposphere, even in remote locations. The mixing ratios of PAN seen in highly polluted urban environments can reach tens of parts per billion (ppbv) (Gaffney et al., 1999; Rappengluck et al., 2000) whilst the levels seen in remote marine environments are often only a few pptv (Gallagher et al., 1990; Muller and Rudolph, 1992; Staudt et al., 2003)
While the production of the peroxyacetyl (PA) radical (which reacts with NO2to make PAN) is a photolytic
pro-cess, the main loss process for PAN is initiated by dissocia-tion into the peroxyacetyl radical and NO2. This dissociation
process is highly sensitive to temperature, so much so that a change in temperature from 300 K to 270 K changes the calculated rate of dissociation by over two orders of mag-nitude. Thus PAN produced in polluted environments and lifted to high altitudes, where the temperatures are low, could be transported great distances before the air descends and warms, releasing the NO2 tied up in PAN. This transport
of PAN away from source regions and its subsequent ther-mal decomposition has long been a subject of interest as a source of nitrogen oxides (NOx), and thus a potential impact on ozone production, in remote regions (Crutzen, 1979; Rid-ley et al., 1990, Hudman et al., 2004).
While there have been many studies of PAN in remote northern hemisphere locations, with several of the arctic (Bottenheim and Gallant, 1989; Beine and Krognes, 2000; Dassau et al., 2004), there are fewer published studies of the southern hemisphere and only currently two of high southern latitudes.
Measurements made during the PEAN’99 campaign show PAN mixing ratios at Neumayer (70.6◦S, 8.3◦W) ranging between 48 pptv and <5pptv (the limit of detection) dur-ing February (Jacobi et al., 2000). This campaign was fol-lowed by a cruise north from Neumayer to Cape Town, South Africa in March and there was only 1 pptv variation in the ob-served daily mean PAN mixing ratios of 17.6 pptv at latitudes
A B Purge Gas ECD MFC G Temperature Controlled Oven Sample Calibration Pump H A B C D F E Make-up Gas Carrier Gas Column Purge Gas ECD MFC G Temperature Controlled Oven Sample Calibration Pump H A B C D F E Make-up Gas Carrier Gas Column ECD MFC G Temperature Controlled Oven Sample Calibration Pump H A B C D F E Make-up Gas Carrier Gas Column MFM MFM Fan Air NO A B C To GC Vent MFM MFM MFM Fan Air NO A B C To GC Vent
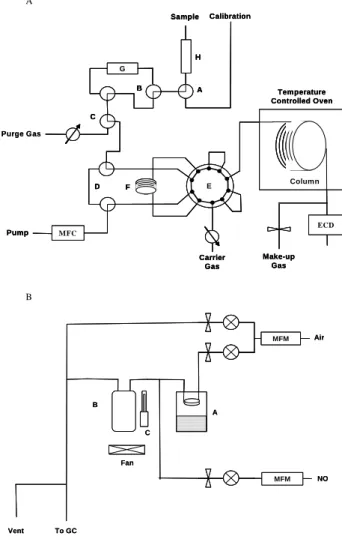
Fig. 1. (A) schematic of the gas chromatograph showing
calibra-tion seleccalibra-tion valve (A), zero valve (B), start/stop/purge valve (C), bypass valves (D), VICI valve (E), the cooled sample trap (F), the heated tube for performing zeros (G) and the nafion Dryer (H). (b) Schematic of the calibration unit. (A) acetone reservoir, (B +C) photolysis cell and penray lamp. MFM is a mass flow meter.
between 60◦S and 70◦S (Jacobi and Shrems, 1999).
How-ever, since both studies were limited to the late austral sum-mer we have no seasonal information.
This study aims to add to the exceptionally sparse mea-surements of PAN so far reported in the Antarctic region and to investigate any seasonality of PAN mixing ratios in Antarctica. In this paper we present measurements taken over the austral winter, spring and summer of 2004–2005, made with a purpose built automated gas chromatograph which we describe.
2 Experimental
2.1 Measurement site
All the measurements used in this study were taken at the Clean Air Sector Laboratory (CASlab) at Halley located on the Brunt ice shelf, Antarctica. The predominant wind direc-tion at Halley is easterly, with westerly and more southerly winds also contributing a significant proportion of surface wind directions seen at Halley (King, 1985; Renfrew and An-derson, 2002). Northerly winds are rare. The CASlab itself was situated approx. 1 km SSE from the main base.
The CASlab sample manifold consisted of an unheated in-let approximately 8m above the surface, connected to a 10 cm diameter stainless steel pipe from which the instrument sam-pled via a 2 m long 1/8” PFA line.
Measurements of ozone, CO and non-methane Hydrocar-bons (NMHC) were made throughout the PAN measurement period, while measurements of NO and NO2data were
avail-able for January and February only. Ozone was measured every minute using a commercial UV absorption instrument (2B Technologies). NMHC were measured on an hourly ba-sis using a GC-FID with pre-concentration of samples on an adsorbent trap (Read et al., 2007), with detection limits in the range 2–5 pptv for C2-C5 hydrocarbons. CO was
mea-sured as a 30 s average using a commercial fast-response resonance fluorescence instrument (Aerolaser GmbH). OH and HO2radicals were also measured during the summer
in-tensive period (late December to early February) using the FAGE technique (Bloss et al., 2007).
2.2 Instrument description
The GC used in this study was a 19” rack mounted computer controlled instrument and a schematic is shown in Fig. 1a. This schematic does not show details of the trap itself or the temperature controls.
2.2.1 Sample trap
The sample trap consists of a 1 m coil of 0.53 mm MxT-1 (100% dimethylpolysiloxane) metal column (Restek) with a film thickness of 7 µm. The coil was contained inside a cir-cular groove cut into a 3×3×0.5 cm aluminium block and held in the groove by an aluminium plate. The block was cooled to between 223 K and 208 K using a triple stage cas-cade peltier (Melcor CP1.0-127-05L operated at 6 V on top of a Melcor 2SC055045-127-63L running at 13 V) with a wa-ter cooled heatsink maintained at 263 K by a re-circulating water chiller. The temperatures of the aluminium block and the sample loop were recorded with T-type thermocouples. The cold block was insulated and sealed to prevent water condensing on the trap.
For injections, the sample loop was heated by passing a current directly through the sample loop using a 12 V DC supply. The heating of the sample loop was controlled by
computer and heating rates of approximately 14◦C s−1were
used. An injection temperature of 308–318 K was used to minimise the thermal decomposition of PAN in the sample loop.
2.2.2 Column and column oven
The column was a 15 m long 0.25 mm i/d MXT-200 (tri-fluoropropylmethyl polysiloxane) with a 1 µm film (Restek) which was housed in a temperature programmable oven. The column was held at 263 K for 3 min and then heated up to 318 K, initially at 1.3 K min−1 and then after PAN had eluted, at 5 K min−1. Under typical operating conditions, PAN eluted after 12 min. The oven consisted of an insulated 1.3 cm thick aluminium block with a 10 cm diameter circular groove cut into it, into which the column sat and was held tightly in place by a covering plate. The block was cooled with a 58 W single-stage Peltier device and heated on the opposite side by a 50 W mat heater attached to the cover-ing plate. The temperature of the column was measured in 3 places by k-type thermocouples to ensure an even temper-ature along the column. Maximum and minimum possible temperatures of the column were limited by temperature con-trollers and temperatures within this range were regulated by turning the heater/peltier combination on and off as neces-sary.
2.2.3 Sample manifold and zeros
The sample manifold consisted of six 3-way PTFE solenoid valves connected by silcosteel tubing (Restek). The sample manifold was flushed with sample air for 3 min before trap-ping started by actuating two bypass valves (D in Fig. 1) and the purge valve (C). Trapping was initiated by deactivating valves (D) and terminated by deactivation of valve (C). Be-cause of the small diameter of the trap, the amount of water in 200 ml of Antarctic air could block the trap so the air sam-ples were dried with a 72” nafion dryer (H) situated upstream of valve (A). All samples were trapped for 10 min at 20 sccm and purged with helium for 20 s prior to injection to reduce the disruption to the baseline caused by the oxygen in the sample.
Calibrations were performed by actuating valve (A) which selects the output from the calibration unit and zeros were performed by diverting the sample flow through a 3m length of 1/8” silcosteel tubing wound onto an aluminium block (G) maintained at 423 K, a method commonly used in PAN in-struments. At this temperature 99.9% of PAN should have dissociated in 0.14 s and at sample flow rate of 20 sccm the residence time in the tube is approx. 14 s. Bare stainless steel tubing was not used to avoid possible decomposition of propyl nitrate, which co-elutes with PAN on this column, on dry metal. Propyl nitrate should not thermally decompose at this temperature because it has a lifetime of over 2 h at 420 K
based on the thermal dissociation rate constant of Barker et al. (1977).
All gases were drawn through the trap with a diaphragm pump and the flow rates were controlled by a downstream mass flow controller between the trap and the pump.
2.2.4 Others
The carrier and purge gases (both Helium) were regulated by pressure regulators and the detector make up gas (Ar-CH4(5%)) was controlled by a stainless steel double stage
needle valve. Typical operating conditions were a column flow rate of 1-2 ml min−1and a makeup gas flow of 25 ml min−1
The detector was a CE80 Electron capture detector (Thermo Scientific) controlled with an ECD850 control unit (Thermo Scientific). The detector was held at 329 K to min-imise PAN decomposition in the detector, which was signifi-cant at a detector temperature of 350 K
Data was acquired using custom written software and Measurement Computing hardware and data was sampled at 81 Hz and averaged and recorded at 9 Hz.
2.2.5 Calibration unit
The calibration unit produces PAN using the widely used method of photolysis of acetone/air/NO mixtures (Warneck and Zerbach, 1992; Flocke et al., 2005). A schematic of the calibration unit is shown in Fig. 1b.
Acetone-containing air (50–100 ml min−1) is mixed with
NO (flow 0.5–2 ml min−1) and the mixture is photolysed in
a flow-through Pyrex cell. A Penray mercury lamp was em-ployed and the Pyrex cell cuts out wavelengths below 290 nm, preventing photolysis of PAN in the cell. This minimises PAN photolysis within the cell, but requires a higher acetone concentration for maximum conversion of NO to PAN than the method of Flocke et al. (2005). The acetone containing air was generated by passing air through silicone tubing held above an acetone reservoir and the length of the silicone tube was optimised to minimise the amount of acetone required for maximum PAN production. The PAN produced in the photolysis cell is then further diluted by zero air, the flow of which is controlled by a flow control valve. The total air flow (acetone permeation + diluent) was measured upstream with a mass flow meter.
The lamp and the upstream solenoid on/off valves were controlled by PC allowing automatic selection of a variety of calibration unit outputs (zero air, non-photolysed mixture etc).
Prior to the field deployment, the output of the calibrator was analysed on a 4 channel chemiluminescence NOxy in-strument (Brough et al., 2003) and a GC-ECD optimised for organic nitrate analysis (Jones et al., 1999). Within the cali-bration unit greater than 99.5% NO loss was observed, with approx. 1% of the NOy output being methyl nitrate. Because
64 62 60 58 56 54 52 E C D re s p o n s e (a rb u n it s ) 960 940 920 900 880 860 Elapsed time (s) 60 50 40 30 20 10 0 E C D re s p o n s e (s rb u n it s ) 350 300 250 200 150 100 50 0 Volume trapped (ml) 200 150 100 50 0 R e s p o n s e (a rb u n it s ) 100 80 60 40 20 0
PAN mixing ratio (pptv)
R2=0.998 A B C 600 500 400 300 200 100 0 P e a k A re a (A rb U n its ) 01/07/2004 01/08/2004 01/09/2004 01/10/2004 01/11/2004 01/12/2004 01/01/2005 01/02/2005 Date 25 20 15 10 5 0 C a lib ra ti o n R e s p o n s e (a rb . U n it s ) D
Fig. 2. (A) Response of the instrument to 200 ml samples of
dif-ferent PAN mixing ratios trapped at 223 K (B) The response of the instrument to different sample volumes at two temperatures, 210 K (black-open) and 223 K (red-solid) (C) Two chromatograms of Antarctic air taken on 11 December 2004 containing 31 pptv of PAN (red line), and after passing through zero heater (grey line).
(D) Timeseries of calibration-derived instrument sensitivity
(red-markers) and area of peak X (probably mostly CCl4) from air
sam-ples obtained during the deployment in Halley.
of the presence of acetone, the NO2could not be determined
very accurately with this instrument, but was estimated at only 3–4% of the total NOy. We thus estimate that the cal-ibration source converts NO to PAN with about a 95 +/–2% efficiency. The accuracy in the calibration output, as calcu-lated from the sum of the squares of the individual errors in gas flows, conversion efficiency and the NO mixing ratio, is estimated to be 14.2%. The NO standard used by the calibra-tor was re-analysed post campaign and was found to be 2% lower than its pre-campaign certification level (E. Williams, personal communication).
3 Results and discussion
3.1 Instrument performance
To test if the instrument response was linear with concenttion, 200 ml samples of calibration gas with PAN mixing ra-tios between 8 and 107 pptv were trapped at 223 K. A sample of photolysed air/acetone (NO not added) was also measured. It is clear from Fig. 2a that the instrument is linear over the range studied.
Figure 2b shows the detector response to a calibration of 20 pptv as a function of sample volume at two trapping tem-perature (210 and 223 K). As can be seen, the instrument re-sponse is linear for small sample volumes, but flattens out at higher volumes indicating that sample breakthrough has occurred and that at 200 ml the trap has reached equilibrium with the sample air. At 223 K the curve starts to become non-linear at a lower sample volume and the instrument response is lower at high sample volumes indicating a smaller effec-tive volume of air is concentrated at 223 K than at 210 K. This suggests that variations in trap temperature could thus result in inaccurate PAN measurements. During the measure-ment period, the fluctuations in trap temperature were ob-served mainly in the winter when the laboratory temperature fluctuated most. These occurred over periods of several days and since calibrations were performed during these periods the change in temperature and thus effective sample volume should not have given spurious results. There was however a drift in the minimum attainable temperature during the cam-paign and at the start of the camcam-paign a trapping temperature of 208 K was achieved, whilst at the end of the campaign the trapping temperature was 220 K.
This change in the effective volume trapped did not af-fect the observed linearity with concentration but did reduce the sensitivity and thus the ultimate limit of detection. This could be improved with a longer trap and/or a trap with a larger surface area. At 220 K, the precision of the instrument measuring calibrations (200 ml volume at 72 pptv) over a pe-riod of 48 h was 4.7% (3 sigma of 48 samples), and 5.2% for 18 consecutive calibrations at 14.1 pptv.
Figure 2c shows two chromatograms obtained in Antarc-tica on 11th of December 2004, an air sample containing 31 pptv of PAN and an air sample with the PAN decomposed by passing the sample through the zero heater.
It is evident from Fig. 2c that the PAN is removed by pass-ing the sample through the heated section and there is no evidence of propyl nitrate which co-elutes with PAN on this column, but is not decomposed by the heater. The small peak after PAN in the air sample in Fig. 2c is an unknown compo-nent that is often not present at all, but when it is present is always very small it was not present in any air samples after the zero for many hours. No other peaks in the chromatogram showed a change upon passing through the heater. Propyl nitrate was never observed in any of the zeros during this study. This is consistent with propyl nitrate measurements
from bottle samples made regularly throughout the year at Halley being consistently below 0.2 pptv (and often below 0.05 pptv) with only a few exceptions in winter and mid sum-mer where levels reached 1 pptv (data not shown)
The limit of detection (LoD) of the instrument was esti-mated from the standard deviation of the noise of the chro-matogram in the PAN region during zeros and the instrument sensitivity calculated from the calibrations, and is defined here as 3σ of the noise.
The detection limit of the instrument varied throughout the measurement period between a minimum of 0.6 pptv and a maximum of 4.2 pptv with a median of 1.65 (LQ=0.89,UQ=2.85) pptv. The causes of the drifts in instru-ment sensitivity are probably mostly the result of trapping temperature changes-particularly in the winter months and, because of the small size of the trap and low injection tem-peratures used, possible variations in the cleanliness and ef-fectiveness of the trap caused by occasional accumulation on the trap of less volatile components. The variation in base-line noise may be due to changes in the cleanbase-liness of the detector and the efficacy of the sample drying throughout the campaign.
The mean short-term precision, which is determined by sample-sample reproducibility and variation of instrument sensitivity between calibrations, determined from 20 sets, taken throughout the whole measurement period, of 8 con-secutive air injections was 16 +/– 8%. This was considerably worse than the precision observed for lab calibrations before and after the campaign and also worse than that observed during night-time ambient air measurements made in Nor-wich post-campaign (9%). The cause of the poor precision in Antarctica is unknown.
3.2 Field measurements
PAN measurements were obtained from 7 July 2004 to the end of January 2005. Problems with the logging computer prior to July meant only sporadic data were obtained between March and June 2004 and these data are not included here. Samples were taken at 1 h intervals, calibrations were per-formed every 2 days and heated zeros perper-formed every 4–5 days. Occasional blanks were also performed throughout the campaign, by sampling helium with no evidence of contam-ination observed at any time.
To study the long term stability of the instrument and cali-bration source, the calicali-bration-derived GC sensitivity can be compared with the sensitivity of the instrument to long lived halocarbons. In our chromatograms of air (but not the cali-brations) we have a few peaks which on the MxT-200 column elute earlier than PAN and are probably halocarbons. The largest and one of the latest eluting of the unknowns, peak X, is likely to be mostly CCl4. The integrated area of this peak
is plotted with the calibration-derived sensitivity in Fig. 2d. The two measurements follow a very similar pattern over pe-riods of a few days and also have the same longer term
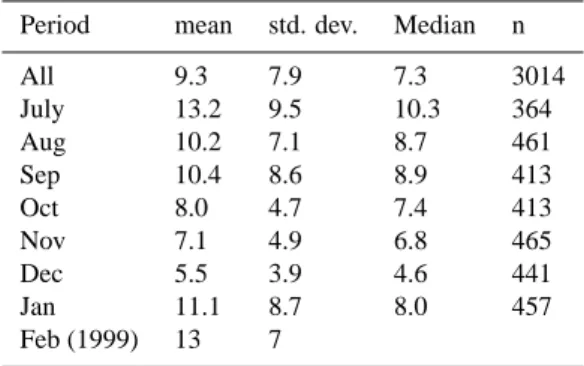
vari-Table 1. Statistical overview of PAN mixing ratios (in pptv) during
CHABLIS. The Data for Feb 99 measured at Neuymayer (Jacobi et al 2000) is included for comparison. Means and medians are cal-culated from the hourly data using 0.5* est LoD for periods where PAN was below the LoD.
Period mean std. dev. Median n
All 9.3 7.9 7.3 3014 July 13.2 9.5 10.3 364 Aug 10.2 7.1 8.7 461 Sep 10.4 8.6 8.9 413 Oct 8.0 4.7 7.4 413 Nov 7.1 4.9 6.8 465 Dec 5.5 3.9 4.6 441 Jan 11.1 8.7 8.0 457 Feb (1999) 13 7
ations suggesting that we are witnessing changes in the GC sensitivity rather than changes in the calibrator output. It is clear from Fig. 2d that the relative magnitudes of the peak X area and sensitivity measurements vary over the short term, but it must be recognised that there are large uncertainties re-garding peak X such as its sensitivity to trapping conditions, its resolution from other closely eluting components and a poor baseline in the early part of the chromatogram, all of which will contribute to the variation. Over the last 3 months of the campaign, there is a gradual decrease in the mean ratio of calibration sensitivity to peak X area. This may be caused by a change in calibrator output leading to a maximum po-tential overestimation of PAN of 10% in January, but equally it could be changes in peak X area that are responsible for this drift.
A time series of the hourly PAN measurements and the daily mean PAN mixing ratio is shown in Fig. 3 along with hourly data for CO, ozone, temperature, TUV calculated so-lar flux (as a guide to potential photochemically active ra-diation) and 6C2-C5 alkenes. Table 1 shows a statistical
overview of the PAN data and includes the February 1999 measurements of Jacobi et al. (2000), for comparison. Where samples were below the LoD of the instrument a value of half the LoD at that time was used in the calculation of the daily and monthly averages shown in both Table 1 and Figs. 3 and 4.
The daily mean PAN mixing ratio varied from 0.82 pptv to 33.2 pptv, whilst the individual hourly measurements ranged from below 0.6 pptv (lowest LoD) to 52.3 pptv (observed on 27 July.). Throughout the measurement period 17% of the individual hourly measurements were below the detection limit of the instrument and 23% were lost through instrument problems-mostly in groups of 2–3 days.
There was no example of a diurnal variation in PAN observed at any time during the measurement period and the variation in the mixing ratios typically took place over periods of several days to a week.
50 40 30 20 10 0 P A N ( p p tv ) 01/07/2004 01/09/2004 01/11/2004 01/01/2005 Date 50 45 40 35 C O ( p p b v ) 30 25 20 15 10 5 O z o n e ( p p b v ) 600 500 400 300 200 100 0 S u m A lk e n e s ( p p tv ) -40 -30 -20 -10 0 A ir T e m p ( oC ) 30 25 20 15 10 5 0 2 9 0 -4 5 0 n m F lu x ( W m -2 ) A B C
Fig. 3. Timeseries of data from Halley from July 2004 to Feb 2005
showing (A) hourly PAN measurements (red line), daily mean PAN
mixing ratios (black triangles) and the 6C2-C5alkenes. (B) Ozone
(blue) and CO (black) hourly measurements. (C) Hourly air temper-ature (red) and TUV calculated irradiation (290–450 nm) as a guide to photochemically active radiation.
The PAN mixing ratios observed in this study are consis-tent with those obtained at Neumayer, which is also a coastal site, by Jacobi et al. (2000) in February 1999, when a mean mixing ratio of 13 pptv was reported, with a maximum value of 48 pptv. The levels seen at Halley are somewhat lower than PAN levels typically observed in the MBL in the South-ern Ocean and South Atlantic in early March (Jacobi and Schrems, 1999) though it is recognised that our data was ob-tained earlier in the season than those obob-tained in the South Atlantic. They are also much lower than the mixing ratios observed at Ny- ˚Alesund, Svalbard (78.9◦N, 11.9◦E) in the comparable arctic seasons (Beine and Krognes 2000) and those seen at Alert, Nunavut (82.5◦N, 62.5◦W) and Summit, Greenland (72.5◦N, 38.4◦W)(Dassau et al., 2004). This is not surprising given the much greater distances from sources of pollution in Antarctica compared to the Arctic and the lower levels of PAN precursors in the southern hemisphere in general.
A linear regression of the daily means of PAN and ozone shows no correlation and the short –term variation of PAN in this study does not correlate with ozone or CO, though there is one occasion (24 to 31 January) where PAN correlates well with CO. This is in sharp contrast with a long term study of
30 20 10 P A N ( p p tv )
Jul Sep Nov Jan
Month 30 25 20 15 10 O z o n e (p p b v ) 200 150 100 50 0 A lk e n e s (p p tv ) 50 45 40 35 30 C O (p p b v ) A B C D
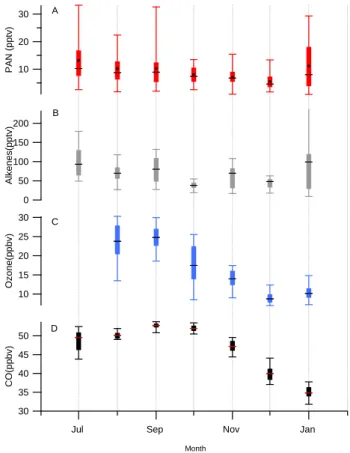
Fig. 4. Box and whisker plot showing seasonal variability of (A)
PAN , (B) 6C2-C5alkenes, (C) ozone and (D) CO for each calendar
month. There was no ozone data for July. The horizontal line is the median, the box represents the upper and lower quartiles and the whiskers show the maximum and minimum daily means for that month. The alkene maximum in January was >500 pptv and is off scale. For PAN, the monthly mean is also plotted as black circles.
PAN in the Arctic at Ny- ˚Alesund where ozone and PAN were highly correlated throughout the year (Beine and Krognes; 2000). The PAN, ozone and alkene data all show short term variability and whilst there is no relationship between PAN and ozone variability, there are several periods where PAN and the alkenes vary in a very similar way for long periods (e.g. 21 January 2005–31 January 2005). There are also pe-riods where large changes in one species are not matched by changes in the other (31 December 2004–14 January 2005 is a good example).
Several studies have shown a clear seasonal cycle in the arctic with a spring maximum in PAN and a summer mini-mum. The monthly medians of PAN, ozone and CO are plot-ted in Fig. 4 and whilst CO and ozone show clear seasonal variability, with a September maximum for CO and ozone (although we do not have data for earlier in the year) the pat-tern in PAN is less clear. Whilst the observed median PAN concentrations are highest in winter and lowest in summer, and although the median PAN and ozone values follow a very
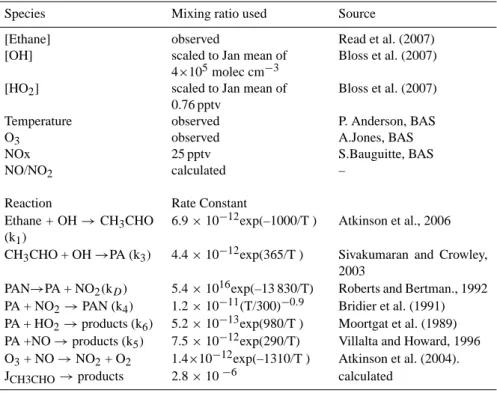
Table 2. Rate constants and concentrations used in calculations. First order rate constants are in s−1and 2ndorder are in molec−1cm3s−1.
Photolysis rates are calculated from TUV and NO/NO2is calculated from the Leighton relationship.
Species Mixing ratio used Source
[Ethane] observed Read et al. (2007)
[OH] scaled to Jan mean of
4×10⁵molec cm−3
Bloss et al. (2007)
[HO2] scaled to Jan mean of
0.76 pptv
Bloss et al. (2007)
Temperature observed P. Anderson, BAS
O3 observed A.Jones, BAS
NOx 25 pptv S.Bauguitte, BAS
NO/NO2 calculated –
Reaction Rate Constant
Ethane + OH → CH3CHO
(k1)
6.9 × 10⁻¹²exp(–1000/T ) Atkinson et al., 2006
CH3CHO + OH →PA (k3) 4.4 × 10⁻¹²exp(365/T ) Sivakumaran and Crowley,
2003
PAN→PA + NO2(kD) 5.4 × 10¹⁶exp(–13 830/T) Roberts and Bertman., 1992
PA + NO2→PAN (k4) 1.2 × 10⁻¹¹(T/300)−0.9 Bridier et al. (1991)
PA + HO2→products (k6) 5.2 × 10⁻¹³exp(980/T ) Moortgat et al. (1989)
PA +NO → products (k5) 7.5 × 10⁻¹²exp(290/T) Villalta and Howard, 1996
O3+ NO → NO2+ O2 1.4×10⁻¹²exp(–1310/T ) Atkinson et al. (2004).
JCH3CHO→products 2.8 × 10⁻⁶ calculated
similar pattern, the much greater day to day variation in PAN mixing ratios means that any seasonal cycle inferred from these data alone are tentative. The alkene data presented here for the July to January period show no clear seasonal pattern, but the full cycle peaks in April-May with a sharp decline into July (Read et al., 2007)
For the measurement period the daily local gross pro-duction rate of PAN was estimated, in the same manner as Dassau et al. (2004), using the following simplified reaction scheme and assuming acetaldehyde was in steady state and was the only source of the PA radical.
C2H6+OH → CH3CHO (R1) CH3CHO + hν → loss (R2) CH3CHO + OH → PA (R3) PA + NO2→PAN (R4) PA + NO → loss (R5) PA + HO2→loss (R6)
Clear-sky photolysis rates were estimated using TUV derived actinic flux (Madronich and Flocke, 1988) and the OH and HO2concentrations were estimated by scaling the measured
January mean concentrations with the actinic flux using the same method as Bloss et al. (2007).
NOx was assumed to be a constant 25 pptv and the NO/NO2ratio was estimated from the Leighton relationship
(Leighton, 1961) using observed ozone.
Table 2 shows the source of the data and the rate constants used in the calculation of both steady state acetaldehyde and PAN production.
These calculations suggest that gross PAN production is roughly constant at approx 0.9–1 pptv pptv d−1 throughout the spring and early summer and that in January it is only 0.6 pptv d−1 at Halley, though there may well be additional sources of both acetaldehyde and peroxyacetyl radicals, such as acetone, which would alter this production rate. Unfortu-nately no measurements of these oxygenates were made.
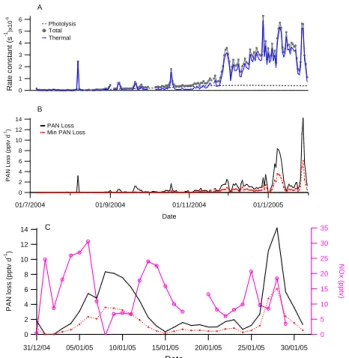
PAN loss rates were similarly estimated for the entire mea-surement period using the thermal and photoysis rate con-stants. Figure 5a shows the calculated thermal dissociation and photolysis rate constants throughout the measurement period, as well as the combined total rate constant.
Except in spring, when the total rate is still small, photol-ysis was only a minor contributor to the total PAN decompo-sition rate. The loss due to OH was an order of magnitude lower than that of photolysis and has not been considered further.
The maximum PAN loss rate was estimated using Eq. (1) and assuming that all radicals formed are lost.
−d[PAN]
6 5 4 3 2 1 0 R a te c o n s ta n t (s -1)x 1 0 -6 01/7/2004 01/9/2004 01/11/2004 01/1/2005 Date 14 12 10 8 6 4 2 0 P A N L o s s ( p p tv d -1) Photolysis Total Thermal PAN Loss Min PAN Loss A B 35 30 25 20 15 10 5 0 N O x ( p p tv ) 31/12/04 05/01/05 10/01/05 15/01/05 20/01/05 25/01/05 30/01/05 Date 14 12 10 8 6 4 2 0 P A N l o s s ( p p tv d -1) C
Fig. 5. (A) Calculated rate constants for PAN showing thermal
dissociation (solid blue line), photolysis (dashed line) and the to-tal (line and circle). (B) Maximum (black solid) and the minimum (red dashed) PAN loss rates calculated from equations 1 and 2, for the whole measurement period. (C) The same two PAN decompo-sition rates for January 2005 with the measured NOx (pink circles) also shown.
Estimates of the minimum loss rates were made by consider-ing only the proportion of radicals formed by thermal disso-ciation reacting with NO to be lost:
−d[PAN] dt =kD[PAN](1 − α) (2) where α = k4 k5[NO]/[NO2] +k4 (3) The resulting maximum and minimum daily PAN loss rates are shown in Fig. 5b.
During the spring, the calculated production rates are higher than the maximum loss rates indicating that PAN pro-duction is a small net NOx sink during this period. As the season progresses, the loss rates become larger and by Jan-uary, at PAN mixing ratios above about 6 pptv the calculated minimum loss rates are greater than the estimated produc-tion rates and PAN is a net source of NOx. Measured daily mean NOx during January ranged from 6–31 pptv (shown in Fig. 5c with PAN loss rates for January only) while PAN loss rates between 4 and 14 pptv (minimum and maximum re-spectively) are calculated during the elevated PAN episodes. Thus PAN can be an important gas-phase source of NOx in Antarctica during the summer.
The low calculated production rates at Halley suggest that the episodes of high PAN are unlikely to have been formed locally and that the PAN has been formed elsewhere and transported to Halley (or formed in transit over a period of many days). It is, however, impossible to rule out local, spo-radic sources of PAN or its precursors as a cause of these episodes.
The source regions of PAN are however impossible to de-termine. The PAN mixing ratio does not show any relation-ship to the type of back trajectory in any period of the year nor do the short – term variations correspond to changes in either ozone or CO, which is different to the pattern seen in the Arctic (Beine and Krognes, 2000) where PAN and ozone are co-transported from mid latitudes. Other common tracers such as acetylene/CO ratios are uninformative since throughout the early part of the campaign the ratio decreases smoothly with season with no significant deviations and dur-ing late sprdur-ing and summer acetylene, like several of the hy-drocarbons is often below detection limit.
The absence of large deviations from the smooth seasonal change in CO suggests that the air sampled at Halley was well mixed, aged air with background levels of CO and that transport of polluted air is a rare event.
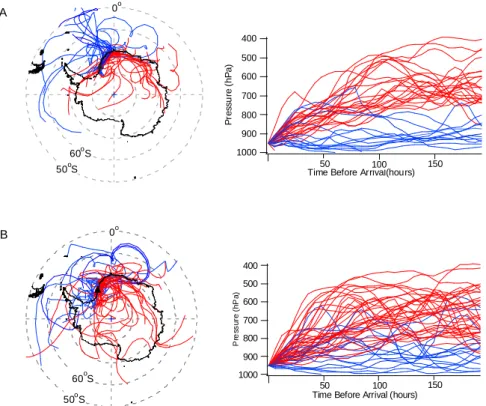
The absence of any clear relationship between recent air-mass history and PAN is evident from Fig. 6, where Fig. 6a shows 8-day back trajectories for days when the daily mean PAN mixing ratio was greater than 140% of the monthly mean level, and Fig. 6b shows trajectories for days when PAN was less than 60% of the monthly mean. The data show that trajectories that originate over the sea are typically low level and those from the continent, by necessity are higher, but that there is no obvious difference between the patterns of the trajectories for high and low PAN, nor any significant difference between mean PAN mixing ratios measured in ma-rine or continental trajectories. The data are taken from the entire measurement period, but there is still no obvious rela-tionship between trajectory type and PAN even when viewed on a monthly or seasonal basis.
This lack of a relationship between the apparent recent air-mass history and PAN mixing ratio is not entirely surpris-ing since under high latitude conditions the lifetime of PAN can be much longer than the calculable length of a trajectory, even in summer, and the PAN lifetime itself is extremely sen-sitive to differences in temperature during transport.
While the PAN shows no relationship with back-trajectories, there is, for a notable proportion of the data, a clear qualitative relationship with the alkenes (mostly ethene and some propene). Figure 7 shows timeseries for PAN and the alkenes for such a period.
Ethene has an OH dependent lifetime of about 15 days under typical high latitude winter conditions and the ratio of ethene to propene is consistent with an oceanic origin of these species, though emissions from snowpack cannot be exclude as a possibility (Read et al., 2007). The clear rela-tionship between PAN and alkenes suggests that the alkenes
A 0o 50oS 60oS 1000 900 800 700 600 500 400 P re ss u re ( h P a )
Time Before Arrival(hours)50 100 150
B 0o 50oS 60oS 1000 900 800 700 600 500 400 P re ss u re ( h P a )
Time Before Arrival (hours) 50 100 150
Fig. 6. Horizontal and vertical components of 8-day back trajectories (calculated using the BADC trajectory server with ECMWF analyses)
for the whole measurement period where PAN mixing ratio was (A) above 140% of the monthly mean, and (B) below 60% of the monthly mean. Halley is marked by a black triangle. Blue traces show trajectories that have spent time at low levels whilst red trajectories are from higher altitudes.
and precursors of PAN share a common source and that much of the variation in PAN is caused by differing influence of oceanic emissions on the air arriving at Halley. Because of the different principal loss processes for PAN and alkenes, differences in temperature, time since emission and NO/NO2
ratios will all affect the PAN/alkene ratio observed at Halley. There is again no clear relationship between back trajectory and the PAN-alkene relationship. As for the alkenes, a vari-able and sporadic snowpack source of either PAN or its pre-cursors cannot be ruled out. On only one occasion is it possi-ble to identify the potential source region. Between 25 and 30 January 2005, PAN increased and then decreased along with CO and alkenes with maxima occurring on 27 and 28 Jan-uary. During this period, 8-day back trajectories suggest that the airmass arrived at Halley from the South Atlantic marine boundary layer (MBL) near the Falkland Islands, whist on the 26th and 30th, the air was descending from high altitudes above the Antarctic continent. Even in this period an ozone increase was not observed and during this period, there was no change in NOx, nor the sum of C2-C5alkanes. This
tra-jectory was the furthest north in the summer, but apart from this, does not stand out as unique when compared to the rest of the data 30 25 20 15 10 5 0 P A N ( p p tv ) 23/08/2004 25/08/2004 27/08/2004 29/08/2004 31/08/2004 02/09/2004 04/09/2004 Date 200 150 100 50 0 A lk e n e s ( p p tv )
Fig. 7. Timeseries of PAN and 6C2-C5alkenes showing very sim-ilar patterns of variation for both species. This is one example of several such periods throughout the measurement period.
The PAN mixing ratios we observe are not incompatible with those of the surrounding region, with the July mean value at Halley being very similar to the few observations made in Punta Arenas, Chile, during June (Rudolph et al., 1987) and the South Atlantic measurements in late summer (Jacobi and Schrems, 2000) fit well with our higher obser-vations. Mid-tropospheric air in remote regions (the Pa-cific being the most widely studied) has been observed to
often contain higher levels of PAN than the boundary layer (Roberts et al., 2004; Kotchenruther et al., 2001) though in these studies there was greater variation in mixing ratios at a given altitude than between different altitudes. Thus mid-tropospheric air transported to Antarctica could also often contain high levels of PAN.
4 Conclusions
The instrument as used at Halley worked well with detection limits as low as 0.6 pptv achieved in the field. The system was also reliable for the 7 months of its active deployment thus allowing good data coverage within this period. The main limitations of the instrument are the frequency of sam-pling and the variations in the precision and sensitivity of the instrument in the Antarctic. An increase in trap size, using a packed trap with a much larger surface area, and an im-provement in temperature control should help with the latter issues.
The measurements made in this study show that there is a possible seasonal cycle in PAN which is different to those typically observed in the Arctic and the absolute levels of PAN are much lower than observed in the Arctic during the equivalent season. Although the data presented here are not a complete annual cycle, the cycle appears to peak in winter, but the obvious relationship with alkenes (which are highest in autumn/early winter) means that an autumn maximum can not be ruled out.
In summer, the decomposition of PAN can be an important source of NOx in the Antarctic, whilst at other times of the year PAN decomposition is negligible.
Acknowledgements. We would like to thank UFAM (Universities’
Facility for Atmospheric Measurement of the National Centre for Atmospheric Science (UK)) for the use of the PAN instrument and A. Jones for the use of the ozone data. Finally we would like to thank the technical and logistical staff at BAS and in particular those at Halley without whose help this work would not have been possi-ble.
This work was funded by The Natural Environment Research Council under the Antarctic Funding Initiative, grant number NER/G/S/2001/00550.
Edited by: J. Lee
References
Atkinson, R., Baulch, D. L., Cox, R. A., Crowley, J. N., Hamp-son, R. F., Hynes, R. G., Jenkin, M. E., Rossi, M. J., and Troe, J.: Evaluated kinetic and photochemical data for atmospheric chem-istry: Part 1 – gas phase reactions of Ox, HOx, NOx and SOx species, Atmos. Chem. Phys., 4, 1461–1738, 2004
Atkinson, R., Baulch, D. L., Cox, R. A., Crowley, J. N., Hamp-son, R. F., Hynes, R. G., Jenkin, M. E., Rossi, M. J., and Troe, J.
Evaluated kinetic and photochemical data for atmospheric chem-istry: Volume II – gas phase reactions of organic species, Atmos. Chem. Phys., 6, 3625–4055, 2006
Barker, J. R., Benson, S. W., Mendenhall, G. D., and Goldern, D. M.: Measurement of rate constants of importance in smog, Rep. PB-274530, Natl. Tech. Inf. Serv., Springfield, Va., 1977. Beine, H. J. and Krognes, T.: The seasonal cycle of peroxyacetyl
nitrate (PAN) in the European Arctic, Atmos. Environ., 34, 933– 940, 2000.
Bloss, W., Lee, J., Heard, D., Salmon, R., Bauguitte, S., Roscoe, H.,
and Jones, A.: Observations of OH and HO2radicals in coastal
Antarctica, Atmos. Chem. Phys., 7, 4171–4185, 2007
Bottenheim, J. W. and Gallant, A. J.: PAN over the Arctic; Ob-servations during AGASP-2 in april 1986, J. Atmos. Chem., 9 , 301–316, 1989
Bridier, I., Caralp, F., Loirat, H., Lesclaux, R. Veyret, B., Becker, K. H., Reimer, A., and Zabel, F.: Kinetic and theoretical studies of
the reactions CH3C(O)O2+ NO2+M = CH3C(O)O2NO2+ M
between 248 and 393 K and between 30 and 760 Torr., J. Phys. Chem., 95, 3594, 1991.
Brough, N., Reeves, C. E., Penkett, S. A., Dewey, K., Kent, J., Bar-jat, H., Monks, P. S., Ziereis, H., Stock, P., Huntrieser, H., and Schlager, H.: Intercomparison of aircraft instruments on board the C-130 and Falcon 20 over southern Germany during EX-PORT 2000, Atmos. Chem. Phys., 3, 2127–2138, 2003, http://www.atmos-chem-phys.net/3/2127/2003/.
Crutzen, P. J.: The role of NO and NO2 in the chemistry of the
troposphere and the stratosphere, Ann. Rev. Earth Planet. Sci., 7, 443–472, 1979.
Dassau, T. M., Shepson, P. B., Bottenheim, J. W., and Ford, K. M.: Peroxyacetyl nitrate photochemistry and interactions with the arctic surface, J. Geophys. Res., 109, D18302, doi:10.1029/2004JD004562, 2004.
Flocke, F. M., Weinheimer, A. J., Swanson, A. L., Roberts, J. M., Schmitt, R., and Shertz, S.: On the measurement of PANs by Gas Chromatography and Electron Capture Detection., J. Atm. Chem 52, 19–43, 2005.
Gaffney, J. S., Marley, N. A., Cunningham, M. M., and Doskey, P. V.: Measurements of peroxyacyl nitrates (PANS) in Mexico City: Implications for megacity air quality impacts on regional scales, Atmos. Environ., 33(30), 5003–5012, 1999.
Gallagher, M. S., Carsey, T. P., and Farmer, M. L.: Peroxyacetyl nitrate in the North Atlantic marine boundary layer, Global Bio-geochem. Cycles, 4(3), 297–308, 1990.
Hudman, R. C., Jacob, D. J., Cooper, O. R., Evans, M. J., Heald, C. L., Park, R. J., Fehsenfeld, F., Flocke, F., Holloway, J., Hubler, G., Kita, K., Koike, M., Kondo, Y., Neuman, A., Nowak, J., Olt-mans, S., Parrish, D., Roberts, J. M., and Ryerson, T.: Ozone pro-duction in transpacific Asian pollution plumes and implications for ozone air quality in California, J. Geophys. Res., 109(23), 1–14, 2004.
Jacobi, H.-W. and Schrems, O.: Peroxyacetyl nitrate (PAN) dis-tribution over the South Atlantic ocean., Phys. Chem. Chem. Phys.1, 5517–5521, 1999.
Jacobi, H.-W., Weller, R., Jones, A. E., Anderson, P. S., and Schrems, O.: Peroxyacetyl nitrate (PAN) concentrations in the Antarctic troposphere measured during the photochemical ex-periment at Neumayer (PEAN’99), Atmos. Environ., 34, 5235– 5247, 2000.
Jones, A. E., Weller, R., Minikin, A., Wolff, E. W., Sturges, W. T., McIntyre, H. P., Leonard, S. R., Schrems, O., and Bauguitte, S.: Oxidized nitrogen chemistry and speciation in the Antarc-tic troposphere, J. Geophys. Res. D: Atmos., 104(D17), 21 355– 21 366, 1999.
King, J. C.: Low-level wind profiles at an Antarctic coastal station, Antarctic Science, 1(2), 169–178, 1985.
Kotchenruther, R. A., Jaffe, D. A., Beine, H. J., Anderson, T. L., Bottenheim, J. W., Harris, J. M., Blake, D. R., and Schmitt, R.: Observations of ozone and related species in the northeast Pa-cific during the PHOBEA campaigns, 2, Airborne observations, J. Geophys. Res., 106(D17), 20 507–20 508, 2001.
Leighton, P. A.: Photochemistry of Air Pollution, Elsevier, New York, 1961.
Madronich, S. and Flocke,S.: The role of solar radiation in at-mospheric chemistry, in: Handbook of Environmental Chem-istry, edited by: Boule, P., Springer Verlag, Heidelberg, pp. 1-26, 1988.
Moortgat, G. K., Veyret, B., and Lesclaux, R.: Kinetics of the
re-action of HO2withCH3C(O)O2 in the temperature range 253–
368 K, Chem. Phys. Lett., 160, 443, 1989.
Muller, K. P. and Rudolph, J.: Measurements of peroxyacetylnitrate in the marine boundary layer over the Atlantic, J. Atmos. Chem., 15, 361–367, 1992.
Rappengluck, B., Oyola, P., Olaeta, I., and Fabian, P.: The evolution of photochemical smog in the Metropolitan Area of Santiago de Chile, J. Appl. Meteorol., 39(3), 275–290, 2000.
Read, K. A., Lewis, A. C., Salmon, R. A., Jones, A. E., and Baugui-tte, S.: OH and halogen atom influence on the variability of non-methane hydrocarbons in the Antarctic Boundary Layer, Tellus, 59B, 22–38. 2007.
Renfrew, I. A. and Anderson, P. S.: The surface climatology of an ordinary katabatic wind regime in Coats Land, Antarctica, Tellus, Ser. A: Dyn. Meteorol. Oceanogr., 54(5), 463–484, 2002. Ridley, B. A., Shetter, J. D., Walega, J. G., Madronich, S., Elsworth,
C. M., Grahek, F. E., Fehsenfeld, F. C., Norton, R. B., Parrish, D. D., Huebler, G., Buhr, M., Williams, E. J., Allwine, E. J., and Westberg, H. H.: The behavior of some organic nitrates at Boul-der and Niwot Ridge, Colorado, J. Geophys. Res., 95, 13 949– 13 961, 1990.
Roberts, J. M.: Atmospheric chemistry of organic nitrates, Atmos. Environ., 24A, 243–287, 1990.
Roberts, J. M. and Bertman, S. B.: The thermal decomposition of peroxyacetic nitric anhydride (PAN) and peroxymetacrylic nitric anhydride (MPAN), Int. J. Chem. Kinet., 24, 297–307, 1992. Roberts, J. M., Jobson, B. T., Kuster, W., Goldan, P., Murphy, P.,
Williams, E., Frost, G., Riemer, D., Apel, E., Stroud, C., Wiedin-myer, C., and Fehsenfeld, F.: An examination of the chemistry of peroxycarboxylic nitric anhydrides and related volatile organic compounds during Texas Air Quality Study 2000 using ground-based measurements, J. Geophys. Res., 108(16), ACH 4-1–ACH 4-12, 2003.
Roberts, J. M., Flocke, F., Chen, G., de Gouw, J., Holloway, J. S., Hubler, G., Neuman, J. A., Nicks, D. K., Nowak, J. B., Parrish, D. D., Ryerson, T. B, Sueper, D. T., Warneke, C., Fehsenfeld, F. C.: Measurement of peroxycarboxylic nitric anhydrides (PANs) during the ITCT 2K2 aircraft intensive experiment, J. Geophys. Res., 109, D23S21, doi:10.1029/2004JD004960, 2004
Rudolph, J., Vierkorn-Rudplph, B., and Meixner, F. X.: Large-scale distribution of peroxyacetylnitrate results from the STRATOZ III flights, J. Geophys. Res., 92, 6653–6661, 1987.
Staudt, A. C., Jacob, D. J., Ravetta, F., Logan, J. A., Bachiochi, D., Sandholm, S., Ridley, B., Singh, H. B., and Talbot, B.: Sources and chemistry of nitrogen oxides over the tropical Pacific., J. Geophys. Res., 108(2),PEM 11-1–PEM 11-17, 2003.
Singh, H. B. and Hanst, P. L.: Peroxyacetyl nitrate (PAN) in the un-polluted atmosphere: an important reservoir for nitrogen oxides, Geophys. Res. Lett., 8, 941–944., 1981.
Sivakumaran, V. and Crowley, J. N.: Reaction between OH and CH3CHO Part 2. Temperature dependent rate coefficients (201– 348 K), Phys. Chem. Chem. Phys., 5, 106–111, 2003
Talukdar, R. K., Burkholder, J. B., Schmoltner, A.-M., Roberts, J. M., Wilson, R. R., and Ravishankara, A. R.: Investigation of the loss processes for peroxyacetyl nitrate in the atmosphere:UV photolysis and reaction with OH, J. Geophys. Res., 100(D7), 14 163–14 173, 1995.
Warneck, P. and Zerbach, T.: Synthesis of peroxyacetyl nitrate in air by acetone photolysis, Environ. Sci. Technol. 26, 74–79, 1992. Villalta, P. W. and Howard, C. J.: Direct kinetic study of the
CH3C(O)O2+ NO reaction using chemical ionisation mass