HAL Id: hal-00301671
https://hal.archives-ouvertes.fr/hal-00301671
Submitted on 28 Jul 2005HAL is a multi-disciplinary open access
archive for the deposit and dissemination of sci-entific research documents, whether they are pub-lished or not. The documents may come from teaching and research institutions in France or abroad, or from public or private research centers.
L’archive ouverte pluridisciplinaire HAL, est destinée au dépôt et à la diffusion de documents scientifiques de niveau recherche, publiés ou non, émanant des établissements d’enseignement et de recherche français ou étrangers, des laboratoires publics ou privés.
Application of positive matrix factorization in
estimating aerosol secondary organic carbon in Hong
Kong and insights into the formation mechanisms
Z. B. Yuan, J. Z. Yu, A. K. H. Lau, P. K. K. Louie, J. C. H. Fung
To cite this version:
Z. B. Yuan, J. Z. Yu, A. K. H. Lau, P. K. K. Louie, J. C. H. Fung. Application of positive matrix factorization in estimating aerosol secondary organic carbon in Hong Kong and insights into the for-mation mechanisms. Atmospheric Chemistry and Physics Discussions, European Geosciences Union, 2005, 5 (4), pp.5299-5324. �hal-00301671�
ACPD
5, 5299–5324, 2005 Aerosol secondary organic carbon in Hong Kong Z. B. Yuan et al. Title Page Abstract Introduction Conclusions References Tables Figures J I J I Back CloseFull Screen / Esc
Print Version Interactive Discussion
EGU
Atmos. Chem. Phys. Discuss., 5, 5299–5324, 2005 www.atmos-chem-phys.org/acpd/5/5299/
SRef-ID: 1680-7375/acpd/2005-5-5299 European Geosciences Union
Atmospheric Chemistry and Physics Discussions
Application of positive matrix
factorization in estimating aerosol
secondary organic carbon in Hong Kong
and insights into the formation
mechanisms
Z. B. Yuan1, J. Z. Yu2, A. K. H. Lau1, P. K. K. Louie4, and J. C. H. Fung3
1
Atmospheric, Marine and Coastal Environment Program, The Hong Kong University of Science and Technology, Clear Water Bay, Hong Kong, China
2
Department of Chemistry, The Hong Kong University of Science and Technology, Clear Water Bay, Hong Kong, China
3
Department of Mathematics, The Hong Kong University of Science and Technology, Clear Water Bay, Hong Kong, China
4
Environmental Protection Department of HKSAR Government, 33/F, Revenue Tower, 5 Gloucester Rd., Wanchai, Hong Kong, China
Received: 19 May 2005 – Accepted: 27 June 2005 – Published: 28 July 2005 Correspondence to: J. Z. Yu (chjianyu@ust.hk)
ACPD
5, 5299–5324, 2005 Aerosol secondary organic carbon in Hong Kong Z. B. Yuan et al. Title Page Abstract Introduction Conclusions References Tables Figures J I J I Back CloseFull Screen / Esc
Print Version Interactive Discussion
EGU Abstract
Secondary organic carbon (SOC) is often a significant portion of organic carbon (OC) in ambient particulate matter (PM). The levels and seasonal patterns of SOC in Hong Kong were examined using more than 2000 PM10measurements made over a 4.5-year period (1998–2002) in a network of ten air quality monitoring stations. The positive
5
matrix factorization (PMF) model was used to analyze this large data set for source identification and apportioning. SOC was subsequently estimated to be the sum of OC present in the secondary sources, i.e., secondary sulfate, secondary nitrate, and secondary organic aerosol. The annual average SOC as estimated by the PMF method was 4.25 µg C/m3while the summer average was 1.66 µg C/m3and the winter average
10
was 7.05 µg C/m3. In comparison, the method that uses EC as a tracer for primary carbonaceous aerosol sources to derive SOC overestimated SOC by 70–212% for the summer samples and by 4–43% for the winter samples. The overestimation by the EC tracer method resulted from the inability of obtaining a single OC/EC ratio that represented a mixture of primary sources varying in time and space.
15
We found that SOC and secondary sulfate had synchronous seasonal variation and were correlated in individual seasons, suggesting common factors that control their formation. Considering the well-established fact that both gas phase oxidation and in-cloud processing are important formation pathways for sulfate, the synchronicity of SOC and sulfate suggests that in-cloud pathways are also important for SOC
forma-20
tion. Additionally, the presence of SOC was found to be enhanced more than that of secondary sulfate in the winter. We postulate this to be a combined result of favorable partitioning of semivolatile SOC species in the particle phase and more abundant SOC precursors in the winter.
ACPD
5, 5299–5324, 2005 Aerosol secondary organic carbon in Hong Kong Z. B. Yuan et al. Title Page Abstract Introduction Conclusions References Tables Figures J I J I Back CloseFull Screen / Esc
Print Version Interactive Discussion
EGU 1. Introduction
Carbonaceous aerosol consists of particulate elemental carbon (EC) and organic car-bon (OC). EC is formed through incomplete combustion of carcar-bonaceous fuels, such as diesel, gasoline, and organic wastes, while OC has two formation pathways, pri-mary and secondary. Pripri-mary OC is directly emitted from combustion sources while
5
secondary organic carbon (SOC) is formed through atmospheric oxidation of reactive organic gases followed by gas-to-particle conversion processes. SOC is often a signif-icant portion of OC. Knowledge of the relative contribution of primary and secondary OC is important in formulating effective control measures for ambient particulate matter (PM). Quantification of SOC is, however, difficult because of our limited understanding
10
of the molecular composition of SOC and because of the presence of a large but un-known number of individual secondary organic products. Indoor and outdoor smog chamber experiments have identified numerous secondary organic compounds from a few major SOC precursors, including aromatic species (e.g., Forstner et al., 1997; Jang and Kamens, 2001), cyclic alkenes (Kalberer et al., 2000), and terpenes (e.g., Yu
15
et al., 1999). To identify individual secondary organic compounds at a particular site in ambient environment is, however, difficult, if not impossible. At present, no direct measurement methods are available for determining SOC in atmospheric particulates. Consequently, indirect methods must be employed for the estimation of relative contri-butions of primary and secondary OC.
20
Three indirect approaches to SOC estimation are found in the literature. In the first approach, EC is adopted as a “tracer” for calculating the abundance of primary OC based on EC being exclusively primary in origin and on EC and OC having common emission sources (e.g., Turpin and Huntzicker, 1995; Castro et al., 1999; Lim and Turpin, 2002). A ratio of OC/EC that is characteristic of primary emissions, called
25
(OC/EC)phereafter, is used to estimate SOC. Ambient OC/EC exceeding the (OC/EC)p ratio is attributed to SOC. In the second approach, chemical transport models are used for calculating secondary organic aerosol yields by simulating formation, removal,
ACPD
5, 5299–5324, 2005 Aerosol secondary organic carbon in Hong Kong Z. B. Yuan et al. Title Page Abstract Introduction Conclusions References Tables Figures J I J I Back CloseFull Screen / Esc
Print Version Interactive Discussion
EGU
and partitioning processes of SOC that are derived from smog chamber studies (e.g., Bowman et al., 1997; Pandis et al., 1992; Strader et al., 1999). In the third approach, an organic tracer-based receptor model, Chemical Mass Balance (CMB), is used to apportion primary OC to a number of perceived sources, and the difference between the measured total OC and the apportioned primary OC from the few known sources is
5
regarded to be SOC (Schauer et al., 1996; Zheng et al., 2002; Na et al., 2004; Sawant et al., 2004).
All three approaches have caveats. In the first approach, the accuracy of SOC es-timates is highly dependent on the accuracy of the (OC/EC)pratio in representing the mixture of multiple local primary PM sources. The (OC/EC)pvalue varies among
com-10
bustion sources. Consequently, it is temporally and spatially unique and influenced by meteorology and diurnal and seasonal fluctuations in emissions. It is not a trivial matter to obtain a representative (OC/EC)p ratio for any given location (Strader et al., 1999; Seinfeld and Pankow, 2003). In practice, the (OC/EC)p ratio is often estimated from ambient measurement data by assuming either that the lowest observed OC/EC value
15
represents the value for primary aerosols or that the average OC/EC value of the sam-ples collected on days of reduced photochemical activity reflects the (OC/EC)pvalue. The (OC/EC)pvalues obtained in such a manner, therefore, tend to be biased toward the primary source(s) with relatively lower (OC/EC)p value and do not represent the average overall emission characteristics of the primary sources. Furthermore, in this
20
method, OC in primary sources with low-EC or non-EC (e.g., cooking fume, biomass burning) is counted as SOC. The collective consequence is that the SOC levels are overestimated to an unknown degree. Nevertheless, because of its simple nature and no need for measurement of other aerosol components, the EC tracer approach has had widespread and continuous applications (e.g., Castro et al., 1999; Lin and Tai,
25
2001; Viidanoja et al., 2002).
The transport modeling approach is inherently limited by our knowledge of SOC for-mation pathways and other atmospheric processes involving SOC. For instance, a few recent studies have indicated that in-cloud processing might be a significant pathway
ACPD
5, 5299–5324, 2005 Aerosol secondary organic carbon in Hong Kong Z. B. Yuan et al. Title Page Abstract Introduction Conclusions References Tables Figures J I J I Back CloseFull Screen / Esc
Print Version Interactive Discussion
EGU
to form SOC (Warneck, 2003; Blando and Turpin, 2000). However, the reaction mech-anisms of in-cloud processes are largely unknown, let alone being represented quan-titatively in models. Large uncertainties also occur in the representation of emission inventories of both gas- and particle-phase species and in the numerical representation of atmospheric dynamics. As a result, SOC estimation by transport models deviates
5
from the actual values also to an unknown degree.
The third approach (i.e., the CMB modeling approach) is also limited by the uncer-tainties in the emission profiles. In addition, it is difficult to ensure that all the PM sources of statistical significance have been included in the model, either because of high cost in establishing emission profiles for the numerous PM sources or because of
10
failure in identifying all the important sources. The SOC thus obtained would also likely be overestimated as a result of mistaking some unidentified sources for SOC.
In this paper, we describe a new approach for estimating SOC by using an advanced receptor model, positive matrix factorization (PMF). PMF modeling of speciated PM10 concentration data is carried out to identify source categories by collectively
consider-15
ing component abundance in the derived source profiles and the corresponding tempo-ral variations in source contributions. SOC is subsequently taken to be the sum of OC in the sources of secondary nature. In comparison with the traditional receptor models such as CMB, PMF does not require any a priori information on the source profiles as input, thus avoiding the uncertainties inherent in the source characterizations and
20
limits imposed by a lack of known source profiles. Using extensive data from air quality monitoring network in Hong Kong, we compare SOC estimates by the PMF method with those by the EC tracer method to highlight the shortcomings of the latter method. Finally, the formation mechanism of SOC is discussed on the basis of its temporal variation and its correlation with secondary sulfate.
ACPD
5, 5299–5324, 2005 Aerosol secondary organic carbon in Hong Kong Z. B. Yuan et al. Title Page Abstract Introduction Conclusions References Tables Figures J I J I Back CloseFull Screen / Esc
Print Version Interactive Discussion
EGU 2. Monitoring sites and sample analysis
The Hong Kong Environment Protection Department (HKEPD) has routinely conducted filter-based 24-h PM10 sampling at ten air quality monitoring stations (AQMSs) on a schedule of once every six days since July 1998. The network of AQMSs that were chosen for filter-based PM10 sampling and subsequent detailed chemical speciation
5
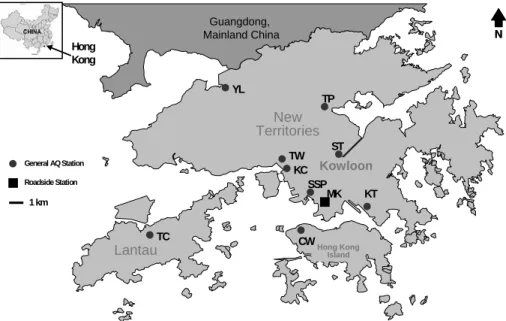
includes a roadside station (MK) and nine general stations (CW, KC, KT, SSP, ST, TC, TP, TW, and YL). The spatial distribution of the ten AQMSs is illustrated in Fig. 1. A detailed description of the site characteristics is presented by Yu et al. (2004). Samples were collected onto 8×10 in quartz fiber filters using high volume PM10 samplers oper-ating at a flow rate of 1.13 m3/min. Twenty-six elements and water-soluble ions (Al, As,
10
Ba, Be, Br−, Ca, Cd, Cl−, Cr, Cu, EC, Fe, Hg, K+, Mg, Mn, Na+, NH+4, Ni, NO−3, OC, Pb, Se, SO2−4 , V and Zn) were determined for the samples. Among them, the ionic species were measured using ion chromatography. As, Hg and Se were measured using a flow injection analysis – atomic absorption technique and all the other elements were measured using inductively coupled plasma atomic emission spectroscopy. EC and
15
OC were analyzed by a thermal/optical transmittance method following the protocol of NIOSH method 5040 (Sin et al., 2002). The PM10analyses were subjected to strict in-house quality assurance/quality control (QA/QC) procedures described in the report by the HKEPD (2002). Typically, the control limits for the PM10measurements were ±10% for both accuracy and precision. A speciated data set of 2199 samples spanning from
20
July 1998 to December 2002 was used in this study to examine the abundance and seasonal patterns of SOC.
ACPD
5, 5299–5324, 2005 Aerosol secondary organic carbon in Hong Kong Z. B. Yuan et al. Title Page Abstract Introduction Conclusions References Tables Figures J I J I Back CloseFull Screen / Esc
Print Version Interactive Discussion
EGU 3. SOC estimation
3.1. EC tracer method
For comparison purposes, we also estimated SOC by the EC tracer method. In this method, SOC is calculated as follows:
SOC=OC−EC(OC/EC)p. (1)
5
The relative contributions of various aerosol sources were expected to be season-dependent. Consequently, the representative (OC/EC)pis also season-dependent. For this reason, season-specific (OC/EC)p values were approximated using samples that had the lowest 5% measured (OC/EC) values in a given season. In accord with the subtropical climate in Hong Kong, the seasons were defined as follows: spring from
10
16 March to 15 May; summer from 16 May to 15 September; fall from 16 September to 15 November and winter from 16 November to 15 March of the next year (Chin, 1986). Spring and fall are two short and transient seasons, lasting approximately two months. A least-square regression of the OC and EC data in the lowest 5% of OC/EC ratio yielded a slope of 0.73 (r2=0.99, n=17), 0.41 (r2=0.90, n=39), 0.70 (r2=0.92,
15
n=20), and 0.88 (r2=0.92, n=34), for spring, summer, fall, and winter measurements,
respectively (Fig. 2).
3.2. The PMF source apportionment method
Receptor models estimate the amount of pollutants contributed by different sources through statistical interpretation of ambient observation data and reasonably imposed
20
constraints. A detailed explanation of the working principle of PMF can be found in the PMF user’s guide (Paatero, 2000). Our PMF analysis of the 4.5-year dataset identified nine significant aerosol sources, comprising vehicle exhaust, residual oil, fresh sea salt, aged sea salt, crustal soil, regional combustion sources (e.g., biomass burning), sec-ondary sulfate, secsec-ondary nitrate, and secsec-ondary organic aerosol (SOA). The source
ACPD
5, 5299–5324, 2005 Aerosol secondary organic carbon in Hong Kong Z. B. Yuan et al. Title Page Abstract Introduction Conclusions References Tables Figures J I J I Back CloseFull Screen / Esc
Print Version Interactive Discussion
EGU
categories were identified by the explained variations in species in individual appor-tioned sources as well as the temporal and spatial variation of source contributions. The source identification procedure for this data set was described in detail by Yuan et al. (20051, and available athttp://landsea.ust.hk/∼chjianyu/Yu Papers/PMF paper.pdf). Table 1 lists the resolved source categories and their profiles. OC in the three
sec-5
ondary aerosol source categories, i.e., secondary sulfate, secondary nitrate, and sec-ondary organic aerosol, was summed up to represent SOC.
4. Results and discussion
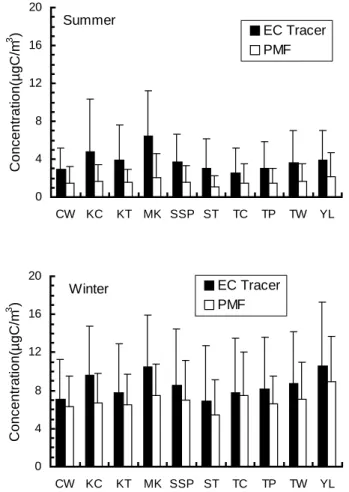
4.1. Comparison of SOC derived from the EC tracer method and the PMF method The two plots in Fig. 3 compare the average SOC levels estimated by the two methods
10
at individual AQMSs in the summer and in the winter, respectively. Due to the short and transient nature of spring and fall in Hong Kong, our discussion of SOC abundance and seasonality is focused on the summer and winter. Figure 3 clearly shows that the EC tracer method consistently gave higher SOC values, in line with the previous discussion that the EC tracer method tends to overestimate the SOC level because of the inherent
15
deviations from the actual (OC/EC)p.
The shortcomings of the EC tracer method can be seen in the spatial pattern of the deviation between the two sets of SOC estimates. The smallest difference of the two sets of SOC estimates occurred at TC (1.14 µg/m3 in summer and 0.26 µg/m3 in winter), a developing residential area with a smaller number of aerosol emission
20
sources in comparison with other AQMSs. The two largest differences occurred at MK (4.72 µg/m3 in summer and 2.95 µg/m3 in winter), an urban roadside station, and KC (3.50 µg/m3 in summer and 2.83 µg/m3 in winter), a station in an industrialized area
1
Yuan, Z. B., Lau, A. K. H., Zhang, H. Y., Yu, J. Z., Louie, P. K. K., and Fung, J. C. H.: Iden-tification and spatial-temporal variations of dominant PM10 sources over Hong Kong, Atmos. Environ., in review, 2005.
ACPD
5, 5299–5324, 2005 Aerosol secondary organic carbon in Hong Kong Z. B. Yuan et al. Title Page Abstract Introduction Conclusions References Tables Figures J I J I Back CloseFull Screen / Esc
Print Version Interactive Discussion
EGU
close to the city’s container terminal. In both locations, the primary sources of car-bonaceous aerosols were intensive and diversified, and their intensities were highly time dependent. Such a spatial pattern in the difference between the two sets of SOC estimates could be attributed to the biased (OC/EC)p derived from EC and OC mea-surements of the lowest 5% OC/EC values. This bias was more prominent at locations
5
with a larger number of significant sources that had diverse (OC/EC)pratios. In a more strict approach, station-specific (OC/EC)p should be derived considering the distinct local characteristics of the PM sources among individual AQMSs, instead of lumping together measurements from different stations and then implementing a uniform value of (OC/EC)p. However, the number of measurements at individual stations is not large
10
enough to support this approach.
Next we examine the seasonal pattern in the differences of the two sets of SOC estimates. In the summer, the difference among the ten AQMSs ranged from 1.1 to 4.3 µg C/m3, whereas in the winter, the difference was smaller, ranging from 0.3 to 2.9 µg C/m3. In our study, the derived summer (OC/EC)p was 0.41, significantly
15
smaller than reported (OC/EC)p values in the literature, which range from 0.74 in the urban area of Nagoya, Japan (Kadowaki, 1990) to 2.4 in Pittsburgh, PA, U.S. (Cabada et al., 2002). This derived (OC/EC)p value of 0.41 is at the lower end of the range of (OC/EC)p measurements for sources aerosols emitted from combustion of heavy-duty diesel vehicles. Gillies and Gertler (2000) evaluated four databases of source
20
profiles in the U.S. and concluded that diesel vehicle exhausts had average OC/EC ratios ranging from 0.28 to 0.92. Diesel-fueled vehicles account for 25% of registered vehicles in Hong Kong, and the most-traveled vehicles such as public buses account for the majority of diesel-fueled vehicles (HKTD, 2002). In addition, the ships at the container ports mainly burn residual oil. The summer (OC/EC)pestimate is most likely
25
biased towards diesel and residual oil combustion aerosols, which typically have lower (OC/EC)pthan other combustion aerosols. This would at least be partially responsible for the significant overestimation of summer SOC by the EC tracer method.
ACPD
5, 5299–5324, 2005 Aerosol secondary organic carbon in Hong Kong Z. B. Yuan et al. Title Page Abstract Introduction Conclusions References Tables Figures J I J I Back CloseFull Screen / Esc
Print Version Interactive Discussion
EGU
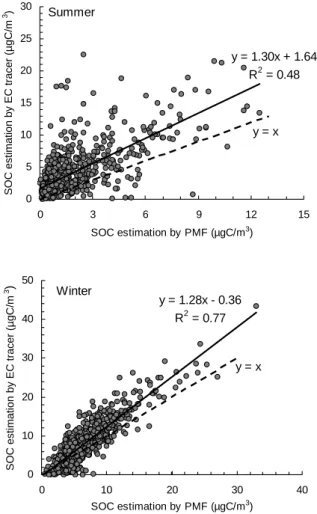
is counting non-EC associated OC as SOC. This is revealed in Fig. 4, which plots the SOC estimates by the EC method versus those by the PMF method in the summer and in the winter. The slopes of both the summer and the winter regression lines are larger than 1, confirming the overestimate of SOC by the EC tracer method. The summer plot has a large intercept (1.64), whereas the winter plot has a near-zero intercept (−0.36).
5
The intercept values reflect that the portion of primary OC (e.g., biogenic OC) with no associated EC was more prominent in the summer than in the winter. A larger presence of biogenic OC in the summer PM2.5in Hong Kong was reported by Zheng et al. (2000) using Carbon Preference Index (CPI) for n-alkanes, n-fatty acids, and n-alkanols.
An additional observation is that the summer plot is more scattered (r2=0.48,
10
n=785), in comparison with the winter plot (r2=0.77, n=687) (Fig. 4). The more
scat-tered summer data could be explained if the significant primary sources in the summer were more diverse in (OC/EC)p. The EC tracer method was hardly able to capture the real and varied (OC/EC)p by using the lowest 5% standard or any other single-value standards.
15
In summary, the diversity of (OC/EC)p among significant primary sources and the presence of primary OC sources without EC pose significant limitations in the use of the EC tracer method for estimating SOC. In comparison, PMF identifies the profile for each source or a group of sources with similar characteristics and calculates the source impact for each sample. That is, the PMF method does not make the unrealistic
20
assumption of a uniform (OC/EC)pon different sampling dates in the same season. We therefore believe that the PMF method yields estimates closer to the true SOC values. For this reason, the PMF-derived SOC results are used in the ensuing discussion. The limitation to the PMF approach is that a large speciated PM data set is a prerequisite to enable source apportioning. Obtaining such a level of comprehensive measurement
25
data requires a PM monitoring network running routinely for an extended period of time (e.g., a year) and analytical capabilities for various aerosol constituents.
ACPD
5, 5299–5324, 2005 Aerosol secondary organic carbon in Hong Kong Z. B. Yuan et al. Title Page Abstract Introduction Conclusions References Tables Figures J I J I Back CloseFull Screen / Esc
Print Version Interactive Discussion
EGU
4.2. Abundance and seasonality of SOC
The average SOC level over the 4.5-year period for Hong Kong was 4.25 µg C/m3, contributing 46% of the aerosol OC loadings in the air. On a material mass basis, the secondary organic aerosol contributed 13% of PM10 mass, if we use a multiplier of 1.6 to convert SOC to SOA mass (Turpin and Lim, 2001). This implies the importance of
5
identifying SOC precursors for effective reduction of aerosol loadings.
The SOC levels showed a clear seasonal pattern of being higher in the winter and lower in the summer (Fig. 3). The winter average SOC was 7.05 µg C/m3, nearly four times the summer average of 1.66 µg C/m3. In comparison, primary OC had a winter average of 6.17 µg C/m3, 1.6 times the summer average of 3.72 µg C/m3. Apparently,
10
SOC increased more than the primary OC in the winter. As a result, the relative contri-bution of SOC to OC was higher by 70% in the winter than in the summer.
The seasonal pattern for SOC in Hong Kong was in contrast to that reported in many other locations in the world, where typically higher SOC was observed during the summer by virtue of more conducive conditions (e.g., clear skies and low winds)
15
and enhanced photochemical activities. The locations where higher SOC was reported in the summer than in the winter include Birmingham in England (Castro et al., 1999), Pittsburgh, PA (Cabada et al., 2002), Southern California (Strader et al., 1999; Turpin and Huntzicker, 1995; Chu and Macias, 1981), and St. Louis, MO (Chu and Macias, 1981) in the U.S. The unusual seasonal pattern of SOC in Hong Kong can be explained
20
by the meteorological conditions unique to Hong Kong. During the summer in Hong Kong, frequent rainfall effectively removes aged aerosols. Located in the subtropical region, Hong Kong has abundant sunlight and mild ambient temperatures (15–21◦C) even during the winter. Similar to Hong Kong, two southern European towns, Oporto and Coimbra in Portugal, where sunny winter days are frequent, also had higher SOC
25
ACPD
5, 5299–5324, 2005 Aerosol secondary organic carbon in Hong Kong Z. B. Yuan et al. Title Page Abstract Introduction Conclusions References Tables Figures J I J I Back CloseFull Screen / Esc
Print Version Interactive Discussion
EGU
4.3. Relationship between SOC and secondary sulfate
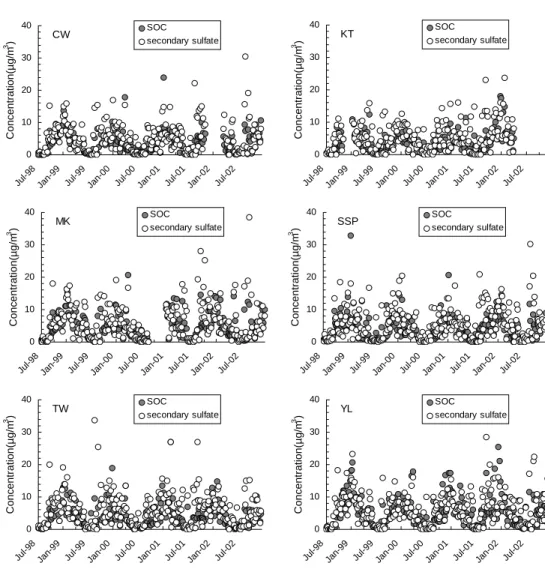
Our PMF analysis has also identified secondary sulfate as a source category. Figure 5 overlays the temporal variation of secondary sulfate with that of SOC at six AQMSs with the least uninterrupted monitoring data. At all the monitoring stations, includ-ing the roadside station, the seasonal variations of secondary sulfate and SOC were
5
synchronous. Both exhibited higher concentrations in the winter than in the summer. Figure 6 plots secondary sulfate versus SOC for the summer and the winter samples. The two species were well correlated in individual seasons, with r2values of 0.76 and 0.46 for the summer and the winter samples, respectively. The close tracking of the two suggests that a same set of conditions predominantly affect the abundance of the two
10
species. It is well established that both gas-phase and in-cloud oxidation contribute to the formation of sulfate (Seinfeld and Pandis, 1998). It is also increasingly recognized that SOC can be formed in in-cloud oxidation processes in addition to through gas phase oxidation processes (Warneck, 2003; Blando and Turpin, 2000; Yu et al., 2005). However, the reaction pathways, mechanisms, and the corresponding thermodynamic
15
coefficients for SOC formation through in-cloud processing remain largely unknown. An additional observation is that the summer samples are more concentrated in the upper part of the figure, while most of the winter samples are located in the lower part. This is reflected in the slope values (2.19 for the summer samples versus 0.72 for the winter samples) of the sulfate-versus-SOC regression lines (Fig. 6). In other words,
20
the presence of SOC was enhanced more than that of secondary sulfate in the winter. The winter average secondary sulfate concentration was 7.72 µg/m3, about 2.5 times the summer average concentration of 3.20 µg/m3. In comparison, the winter SOC enhancement over the summer SOC was more than 4 fold (7.05 versus 1.66 µg C/m3). We now suggest the underlying reasons for the seasonal differences in the relative
25
ACPD
5, 5299–5324, 2005 Aerosol secondary organic carbon in Hong Kong Z. B. Yuan et al. Title Page Abstract Introduction Conclusions References Tables Figures J I J I Back CloseFull Screen / Esc
Print Version Interactive Discussion
EGU
production ratio can be expressed by the following equation:
PSS PSOC =
kSS[Ox] [SO2]
αkSOC[Ox] [X], (2)
where kSS and kSOC are the “conceptual” rate constants for reactions leading to the formation of secondary sulfate and SOC, respectively; [SO2] and [X] are the concen-trations of SO2 and SOC precursors; [Ox] is the concentration of oxidants responsible
5
for the oxidation of SO2and X. Regardless of the nature of the formation pathways, ei-ther in the gas phase or in cloud, the SOC species undergoes gas-particle partitioning at the end. α is included in the equation to represent the mass fraction of the condens-able secondary organic species that partition into the aerosol phase. Conceivably, α is an inverse function of temperature. This has been demonstrated in a number of
10
studies using smog chamber simulation or absorptive-partitioning models. For exam-ple, Takekawa et al. (2003) observed in their smog chamber experiments that the SOA yield at 283 K was approximately twice that at 303 K. In a modeling study, Sheehan and Bowman (2001) estimated that a 10◦C decrease in temperature would lead to an increase of SOA yields by 20–150%, depending on the vaporization enthalpy. Hong
15
Kong has a moderate and humid climate with a typical average daily temperature of ∼30◦C in the summer and 15◦C in the winter. A significantly higher α value is an-ticipated in the winter than in the summer. On the other hand, sulfuric acid (H2SO4) has an extremely low vapor pressure and, consequently, sulfate resides in the aerosol phase once it is formed at the ambient temperature encountered either in the summer
20
or in the winter. That is, the fraction of sulfate residing in the aerosol phase equals to one and is little influenced by the ambient temperature. The temperature affects the rate constants, kSS and kSOC, in the same direction; however, it is difficult to estimate the seasonal change in their relative magnitudes.
If we use the concentration of total non-methane hydrocarbon (TNMHC) as a rough
25
indicator for the abundance of SOC precursors, the available hydrocarbon measure-ments in one annual cycle (August 2002–July 2003) indicate that the SOC precursors were more abundant in the winter months (Fig. 7). In comparison, SO2concentrations
ACPD
5, 5299–5324, 2005 Aerosol secondary organic carbon in Hong Kong Z. B. Yuan et al. Title Page Abstract Introduction Conclusions References Tables Figures J I J I Back CloseFull Screen / Esc
Print Version Interactive Discussion
EGU
peaked in August, presumably linked to higher demands for energy for air conditioners (Fig. 7). In summary, the observation that the presence of SOC was enhanced more than that of sulfate in the winter is most likely a combined result of the temperature-induced favorable partitioning of SOC into the aerosol phase and more abundant SOC precursors.
5
5. Conclusions
A SOC estimation method using PMF for source apportioning was introduced in this paper. In PMF, OC apportioned in three secondary sources was summed to be SOC. The SOC estimates were compared with those obtained using the EC tracer method for a large dataset collected at ten AQMSs in Hong Kong from 1998 to 2002. The SOC
10
estimates by the EC tracer method were consistently higher than those determined by the PMF method. The difference in SOC estimates by the two methods ranged from 1.1–4.3 µg C/m3 (70–212%) in the summer and 0.3–2.9 µg C/m3 (4–43%) in the winter. The comparison between the two sets of SOC estimates exposes the inherent shortcomings in the EC tracer method. The average SOC level estimated using PMF
15
was 4.25 µg C/m3, contributing nearly half of the carbonaceous aerosols in Hong Kong. The percentage contribution of SOC to OC was 46% on an annual average basis and 38% and 52% in the summer and in the winter, respectively. On a material mass basis, the secondary organic aerosol contributed 13% of PM10 mass. Seasonally, this percentage contribution was 7% in the summer months and 16% in the winter months.
20
This implies the importance of identifying SOC precursors for effective reduction of aerosol loadings.
SOC also showed a clear seasonal variation, with higher loading in the winter than in the summer. The winter average (7.05 µg C/m3) was approximately four times the summer average (1.66 µg C/m3). This seasonal pattern was similar to the variation of
25
secondary sulfate concentrations. The two species correlated well in individual sea-sons, indicating common factors that control their formation. It has been established
ACPD
5, 5299–5324, 2005 Aerosol secondary organic carbon in Hong Kong Z. B. Yuan et al. Title Page Abstract Introduction Conclusions References Tables Figures J I J I Back CloseFull Screen / Esc
Print Version Interactive Discussion
EGU
that sulfate has two major formation pathways, gas-phase oxidation by OH radicals and in-cloud oxidation processes. The close tracking of sulfate and SOC appears to sug-gest that the in-cloud pathway is also important for SOC formation. The slope of the sulfate-versus-SOC regression line, an indicator of the relative abundance of the two, for the summer samples was three times that for the winter samples. This is most likely
5
a combined result of temperature-induced less favorable partitioning of semivolatile secondary organics in the particle phase and the lower abundance of SOC precursors in the summer.
Acknowledgements. The work was partially supported by the Research Grants Council of Hong Kong, China (602103). The authors thank the HKEPD for provision of the data sets
10
and permission for publication.
References
Blando, J. D. and Turpin, B. J.: Secondary organic aerosol formation in cloud and fog droplets: a literature evaluation of plausibility, Atmos. Environ., 34, 1623–1632, 2000.
Bowman, F. M., Odum, J. R., and Seinfeld, J. H.: Mathematical model for gas-particle
partition-15
ing of secondary organic aerosols, Atmos. Environ., 31, 3921–3931, 1997.
Cabada, J. C., Pandis, S. N., and Robinson, A. L.: Sources of atmospheric carbonaceous particulate matter in Pittsburgh, Pennsylvania, J. Air & Waste Manage. Assoc., 52, 732–741, 2002.
Castro, L. M., Pio, C. A., Harrison, R. M., and Smith, D. J. T.: Carbonaceous aerosol in urban
20
and rural European atmospheres: estimation of secondary organic carbon concentrations, Atmos. Environ., 33, 2771–2781, 1999.
Colman, J. J., Swanson, A. L., Meinardi, S., Sive, B. C., Blake, D. R., and Rowland, F. R.: De-scription of the analysis of a wide range of volatile organic compounds in whole air samples collected during PEM-Tropics A and B; Anal. Chem., 73, 3723–3731, 2001.
25
Chin, P. C.: Climate and weather, in: A Geography of Hong Kong, edited by: Chiu, T. N. and So, C. L., Oxford University Press, New York, pp. 69–85, 1986.
Atmo-ACPD
5, 5299–5324, 2005 Aerosol secondary organic carbon in Hong Kong Z. B. Yuan et al. Title Page Abstract Introduction Conclusions References Tables Figures J I J I Back CloseFull Screen / Esc
Print Version Interactive Discussion
EGU
spheric aerosol: source / air quality relationship, edited by: Macias, E. S. and Hopke, P. K., ACS Sympoisum Series 167, American Chemical Society, Washington DC, 1981.
Crahan, K. K., Hegg, D., Covert, D. S., and Jonsson, H.: An exploration of aqueous oxalic acid production in the coastal marine atmosphere, Atmos. Environ., 38, 3757–3764, 2004. Gillies, J. A. and Gertler, A. W.: Comparison and evaluation of chemically speciated mobile
5
source PM2.5 particulate matter profiles. J. Air & Waste Manage. Assoc., 50, 1459–1480, 2000.
Forstner, H. J. L., Flagan, R. C., and Seinfeld, J. H.: Secondary organic aerosol from the photooxidation of aromatic hydrocarbons: molecular composition, Environ. Sci. Technol., 31, 1345–1358, 1997.
10
HKEPD (Hong Kong Environment Protection Department): Air services group, Air qual-ity in Hong Kong 2002, (http://www.epd.gov.hk/epd/english/environmentinhk/air/air quality/
aq annualrpt.html).
HKTD (Hong Kong Transport Department): Monthly traffic and transport digest, available at:
http://www.info.gov.hk/td/eng/publication/mtnt.htm, 2002.
15
Jang, M. S. and Kamens, R. M.: Characterization of secondary aerosol from the photooxidation of toluene in the presence of NOx and 1-propene, Environ. Sci. Technol., 35, 3626–3639, 2001.
Kadowaki, S.: Characterization of carbonaceous aerosols in the Nagoya urban area. 1. Ele-mental and organic carbon concentrations and the origin of organic aerosols, Environ. Sci.
20
Technol., 24, 741–744, 1990.
Kalberer, M., Yu, J., Cocker, D. R., Flagan, R. C., and Seinfeld, J. H.: Aerosol formation in the cyclohexene-ozone system, Environ. Sci. Technol., 34, 4894–4901, 2000.
Kawamura, K. and Ikushima, K.: Seasonal changes in the distribution of dicarboxylic acids in the urban atmosphere, Environ. Sci. Technol., 27, 2227–2235, 1993.
25
Lim, H. J. and Turpin, B. J.: Origins of primary and secondary organic aerosol in Atlanta: Results of time-resolved measurements during the Atlanta Supersite experiment, Environ. Sci. Technol., 36, 4489–4496, 2002.
Lin, J. J. and Tai, H. S.: Concentrations and distributions of carbonaceous species in ambient particles in Kaohsiung City, Taiwan, Atmos. Environ., 35, 2627–2636, 2001.
30
Na, K. S., Sawant, A. A., Song, C., and Cocker, D. R.: Primary and secondary carbonaceous species in the atmosphere of Western Riverside County, California, Atmos. Environ., 38, 1345–1355, 2004.
ACPD
5, 5299–5324, 2005 Aerosol secondary organic carbon in Hong Kong Z. B. Yuan et al. Title Page Abstract Introduction Conclusions References Tables Figures J I J I Back CloseFull Screen / Esc
Print Version Interactive Discussion
EGU
Paatero, P.: User’s guide for positive matrix factorization programs PMF2 and PMF3, Part 1: tutorial, 2000.
Pandis, S. N., Harley, R. A., Cass, G. R., and Seinfeld, J. H.: Secondary organic aerosol formation and transport, Atmos. Environ., 26A, 2269–2282, 1992.
Sawant, A. A., Na, K. S., Zhu, X. N., and Cocker, D. R.: Chemical characterization of outdoor
5
PM2.5and gas-phase compounds in Mira Loma, California, Atmos. Environ., 38, 5517–5528, 2004.
Schauer, J. J., Rogge, W. F., Hildemann, L. M., Mazurek, M. A., Cass, G. R., and Simoneit, B. R. T.: Source apportionment of airborne particulate matter using organic compounds as tracers, Atmos. Environ., 30, 3837–3855, 1996.
10
Seinfeld, J. H. and Pandis, S. N.: Atmospheric chemistry and physics: from air pollution to climate change, John Wiley and Sons, New York, 1998.
Seinfeld, J. H. and Pankow, J. F.: Organic atmospheric particulate material, Annu. Rev. Phys. Chem., 54, 121–140, 2003.
Sheehan, P. E. and Bowman, F. M.: Estimated effects of temperature on secondary organic
15
aerosol concentrations, Environ. Sci. Technol., 35, 2129–2135, 2001.
Sin, D. W. M., Fung, W. H., and Lam, C. H.: Measurement of carbonaceous aerosols: validation and comparison of a solvent extraction – gas chromatographic method and a thermal optical transmittance method, Analyst, 127, 614–622, 2002.
Strader, R., Lurmann, F., and Pandis, S. N.: Evaluation of secondary organic aerosol formation
20
in winter, Atmos. Environ., 33, 4849–4863, 1999.
Takekawa, H., Minoura, H., and Yamazaki, S.: Temperature dependence of secondary or-ganic aerosol formation by photo-oxidation of hydrocarbons, Atmos. Environ., 37, 3413– 3424, 2003.
Turpin, B. J. and Huntzicker, J. J.: Identification of secondary organic aerosol episodes and
25
quantification of primary and secondary organic aerosol concentrations during SCAQS, At-mos. Environ., 29, 3527–3544, 1995.
Turpin, B. J. and Lim, H. J.: Species contributions to PM2.5mass concentrations: revisiting com-mon assumptions for estimating organic mass, Aerosol Sci. Technol., 35, 602–610, 2001. Viidanoja, J., Sillanpaa, M., Laakia, J., Kerminen, V. M., Hillamo, R., Aarnio, P., and Koskentalo,
30
T.: Organic and black carbon in PM2.5and PM10: 1 year of data from an urban site in Helsinki,
Finland, Atmos. Environ., 36, 3183–3193, 2002.
ACPD
5, 5299–5324, 2005 Aerosol secondary organic carbon in Hong Kong Z. B. Yuan et al. Title Page Abstract Introduction Conclusions References Tables Figures J I J I Back CloseFull Screen / Esc
Print Version Interactive Discussion
EGU
atmosphere, Atmos. Environ. 37, 2423–2427, 2003.
Yu, J. Z., Cocker, D. R., Griffin, R. J., Flagan, R. C., and Seinfeld, J. H.: Gas-phase ozone oxidation of monoterpenes: Gaseous and particulate products, J. Atmos. Chem., 34, 207– 258, 1999.
Yu, J. Z., Huang, X.-F., Xu, J. H., and Hu, M.: When aerosol sulfate goes up, so does oxalate:
5
implication for the formation mechanisms of oxalate, Environ. Sci. Technol., 39, 128–133, 2005.
Yu, J. Z., Tung, J. W. T., Wu, A. W. M., Lau, A. K. H., Louie, P. K. K., and Fung, J. C. H.: Abundance and seasonal characteristics of elemental and organic carbon in Hong Kong PM10, Atmos. Environ., 38, 1511–1521, 2004.
10
Zheng, M., Fang, M., Wang, F., and To, K. L.: Characterization of the solvent extractable organic compounds in PM2.5 aerosols in Hong Kong, Atmos. Environ., 34, 2691–2702, 2000. Zheng, M., Cass, G. R., Schauer, J. J., and Edgerton, E. S.: Source apportionment of PM2.5
in the southeastern United States using solvent-extractable organic compounds as tracers, Environ. Sci. Technol., 36, 2361–2371, 2002.
ACPD
5, 5299–5324, 2005 Aerosol secondary organic carbon in Hong Kong Z. B. Yuan et al. Title Page Abstract Introduction Conclusions References Tables Figures J I J I Back CloseFull Screen / Esc
Print Version Interactive Discussion
EGU
Table 1. Profiles of nine aerosol sources resolved by PMF analysis, values listed here are
mass percentages in each source profile.
species Vehicle Residual Fresh Aged Crustal Secondary Secondary Regional Secondary Exhaust Oil Sea Salt Sea Salt Soil Sulfate Nitrate Combustion Organics
Al 0.00 0.21 0.01 0.00 11.74 0.16 0.00 0.01 0.51 As 0.00 0.00 0.00 0.00 0.00 0.00 0.00 0.00 0.14 Ca 0.87 6.05 0.97 0.33 30.93 0.00 0.19 1.83 1.18 Cd 0.00 0.00 0.00 0.00 0.00 0.00 0.00 0.02 0.03 Cl− 0.03 0.12 53.43 0.03 0.08 0.00 1.55 0.28 0.04 Fe 1.22 0.10 0.00 0.00 15.77 0.39 0.68 0.44 1.67 K+ 0.28 2.73 0.39 2.09 0.02 0.00 0.00 14.22 0.03 Mg 0.00 0.01 3.03 3.02 5.43 0.00 0.00 0.00 0.00 Mn 0.01 0.00 0.01 0.01 0.44 0.01 0.02 0.10 0.08 Na+ 0.02 6.04 25.75 26.90 0.02 0.01 0.01 0.31 0.03 NH4+ 0.00 0.17 0.01 0.01 0.01 15.74 8.68 0.04 0.07 Ni 0.00 1.34 0.00 0.00 0.02 0.00 0.00 0.00 0.00 NO−3 0.04 0.07 0.54 3.74 2.59 0.00 11.80 0.01 0.01 Pb 0.00 0.00 0.00 0.00 0.03 0.04 0.08 0.84 0.92 SO=4 2.36 12.86 0.06 59.43 27.11 61.47 0.05 15.92 10.84 V 0.00 2.80 0.00 0.01 0.00 0.00 0.00 0.02 0.00 EC 40.35 42.11 10.36 4.34 5.34 7.42 2.31 0.23 0.19 OMa 54.81 25.39 5.45 0.09 0.46 14.74 74.63 65.73 84.28 a
OM stands for Organic Matter defined as 1.6 times Organic Carbon (OC) concentrations in this study (Turpin and Lim, 2001).
ACPD
5, 5299–5324, 2005 Aerosol secondary organic carbon in Hong Kong Z. B. Yuan et al. Title Page Abstract Introduction Conclusions References Tables Figures J I J I Back CloseFull Screen / Esc
Print Version Interactive Discussion EGU Guangdong, Mainland China New Territories Kowloon Hong Kong Island Lantau N N Hong Kong MK Roadside Station YL TW CW General AQ Station TP ST KC SSP KT 1 km TC
Fig. 1. Location map of the air quality monitoring stations in Hong Kong that were selected for
filter-based PM10 sampling and subsequent speciation analysis. (The abbreviations are: CW (Central/Western), KC (Kwai Chung), KT (Kwun Tong), MK (Mong Kok), SSP (Sham Shui Po), ST (Shatin), TC (Tung Chung), TP (Tai Po), TW (Tsuen Wan), and YL (Yuen Long).)
ACPD
5, 5299–5324, 2005 Aerosol secondary organic carbon in Hong Kong Z. B. Yuan et al. Title Page Abstract Introduction Conclusions References Tables Figures J I J I Back CloseFull Screen / Esc
Print Version Interactive Discussion
EGU
ACPD
5, 5299–5324, 2005 Aerosol secondary organic carbon in Hong Kong Z. B. Yuan et al. Title Page Abstract Introduction Conclusions References Tables Figures J I J I Back CloseFull Screen / Esc
Print Version Interactive Discussion EGU Summer 0 4 8 12 16 20 CW KC KT MK SSP ST TC TP TW YL Concentration(µgC/m 3 ) EC Tracer PMF Winter 0 4 8 12 16 20 CW KC KT MK SSP ST TC TP TW YL Concentration(µgC/m 3 ) EC Tracer PMF
ACPD
5, 5299–5324, 2005 Aerosol secondary organic carbon in Hong Kong Z. B. Yuan et al. Title Page Abstract Introduction Conclusions References Tables Figures J I J I Back CloseFull Screen / Esc
Print Version Interactive Discussion EGU y = 1.30x + 1.64 R2 = 0.48 0 5 10 15 20 25 30 0 3 6 9 12 15 SOC estimation by PMF (µgC/m3)
SOC estimation by EC tracer (µgC/m
3) y = x Summer y = 1.28x - 0.36 R2 = 0.77 0 10 20 30 40 50 0 10 20 30 40 SOC estimation by PMF (µgC/m3)
SOC estimation by EC tracer (µgC/m
3)
y = x Winter
Fig. 4. Scatter plots between SOC estimates by the EC tracer method and the PMF method
ACPD
5, 5299–5324, 2005 Aerosol secondary organic carbon in Hong Kong Z. B. Yuan et al. Title Page Abstract Introduction Conclusions References Tables Figures J I J I Back CloseFull Screen / Esc
Print Version Interactive Discussion EGU 0 10 20 30 40 Jul-9 8 Ja n-99 Jul-9 9 Ja n-00 Jul-0 0 Ja n-01 Jul-0 1 Ja n-02 Jul-0 2 Concentration(µg/m 3 ) SOC secondary sulfate CW 0 10 20 30 40
Jul-98 Jan-99 Jul-99 Jan-00 Jul-00 Jan-01 Jul-01 Jan-02 Jul-02
Conc entration(µg/m 3 ) SOC secondary sulfate KT 0 10 20 30 40
Jul-98 Jan-99 Jul-99 Jan-00 Jul-00 Jan-01 Jul-01 Jan-02 Jul-02
Conc entration(µg/m 3 ) SOC secondary sulfate MK 0 10 20 30 40
Jul-98 Jan-99 Jul-99 Jan-00 Jul-00 Jan-01 Jul-01 Jan-02 Jul-02
Conc entration(µg/m 3 ) SOC secondary sulfate SSP 0 10 20 30 40
Jul-98 Jan-99 Jul-99 Jan-00 Jul-00 Jan-01 Jul-01 Jan-02 Jul-02
Conc entration(µg/m 3 ) SOC secondary sulfate TW 0 10 20 30 40
Jul-98 Jan-99 Jul-99 Jan-00 Jul-00 Jan-01 Jul-01 Jan-02 Jul-02
Conc entration(µg/m 3 ) SOC secondary sulfate YL
ACPD
5, 5299–5324, 2005 Aerosol secondary organic carbon in Hong Kong Z. B. Yuan et al. Title Page Abstract Introduction Conclusions References Tables Figures J I J I Back CloseFull Screen / Esc
Print Version Interactive Discussion EGU y = 2.19x - 0.42 R2 = 0.76 y = 0.72x + 2.63 R2 = 0.46 0 10 20 30 40 0 10 20 30 40 SOC(µgC/m3) Sec Sulfate(µg/m 3 ) Winter Summer
ACPD
5, 5299–5324, 2005 Aerosol secondary organic carbon in Hong Kong Z. B. Yuan et al. Title Page Abstract Introduction Conclusions References Tables Figures J I J I Back CloseFull Screen / Esc
Print Version Interactive Discussion
EGU
Fig. 7. Monthly average concentrations of SO2 and the total nonmethane hydrocar-bon (TNMHC) at an urban air quality monitoring station (Central/Western) in Hong Kong for the period of August 2002–July 2003. (TNMHC is the sum of 39 species compris-ing ethane, ethane, ethyne, propane, propene, i-butane, n-butane, 1-butene, i-butene, trans-2-butene, cis-2-butene, i-pentane, n-pentane, 1,3-butadiene, 1-pentene, isoprene, 2,3-dimethylbutane, methylpentane, 3-methylpentane, n-hexane, 2,2,4-trimethylpentane, 2-methylhexane, 3-2-methylhexane, n-heptane, n-octane, benzene, toluene, ethylbenzene, m-xylene, p-m-xylene, o-m-xylene, isopropylbenzene, propylbenzene, 3-ethlytoluene, 4-ethyltoluene, 1,3,5-trimethylbenzene, 2-ethyltoluene, 1,2,4-trimethylbenzene, and 1,2,3-trimethylbenzene. The chemical analysis was done by Professor Donald Blake’s group at the University of California-Irvine. We refer readers to Colman et al. (2001) for the methodology and the QA/QC details.)